
Recomendados
Mais conteúdo relacionado
Semelhante a Task 1 percapita production
Semelhante a Task 1 percapita production (20)
Último
Último (20)
Task 1 percapita production
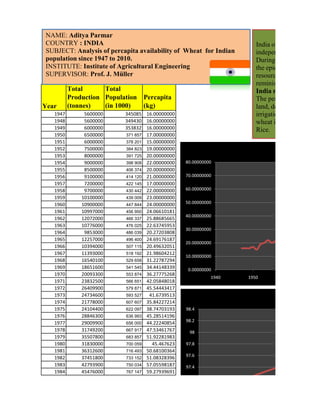
- 1. NAME: Aditya Parmar COUNTRY : INDIA India obtained its indepe SUBJECT: Analysis of percapita availability of Wheat for Indian independence India was population since 1947 to 2010. During partition, India l INSTITUTE: Institute of Agricultural Engineering the epicenter of major cr SUPERVISOR: Prof. J. Müller resource. A couple of b reminiscent of Bengal f Total Total India needed a revolut Production Population Percapita The period 1967 to 1978 Year (tonnes) (in 1000) (kg) land, developed and use 1947 5600000 345085 16.00000000 irrigation techniques. Fi 1948 5600000 349430 16.00000000 wheat in World next to C 1949 6000000 353832 16.00000000 Rice. 1950 6500000 371 857 17.00000000 1951 6000000 378 201 15.00000000 1952 7500000 384 823 19.00000000 1953 8000000 391 725 20.00000000 1954 9000000 398 908 22.00000000 80.00000000 1955 8500000 406 374 20.00000000 1956 9100000 414 120 21.00000000 70.00000000 1957 7200000 422 145 17.00000000 1958 9700000 430 442 22.00000000 60.00000000 1959 10100000 439 009 23.00000000 1960 10900000 447 844 24.00000000 50.00000000 1961 10997000 456 950 24.06610181 40.00000000 1962 12072000 466 337 25.88685665 1963 10776000 476 025 22.63745953 30.00000000 1964 9853000 486 039 20.27203808 1965 12257000 496 400 24.69176187 20.00000000 1966 10394000 507 115 20.49632051 1967 11393000 518 192 21.98604212 10.00000000 1968 16540100 529 658 31.22787294 1969 18651600 541 545 34.44148339 0.00000000 1970 20093300 553 874 36.27775268 1940 1950 1971 23832500 566 651 42.05848018 1972 26409900 579 871 45.54443417 1973 24734600 593 527 41.6739513 1974 21778000 607 607 35.84227214 1975 24104400 622 097 38.74703193 98.4 1976 28846300 636 993 45.28514196 98.2 1977 29009900 656 000 44.22240854 1978 31749200 667 917 47.53461767 98 1979 35507800 683 857 51.92281983 1980 31830000 700 059 45.467623 97.8 1981 36312600 716 493 50.68100364 97.6 1982 37451800 733 152 51.08328396 1983 42793900 750 034 57.05598187 97.4 1984 45476000 767 147 59.27939691 97.2
- 2. 1985 44068800 784 491 56.17503435 97.2 1986 47051800 802 052 58.66429032 97 1987 44322900 819 800 54.06550015 2005 2010 2015 1988 46169400 837 700 55.11450151 1989 54110200 855 707 63.23446853 1990 49849500 873 785 57.05004593 1991 55134500 891 910 61.81620217 1992 55689500 910 065 61.19291034 1993 57210100 928 226 61.63380131 Due to the adoption of new dwarf, high 1994 59840000 946 373 63.23086142 cultivation and by a substantial increase in fertilize 1995 65767400 964 486 68.18905555 was made possible during the Green Revolution pe 1996 62097400 982 553 63.20003502 1997 69350200 1 000 558 69.31151419 Our estimates from the linear trend is showing a pe 1998 66345000 1 018 471 65.14175741 estimation, some studies have been conducted and 1999 71287500 1 036 259 68.79315095 early stages of the green revolution, is no longer in 2000 76368900 1 053 898 72.46326708 2001 69680900 1 071 374 65.03880328 2002 72766300 1 088 694 66.83815163 At present, the land under irrigation is increasing m 2003 65760800 1 105 886 59.46437381 irrigated land going out of production (due to salin 2004 72156200 1 122 991 64.25357609 under irrigation. We expect the decrease in area 2005 68636900 1 140 043 60.20554334 production. 2006 69354500 1 157 039 59.94139146 2007 75806700 1 173 972 64.57285519 2008 78570200 1 190 864 65.97749296 2009 80680000 1 207 740 66.80243492
- 3. Motivation India obtained its independence from British colonization in 1947. Unfortunately after independence India was divided into three parts which are current India, Pakistan and Bangladesh. During partition, India lost western Punjab to Pakistan,which was the fertile river basin and was the epicenter of major crop production for undivided India, thus losing a major agricultural resource. A couple of bad monsoon seasons followed. In 1955, India faced a food crisis reminiscent of Bengal famine of 1943. India needed a revolution. The period 1967 to 1978 is known as Green Revolution. India promoted increased farming land, developed and used grains hardened against pests, promoted double crop year and better irrigation techniques. Finally, India is not only self sufficient. India is second largest producer of wheat in World next to China and it has become an exporter for many of the grains, especially Percapita (kg/year) 1960 1970 1980 1990 2000 2010 Estimated Percapita ( kg/Year)
- 4. 2020 2025 2030 2035 2040 2045 2050 Discussion on of new dwarf, high-yielding and fertilizer-responsive varieties, marked increase in the area under a substantial increase in fertilizer application, irrigation and pesticide application this increase in the yield during the Green Revolution period of 1970s to 1980s. trend is showing a percapita avialability of just above 98kg/year. This is a very generous studies have been conducted and it is seen that the area under cultivation, which increased rapidly in the green revolution, is no longer increasing – in fact there is a decrease in the last two decades. nd under irrigation is increasing more slowly than in the past two or three decades and in future, the rate ng out of production (due to salinity, water logging, etc.) may well exceed the rate of new land brought We expect the decrease in area under cultivation contributes towards a decrease in the growth rate of
- 5. akistan and Bangladesh. e river basin and was ajor agricultural d a food crisis creased farming crop year and better nd largest producer of he grains, especially 2020
- 6. 2055 in the area under his increase in the yield s a very generous creased rapidly in the nd in future, the rate of of new land brought e in the growth rate of
- 7. India Population (thousands) Constant-fertility variant 98.4 2010-2100 98.2 Wheat Year Population Production 98 (tonnes) Percapita 2010 1224614 118906400 97.097044 97.8 2015 1318007 128245700 97.302746 97.6 2020 1414971 137942100 97.487581 2025 1512649 147709900 97.649818 97.4 2030 1610207 157465700 97.792209 2035 1709142 167359200 97.920009 97.2 2040 1810775 177522500 98.036752 2045 1914619 187906900 98.143234 97 2005 2010 2050 2019849 198429900 98.239967
- 8. Estimated Percapita 2010 2015 2020 2025 2030 2035 2040 2045 2050
- 9. 2055