
Recomendados
Mais conteúdo relacionado
Semelhante a Group 6 final_version
Semelhante a Group 6 final_version (19)
Último
Último (20)
Group 6 final_version
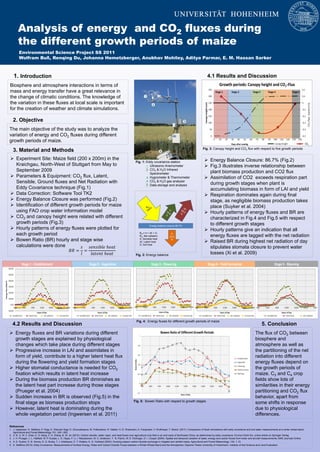
- 1. Analysis of energy and CO2 fluxes during the different growth periods of maize Environmental Science Project SS 2011 Wolfram Buß, Renqing Du, Johanna Hemetzberger, Anubhav Mohiley, Aditya Parmar, E. M. Hassan Sarker 1. Introduction 4.1 Results and Discussion Biosphere and atmosphere interactions in terms of mass and energy transfer have a great relevance in the change of climatic conditions. The knowledge of 1 the variation in these fluxes at local scale is important 2 for the creation of weather and climate simulations. 2. Objective 3 The main objective of the study was to analyze the variation of energy and CO2 fluxes during different 4 growth periods of maize. Fig. 3: Canopy height and CO2 flux with respect to five growth periods 3. Material and Methods 5 Experiment Site: Maize field (200 x 200m) in the Energy Balance Closure: 86.7% (Fig.2) Fig. 1: Eddy covariance station Kraichgau, North-West of Stuttgart from May to 1 Ultrasonic Anemometer Fig.3 illustrates inverse relationship between September 2009 2 CO2 & H2O Infrared plant biomass production and CO2 flux Spectrometer Parameters & Equipment: CO2 flux, Latent, 3 Hygrometer & Thermometer Assimilation of CO2 exceeds respiration part Sensible, Ground fluxes and Net Radiation with 4 CO2 & H2O gas analyzer 5 Data storage and analysis during growth stages when plant is Eddy Covariance technique (Fig.1) accumulating biomass in form of LAI and yield Data Correction: Software Tool TK2 Respiration dominates again during final Energy Balance Closure was performed (Fig.2) stage, as negligible biomass production takes Identification of different growth periods for maize place (Suyker et al. 2004) using FAO crop water information model Hourly patterns of energy fluxes and BR are CO2 and canopy height were related with different characterized in Fig.4 and Fig.5 with respect growth periods (Fig.3) to different growth stages Energy balance closure 86.7% Hourly patterns of energy fluxes were plotted for Hourly patterns give an indication that all RN = H + λE + G each growth period RN: Net radiation G 23.2 energy fluxes are tagged with the net radiation Bowen Ratio (BR) hourly and stage wise H: Sensible heat λE: Latent heat % Raised BR during highest net radiation of day calculations were done ������ ������������������������������������������������ ℎ������������������ G: Soil heat stipulates stomata closure to prevent water ������������ = = ������ ������������������������������������ ℎ������������������ Fig. 2: Energy balance losses (Xi et al. 2009) Fig. 4: Energy fluxes for different growth periods of maize 4.2 Results and Discussion 5. Conclusion Energy fluxes and BR variations during different The flux of CO2 between growth stages are explained by physiological biosphere and changes which take place during different stages atmosphere as well as Progressive increase in LAI and assimilates in the partitioning of the net form of yield, contribute to a higher latent heat flux radiation into different during the flowering and yield formation stages energy fluxes depend on Higher stomatal conductance is needed for CO2 the growth periods of fixation which results in latent heat increase maize. C3 and C4 crop During the biomass production BR diminishes as fields show lots of the latent heat part increase during those stages similarities in their energy (Prueger et al. 2004) partitioning and CO2 flux Sudden increase in BR is observed (Fig.5) in the behavior, apart from Fig. 5: Bowen Ratio with respect to growth stages final stage as biomass production stops some shifts in response However, latent heat is dominating during the due to physiological whole vegetation period (Ingwersen et al. 2011) differences. References 1. J. Ingwersen, K. Steffens, P. Högy, K. Warrach-Sagi, D. Zhunusbayeva, M. Poltoradnev, R. Gäbler, H.-D. Wizemann, A. Fangmeier, V. Wulfmeyer, T. Streck. (2011): Comparison of Noah simulations with eddy covariance and soil water measurements at a winter wheat stand, Agricultural and Forest Meteorology 151, 345 –355. 2. X. B. Ji, W. Z. Zhao, E. S. Kang, Z. H. Zhang, B. W. Jin (2010): Carbon dioxide, water vapor, and heat fluxes over agricultural crop field in an arid oasis of Northwest China, as determined by eddy covariance, Envrion Earth Sci, online article on Springer-Verlag. 3. J. H. Prueger, J. L. Hatfield, W. P. Kustas, L. E. Hipps, F. Li, I. Macpherson, M. C. Anderson, T. B. Parkin, W. E. Eichinger, D. I. Cooper (2004): Spatial and temporal variation of water, energy and carbon fluxes from tower and aircraft measurements, AMS Journals Online. 4. A. E. Suyker, S. B. Verma, G. G. Burba, T. J. Arkebauer, D. T. Walters, K. G. Hubbard (2004): Growing season carbon dioxide exchange in irrigated and rainfed maize, Agricultural and Forest Meteorology, 124, 1-13. 5. K. Steffens (2010): Eddy-Covariance- Measurements of Surface Energy, Water and Carbon Dioxide Fluxes between a Winter Wheat Stand and the Atmosphere, Diploma Thesis University of Hohenheim, Institute of Soil Science and Land Evaluation.