ICT role in 21st century education and it's challenges.
Atomic emission spectra
1. Atomic Emission Spectra - Origin of Spectral
Lines
When a sample of gaseous atoms of an element at low pressure is
subjected to an input of energy, such as from an electric discharge, the
atoms are themselves found to emit electromagnetic radiation.
On passing through a very thin slit and then through a prism the light
(electromagnetic radiation) emitted by the excited atoms is separated
into its component frequencies.
Solids, liquids and dense gases glow at high temperatures. The
emitted light, examined using a spectroscope, consists of a continuous
band of colours as in a rainbow. A continuous spectrum is observed.
This is typical of matter in which the atoms are packed closely together.
Gases at low pressure behave quite differently.
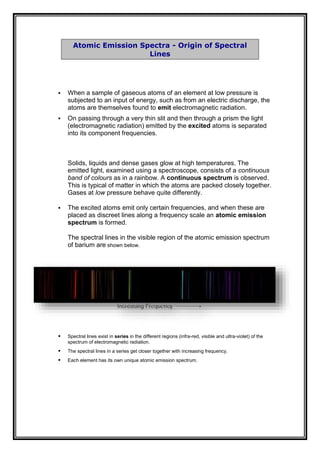
The excited atoms emit only certain frequencies, and when these are
placed as discreet lines along a frequency scale an atomic emission
spectrum is formed.
The spectral lines in the visible region of the atomic emission spectrum
of barium are shown below.
Spectral lines exist in series in the different regions (infra-red, visible and ultra-violet) of the
spectrum of electromagnetic radiation.
The spectral lines in a series get closer together with increasing frequency.
Each element has its own unique atomic emission spectrum.
2. The problem was now to explain the observations outlined above...
It was necessary to explain how electrons are
situated in atoms and why atoms are stable.
Much of the following discussion refers to
hydrogen atoms as these contain only one proton
and one electron making them convenient to
study.
Principal Quantum Levels, denoted by the
Principal Quantum Number, n. Principal Quantum
Level n = 1 is closest to the nucleus of the atom
and of lowest energy. When the electron
occupies the energy level of lowest energy the
atom is said to be in its ground state. An atom
can have only one ground state. If the electron
occupies one of the higher energy levels then the
atom is in an excited state. An atom has many
excited states.
Here's what happens...
When a gaseous hydrogen atom in its ground state is excited by an input of energy, its
electron is 'promoted' from the lowest energy level to one of higher energy. The atom does
not remain excited but re-emits energy as electromagnetic radiation. This is as a result of an
electron 'falling' from a higher energy level to one of lower energy. This electron transition
results in the release of a photon from the atom of an amount of energy (E = h) equal to the
difference in energy of the electronic energy levels involved in the transition. In a sample of
gaseous hydrogen where there are many trillions of atoms all of the possible electron
transitions from higher to lower energy levels will take place many times. A prism can now be
used to separate the emitted electromagnetic radiation into its component frequencies
(wavelengths or energies). These are then represented as spectral lines along an increasing
frequency scale to form an atomic emission spectrum.
The Bohr theory was a marvellous success...
The Bohr theory was a marvellous success in explaining the spectrum of the hydrogen atom.
His calculated wavelengths agreed perfectly with the experimentally measured wavelengths
of the spectral lines. Bohr knew that he was on to something; matching theory with
experimental data is successful science. More recent theories about the electronic structure
of atoms have refined these ideas, but Bohr's 'model' is still very helpful to us.
For clarity, it is normal to consider electron transitions from higher energy levels to the same
Principal Quantum Level. The diagram below illustrates the formation of aseries of spectral
lines in the visible region of the spectrum of electromagnetic radiation for hydrogen, called
the Balmer Series.
3. Atomic SpectrumA
mi
Light emitted or absorbed by single atoms contributes only very little to the colours
of our surroundings. Neon signs (or other gas discharge tubes) as used for
advertising, sodium or mercury vapour lamps show atomic emission; the colours of
due to it. The aurora borealis (northern light) is very rare at ourfireworks are
latitudes, and to appreciate the colours of cosmic objects, powerful telescopes are
necessary. Neon, which gives red colour in a gas discharge, is a colourless gas. If the
is spread out into different colours by a simple glass prism, thelight of the sun
narrow absorption lines cannot be seen.
Atomic structure
Only with quantum theory atomic structure can be understood. Quantum theory is, so
to say, the mathematical formulation of particle–wave duality. While we cannot
dive into mathematical details here, the basic principles shall be sketched.
Waves always have some spatial extension, while one may imagine the elementary,
indivisible particles as being "pointlike". The fact that these apparently contradictory
attributes are compatible in matter waves and also in light (photons) is hard to
understand, but all experimental data point out that this is the case.
Thus the electrons bound by electric force to an atomic nucleus (which contains
almost all of the atom's mass) must be considered to be waves. Wavefunctions are
used to calculate observable quantities; in particular, the probability to find the
(pointlike) particle in some volume is given by the squared value of the wavefunction
integrated over the volume.
The hydrogen atom is the simplest of all atoms. Its nucleus carries one unit of positive
elementary charge and thus binds only one electron to it. Its possible wavefunctions
can be obtained as solutions of the Schrödinger equation. This is described in detail in
all textbooks on quantum mechanics. For us it is important to realize that the electron
forms some kind of standing wave. Some simple examples will be used to
demonstrate general properties of oscillating systems, standing waves in particular.
4. Normal modes
The exact way how a guitar's string vibrates depends on the spot where it
has been plucked. It is always possible to describe the motion of the string
as a superposition of simple modes which have the peculiar property that all
parts of the string move sinusoidally with the same frequency and phase.
These are called normal modes or eigenmodes. The superposition of
different normal modes is heard as superposition of ground- and overtones.
The picture below shows how a string vibrates in the lowest three normal
modes. The motion is so fast that it cannot be resolved by the eye, one sees a
sequence of nodes and antinodes.
Important properties of three-dimensional waves cannot be seen on strings;
vibrating membranes show somewhat more. Instead of nodes the normal
modes exhibit nodal lines. In the case of vibrating metal plates, the nodal
lines are known from classroom demonstrations as Chladni figures.
5. The Bohr Model of the Atom
Niels Bohr proposed a model for the hydrogen atom
that explained the spectrum of the hydrogen atom.
The Bohr model was based on the following
assumptions.
The electron in a hydrogen atom travels
around the nucleus in a circular orbit.
The energy of the electron in an orbit is
proportional to its distance from the nucleus.
The further the electron is from the nucleus, the more energy it has.
Only a limited number of orbits with certain energies are allowed.
In other words, the orbits are quantized.
The only orbits that are allowed are those for which the angular
momentum of the electron is an integral multiple of Planck's
constant divided by 2p.
Light is absorbed when an electron jumps to a higher energy orbit
and emitted when an electron falls into a lower energy orbit.
The energy of the light emitted or absorbed is exactly equal to the
Finally, Bohr restricted the number of orbits on the hydrogen atom by
limiting the allowed values of the angular momentum of the electron. Any
object moving along a straight line has a momentum equal to the product
of its mass (m) times the velocity (v) with which it moves. An object moving
in a circular orbit has an angular momentum equal to its mass (m) times
the velocity (v) times the radius of the orbit (r). Bohr assumed that the
angular momentum of the electron can take on only certain values, equal
to an integer times Planck's constant divided by 2p.
Bohr then used classical physics to show that the energy of an electron in
any one of these orbits is inversely proportional to the square of the
integer n.
The difference between the energies of any two orbits is therefore given by
6. The Bohr Model vs. Reality
At first glance, the Bohr model looks like a two-dimensional model of the atom
because it restricts the motion of the electron to a circular orbit in a two-dimensional
plane. In reality the Bohr model is a one-dimensional model, because a circle can be
defined by specifying only one dimension: its radius, r. As a result, only one
coordinate (n) is needed to describe the orbits in the Bohr model.
Unfortunately, electrons aren't particles that can be restricted to a one-dimensional
circular orbit. They act to some extent as waves and therefore exist in three-
dimensional space. The Bohr model works for one-electron atoms or ions only
because certain factors present in more complex atoms are not present in these atoms
or ions. To construct a model that describes the distribution of electrons in atoms that
contain more than one electron we have to allow the electrons to occupy three-
dimensional space. We therefore need a model that uses three coordinates to describe
the distribution of electrons in these atoms.
Wave Functions and Orbitals
We still talk about the Bohr model of the atom even if the only thing this model can
do is explain the spectrum of the hydrogen atom because it was the last model of the
atom for which a simple physical picture can be constructed. It is easy to imagine an
atom that consists of solid electrons revolving around the nucleus in circular orbits.
Erwin Schrdinger combined the equations for the behavior of waves with the de
Broglie equation to generate a mathematical model for the distribution of electrons in
an atom. The advantage of this model is that it consists of mathematical equations
known as wave functions that satisfy the requirements placed on the behavior of
electrons. The disadvantage is that it is difficult to imagine a physical model of
electrons as waves.
The Schrdinger model assumes that the electron is a wave and tries to describe the
regions in space, or orbitals, where electrons are most likely to be found. Instead of
trying to tell us where the electron is at any time, the Schrdinger model describes the
probability that an electron can be found in a given region of space at a given time.
This model no longer tells us where the electron is; it only tells us where it might be.
7. Emission Spectrum of Hydrogen
When an electric current is passed through a glass tube that contains
hydrogen gas at low pressure the tube gives off blue light. When this light is
passed through a prism (as shown in the figure below), four narrow bands of
bright light are observed against a black background.
The Schrödinger equation supplies both the energies and the wavefunctions
of the possible states of an electron in a Coulomb potential well (hydrogen
atom and hydrogenlike ions). The zero of the energy scale is chosen to
correspond to infinite separation of an electron at rest from the nucleus.
Then the energies of the bound states are negative and the absolute values
are equal to the minimum energy necessary to ionize the atom i.e. to
separate the electron from the nucleus.
E1 = –13.6 eV
For an electron in a Coulomb potential, the energies depend only on the
principal quantum number (which we have introduced by simply numbering
the energies):
En = E1/n2
,
and thus the following level scheme results:
Transitions from lower to higher states can occur if the necessary energy is
supplied by an electromagnetic wave or by a collision with an other particle
(if the temperature is high enough), and vice versa transitions from higher to
lower states can occur through emission of radiation or in collisions with
other atoms or molecules. The emitted photons carry the energy difference
between initial and final state of the atom. For photons, the basic quantum
mechanical relation between energy and frequency νholds (h is the Planck
constant):
Ephoton = h ν
1/λ = (1/nf
2
– 1/ni
2
) |E1| / hc
8. Hydrogen Spectrum
This spectrum was produced by exciting a glass tube of hydrogen gas with
about 5000 volts from a transformer. It was viewed through a diffraction
grating with 600 lines/mm. The colors cannot be expected to be accurate
because of differences in display devices.
At left is a hydrogen spectral tube excited by a 5000 volt transformer. The
three prominent hydrogen lines are shown at the right of the image through a
600 lines/mm diffraction grating.
An approximate classification of spectral colors:
Violet (380-435nm)
Blue(435-500 nm)
Cyan (500-520 nm)
Green (520-565 nm)
Yellow (565- 590 nm)
Orange (590-625 nm)
Red (625-740 nm)
9. Measured Hydrogen Spectrum
The measured lines of the Balmer series of hydrogen in the
nominal visible regionare:
Wavelength
(nm)
Relative
Intensity
Transition Color
383.5384 5 9 -> 2 Violet
388.9049 6 8 -> 2 Violet
397.0072 8 7 -> 2 Violet
410.174 15 6 -> 2 Violet
434.047 30 5 -> 2 Violet
486.133 80 4 -> 2 Bluegreen (cyan)
656.272 120 3 -> 2 Red
656.2852 180 3 -> 2 Red
The red line of deuterium is measurably different at 656.1065 ( .1787
nm difference).
10. Flame test, spectroscopy
Hydrogen is a colourless gas; under "normal" circumstances the atoms are bound in
pairs to H2-molecules and nothing can be seen of the possibility that light may be
absorbed or emitted. Air (mainly nitrogen and oxygen) and the noble gases are
colourless, and the same holds for many other substances. To observe emission of
light or even spectral lines, one has to supply energy to excite the atoms.
In a gas discharge tube, the molecules are broken by collisions with electrons and
ions, atoms are excited or even ionized by collisions, and then emission of light as
well as absorption can be observed.
High temperatures have the same effect: in the sun there is atomic hydrogen in
excited states, and in the solar spectrum the absorption lines of hydrogen can be seen.
The temperature of the flame of a Bunsen burner is sufficiently high to split molecules
and to ionize atoms which after recombination give off their energy by emission of
photons. With traces of alkali metal or alkaline earth metal ions (and other substances
as well) flames can be coloured; this is used in pyrotechnics and also for quick tests
on these substances in minerals etc., see e.g the Wikipedia "Flame test".
Lithium:
Crimso
n
Sodium:
intense
orange-
yellow
Potassium
:
Lilac
Calcium:
Red-
orange
Strontium
:
Crimso
n
Barium:
Light
green
Copper:
Blue-
green
Boron:
Bright
green
Lithium Boron Copper Calcium
The spectra which, after the one of hydrogen, are the simplest to explain, are those of
the alkali metals. These atoms have a single, relatively weakly bound electron in the
outermost shell in addition to the spherical, noble-gas like core. The transitions of the
outer electron from the low lying excited states to the ground state produce the visible
part of the spectrum.
The sodium spectrum is dominated by a line of 589 nm wavelength, coming from the
transition from the 3p state to the 3s state. (In fact, due to fine structure splitting of the
p state, which has not been dealt with here, this line is actually a doublet, i.e. two very
closely neighbouring lines.)
11. Amr Mohamed Farok
Sec6
Faculty of Science ,Helwan University
Second year.-Physical&chemistry deparment
SupervisionUnder
Dr/ ElZine Nasr