SlideShare uma empresa Scribd logo
1 de 88
Baixar para ler offline
Future Inspection of Overhead
     Transmission Lines


           1016921
Future Inspection of Overhead
Transmission Lines

1016921


Technical Update, May 2008


EPRI Project Manager
A. Phillips
DISCLAIMER OF WARRANTIES AND LIMITATION OF LIABILITIES


THIS DOCUMENT WAS PREPARED BY THE ORGANIZATION(S) NAMED BELOW AS AN ACCOUNT OF WORK
SPONSORED OR COSPONSORED BY THE ELECTRIC POWER RESEARCH INSTITUTE, INC. (EPRI). NEITHER EPRI,
ANY MEMBER OF EPRI, ANY COSPONSOR, THE ORGANIZATION(S) BELOW, NOR ANY PERSON ACTING ON
BEHALF OF ANY OF THEM:

(A) MAKES ANY WARRANTY OR REPRESENTATION WHATSOEVER, EXPRESS OR IMPLIED, (I) WITH RESPECT
TO THE USE OF ANY INFORMATION, APPARATUS, METHOD, PROCESS, OR SIMILAR ITEM DISCLOSED IN THIS
DOCUMENT, INCLUDING MERCHANTABILITY AND FITNESS FOR A PARTICULAR PURPOSE, OR (II) THAT SUCH
USE DOES NOT INFRINGE ON OR INTERFERE WITH PRIVATELY OWNED RIGHTS, INCLUDING ANY PARTY’S
INTELLECTUAL PROPERTY, OR (III) THAT THIS DOCUMENT IS SUITABLE TO ANY PARTICULAR USER’S CIRCUM-
STANCE; OR

(B) ASSUMES RESPONSIBILITY FOR ANY DAMAGES OR OTHER LIABILITY WHATSOEVER (INCLUDING ANY
CONSEQUENTIAL DAMAGES, EVEN IF EPRI OR ANY EPRI REPRESENTATIVE HAS BEEN ADVISED OF THE POS-
SIBILITY OF SUCH DAMAGES) RESULTING FROM YOUR SELECTION OR USE OF THIS DOCUMENT OR ANY
INFORMATION, APPARATUS, METHOD, PROCESS, OR SIMILAR ITEM DISCLOSED IN THIS DOCUMENT.

ORGANIZATION(S) THAT PREPARED THIS DOCUMENT

  Southwest Research Institute


NOTE


For further information about EPRI, call the EPRI Customer Assistance Center at 800.313.3774 or
e-mail askepri@epri.com.
Electric Power Research Institute and EPRI are registered service marks of the Electric Power Research
Institute, Inc.
Copyright © 2008 Electric Power Research Institute, Inc. All rights reserved.
Citations

This report was prepared by

	   Southwest Research Institute
    6220 Culebra Road
    San Antonio, Texas 78238

	   Principal Investigators
      J. Major
      J. Alvarez
      E. Franke
      G. Light
      P. Allen
      S. Edwards

	   Electric Power Research Institute
    1300 West WT Harris Boulevard,
    Charlotte, NC 28262

	   Principal Investigator
      A. Phillips


This report describes research sponsored by the Electric Power Research Institute (EPRI).

This publication is a corporate document that should be cited in the literature in the following manner:

	   Future Inspection of Overhead Transmission Lines. EPRI, Palo Alto, CA: 2008. 1016921.


                                 Future Inspection of Overhead Transmission Lines                     iii
Product Description

Results and Findings
This report documents scenarios and technologies that can be applied in the future for the inspection
of transmission lines. Scenarios describe the utilization of a range of concepts, including distributed
sensors, unmanned airborne vehicles, RF communication, and robotics. An approach to performing
demonstration projects using currently available technologies is provided and will be implemented in
the following phases of the project.

Challenges and Objectives
Possible visions for the inspection of transmission lines in a multi-decade time frame are provided here.
As the requirements for transmission line reliability and availability become more stringent and the
availability of qualified personnel is reduced, technology will become a major enabler. This report
documents possible technologies and scenarios that may help in meeting these challenges.

Applications, Value, and Use
A demonstration of some of the concepts using some of the currently available technologies will be
underway in 2009. This document serves as a roadmap for the demonstration.

EPRI Perspective
This report provides a vision for the future of inspection and assessment of transmission lines and sets
the basis for technology development and demonstrations in the future.

Approach
Utility staff familiar with transmission line inspection, experts in sensing and communicating technol-
ogy, and transmission system researchers collaborated to develop this document.

Keywords
Transmission line
Inspection
Assessment
Future


                                  Future Inspection of Overhead Transmission Lines                      v
Acknowledgments

The participation of utility representatives in the brainstorming and document development phases is
acknowledged and appreciated. Without this visionary guidance the development of this document
would not have been possible. A special thanks to Alan Holloman from Southern Company, John Kile
from TVA and Bill Hewitt from San Diego Gas and Electric.


                                Future Inspection of Overhead Transmission Lines                  vii
Contents

1 BACKGROUND. .  .  .  .  .  .  .  .  .  .  .  .  .  .  .  .  .  .  .  .  .  .  .  .  .  .  .  .  .  .  .  .  .  .  .  .  .  .  .  .  .  .  .  .  .  . 1-1

2 SYSTEM CONCEPT.  .  .  .  .  .  .  .  .  .  .  .  .  .  .  .  .  .  .  .  .  .  .  .  .  .  .  .  .  .  .  .  .  .  .  .  .  .  .  .  .  .  .  . 2-1
                       .
   2.1  System Architecture............................................................................................. 2-2
   2.2  Communications Considerations........................................................................... 2-7
   2.3  Power Considerations.......................................................................................... 2-9

3 CANDIDATE TECHNOLOGY FOR THE INSTRUMENTED TOWER. .  .  .  .  .  .  .  .  .  .  .  . 3-1
   3.1  Sensing Technology. ........................................................................................... 3-1
                               .
        3.1.1  Optical Image Sensing............................................................................... 3-3
                                            .
        3.1.2  Infrared Image Sensing. ............................................................................. 3-7
                                              .
        3.1.3  Ultraviolet Image Sensing........................................................................... 3-8
                                                .
        3.1.4  Satellite Image Sensing. ............................................................................. 3-9
                                              .
        3.1.5  LIDAR....................................................................................................... 3-10
        3.1.6  Vibration Sensing. ..................................................................................... 3-11
                                      .
        3.1.7  Acoustic Sensing. ...................................................................................... 3-13
                                     .
        3.1.8  Strain Sensing........................................................................................... 3-14
                                 .
        3.1.9  Tilt Sensing................................................................................................ 3-14
        3.1.10  Magnetostrictive Sensing (MsS).................................................................. 3-15
        3.1.11  Ultrasonic Sensing.................................................................................... 3-18
        3.1.12  Electromagnetic-Acoustic Transducer (EMAT)............................................... 3-19
        3.1.13  Eddy Current Sensing. .............................................................................. 3-22
                                            .
        3.1.14  Ground Penetrating Radar......................................................................... 3-24
        3.1.15  Proximity Sensing..................................................................................... 3-24
        3.1.16  Voltage Potential and Half Cell Measurement.............................................. 3-25
                                                                             .
        3.1.17  Radio Frequency Interference Sensing......................................................... 3-27
        3.1.18  Leakage Current Sensing........................................................................... 3-28
        3.1.19  Direct Contact Temperature Sensing. .......................................................... 3-28
                                                                .
        3.1.20  Lightning Strike Sensing............................................................................ 3-29
   3.2  Data Communications Technology........................................................................ 3-30
        3.2.1  RF Wireless Line of Sight (LOS) Transceiver Technology.................................. 3-30
        3.2.2  RF Wireless Backscatter Technology............................................................ 3-35
        3.2.3  RF Wireless Over-the-Horizon Technology.................................................... 3-35
        3.2.4  Infrared Technology................................................................................... 3-36
        3.2.5  Fiber Optic Technology.............................................................................. 3-37
        3.2.6  Free Space Optical Communication Technology........................................... 3-38
                                                                                .
        3.2.7  Data Communication Over Power Line......................................................... 3-39
        3.2.8  Data Communications Summary.................................................................. 3-39
   3.3  Mobile Collection Platforms................................................................................. 3-39
                                          .
        3.3.1  Manned Mobile Platforms. ......................................................................... 3-40
                                                  .
        3.3.2  Unmanned Mobile Platforms....................................................................... 3-40
             3.3.2.1  Unmanned Aerial Vehicles (UAVs)..................................................... 3-40
             3.3.2.2  Balloons......................................................................................... 3-40
                                   .
             3.3.2.3  Satellites......................................................................................... 3-41
             3.3.2.4  Robotic Crawler Platform.................................................................. 3-41


                                                   Future Inspection of Overhead Transmission Lines                                                          ix
4 Demonstration Scenario. .  .  .  .  .  .  .  .  .  .  .  .  .  .  .  .  .  .  .  .  .  .  .  .  .  .  .  .  .  .  .  .  .  .  .  .  .  .  . 4-1

A Appendix – Sensing Technology Summary Table . .  .  .  .  .  .  .  .  .  .  .  .  .  .  .  .  .  .  .  . A-1


            Future Inspection of Overhead Transmission Lines
List of Figures

Figure 2‑1	   Illustration of Sensor Needs for Transmission Lines and Towers . ........................ 2-1
Figure 2‑2	   Conceptual Sketch Showing Possible Scenarios for Inspecting Transmission
              Lines of the Future......................................................................................... 2-2
Figure 2‑3	   Image Showing a Single Structure Illustrating Some of He Concepts. .................. 2-3
                                                                               .
Figure 2‑4	   Sensor System Architecture and Data Flow...................................................... 2-6
Figure 2‑5	   Sensor Functional Diagram............................................................................ 2-7
Figure 2‑6	   Communications Hub Functional Diagram....................................................... 2-8
Figure 2‑7	   Communications Networking Concept............................................................ 2-10

Figure 3‑1	   Mosiac of Images from Pan/Tilt Camera Mounted............................................ 3-4
Figure 3‑2	   Camera Mounted on Static Wire Robot. ......................................................... 3-5
                                                 .
Figure 3‑3	   Illustration of the MsS Guided Wave Technology Showing Transmission
              and Receiving.............................................................................................. 3-16
Figure 3‑4	   A Single MsS Generates and Detects Guided Waves Propagating
              in Both Directions......................................................................................... 3-16
Figure 3‑5	   MsS Wave Reflected by a Defect in a Pipe...................................................... 3-17
Figure 3‑6	   Energized Implementation of EPRI EMAT Device to Inspect
              for Broken Srands Internal to the Conductor Shoe............................................. 3-22
Figure 3‑7	   Cathodic Protection Rectifier Connected to a Pipeline. ...................................... 3-26
                                                                   .

Figure 4-1	   Proposed Demonstration System Sensor/Hub Configuration. ............................. 4-2
                                                                    .


                                       Future Inspection of Overhead Transmission Lines                                          xi
List of Tables

Table 2-1	   List of Sensor Needs..................................................................................... 2-4
Table 2‑2	   Performance Characteristics for Analysis of Communication Technologies........... 2-11
                                                                                   .

Table 3‑1	   Summary Table............................................................................................ 3-2
Table 3‑2	   Summary of IEEE 802 Technology.................................................................. 3-32
Table 3‑3	   Summary of Non-Standardized RF LOS Technology.......................................... 3-33
Table 3‑4	   Summary of IEEE 802 Technology.................................................................. 3-34
Table 3‑5	   Summary of RF Backscatter Technology........................................................... 3-35
Table 3‑6	   Summary of SATCOM Technology................................................................. 3-36
                                         .
Table 3‑7	   Summary of Infrared Technology ................................................................... 3-37
Table 3‑8	   Summary of Fiber Optic Technology .............................................................. 3-38
Table 3‑9	   Summary of Free Space Optical Technology.................................................... 3-38

Table A‑1	   Sensing Technology Summary Table............................................................... A-2


                                     Future Inspection of Overhead Transmission Lines                                        xiii
Background


1   BACKGROUND


    T   ransmission line components are currently inspected  assessed utilizing field personnel, whether
        ground based or airborne. EPRI, and others, have in the past, and are currently developing inspection
    technologies for implementation using traditional manned inspection methods. The consideration for
    automated/unmanned implementation of inspection technologies is generally not accounted for in
    developments, as viable approaches for automated inspection are not in place and it is a futuristic
    thought rather than a present day reality. With the advent of transmission line security issues the pressure/
    opportunity for automated, unmanned/continuous monitoring on transmission lines is increasing with
    a nearer term focus. Technology developments in sensors, robotics, unmanned vehicles, satellite and
    wireless data communications could be leveraged to enable the development of an effective automated
    inspection system for transmission line/tower monitoring applications.

    A meeting was held on May 16, 2007, with EPRI and some of their electric power utility members, in
    order to kick off this effort.

    EPRI provided the following reports for reference:

        ■    Overhead Transmission Inspection and Assessment Guidelines – 2006, 4th Edition
             (1012310)
        ■    Airborne Inventory and Inspection of Transmission Lines, Airborne Patrol System
             Advanced Prototype, Technical Progress, November 2000 (1001168)
        ■    Airborne Inventory and Inspection of Transmission Lines, Unmanned Airborne Vehicle
             (UAV), Final Report, September 2000 (1000712)
        ■    Airborne Inventory and Inspection of Transmission Lines, Avcan System Corporation’s
             Helicopter Patrol System, Final Report, March 2000 (TR-114773)
        ■    Airborne Inventory and Inspection of Transmission Lines, Airborne Patrol System, Final
             Report, December 1999 (TR-114229)
        ■    Airborne Inventory and Inspection of Transmission Lines, Unmanned Airborne Vehicles
             (UAV), Final Report, December 1999 (TR-113682)


    The objectives and outline of this document are as follows:

        1. Document the system concept as agreed upon at the kick off meeting
        2. Address candidate technology for the system
        3. Address demonstration scenarios for potential near future implementation


                                       Future Inspection of Overhead Transmission Lines                       1-
System Concept


2   SYSTEM CONCEPT


    A    system concept is defined for the instrumentation of electric power utility towers with sensor technology
         designed to increase the efficiency, reliability, safety, and security of electric power transmission.

    The system concept is fueled by a list of sensing needs that was generated at the kickoff meeting and is
    provided for reference in Figure 2‑2. The variety of sensor needs is illustrated in Figure 2‑1.

    It was agreed that the system scope is limited to transmission line applications (i.e., 69 kV and above),
    not distribution, with the focus on steel lattice and pole structures, not wooden.

    It was also agreed that the addition of wiring to interconnect and/or power distributed sensors is not
    viable because of electromagnetic susceptibility concerns and labor intensive installation. Consequently,
    sensor concepts will rely on wireless and/or fiber optic technology.

    Figure 2‑2 and Figure 2‑3 shows some of the high level concepts that are listed below:

        ■    Sensors distributed on transmission structures and/or conductors.
        ■    Sensors that may or may not communicate with “hub” installed on the structure – either
             wireless or wired.
        ■    Sensor information is collected, stored and analyzed in a “central database” which is
             part of the utility’s current data management system. The data is collected/communicated
             from the sensors/“hubs” to the “central database” using one of the following methods:

             ■   Wirelessly back to the “central database” from the individual structure “hub”, e.g.
                 RF directly, via satellite or cell phone network.


        Figure 2‑1
        Illustration of Sensor Needs for Transmission Lines and Towers


                                       Future Inspection of Overhead Transmission Lines                        2-
System Concept


          ■   Collected using a vehicle traveling the length of the line. The data from the collection
              vehicle is transferred during or after the inspection. The following is a list of possible
              data collection vehicles:
              –   Unmanned Airborne Vehicle (UAV)
              –   Manned Aerial Vehicle
              –   “Line Crawler” Robot

          ■   If the vehicle data collection approach is utilized:
              –   The vehicle may collect the data wirelessly directly from the sensors (possibly
                  excluding the need for a structure “hub”).
              –   The vehicle may also have sensors aboard recording data during the collection
                  process, (e.g. video, UV, IR, still images).

 These concepts are discussed in detail in the following sections.


      Figure 2‑2
      Conceptual Sketch Showing Possible Scenarios for Inspecting Transmission Lines
      of the Future


 2.1  System Architecture
 The system is comprised of a) sensors that acquire diagnostic data from components of interest and
 b) communications hubs that collect the sensor data and relay it to a central repository. Sensors may be
 directly attached to the item being monitored, or may be remotely located such as in the case of a camera.
 Communications hubs may be mounted on or near towers or may be located on a wide variety of mobile
 platforms, such as manned airplanes or unmanned line crawlers or UAVs. Sensors and hubs may operate
 and be polled periodically (e.g., at intervals of minutes, hours, days) or continuously monitored (e.g., a
 real time alarm) depending on the application. In any case, sensors communicate their results via hubs
 to a central repository. Figure 2‑4 illustrates the architecture and flow of data.


2-       Future Inspection of Overhead Transmission Lines
System Concept


    Figure 2‑3
    Image Showing a Single Structure Illustrating Some of He Concepts


An important feature of the system is flexibility and interoperability with a wide variety of sensor types
and communications methods. The information that is required for each sensor reading is:

    ■    Unique sensor ID (across all sensor types)
    ■    Raw data measurement or processed result
    ■    Date and time of the reading
    ■    Sensor type and geo-location


The sensor type and geo-location may be associated with the ID and hard coded in a database at
the central repository so that this information doesn’t need to be redundantly transmitted through the
system for every reading. For remote mobile sensors, the geo-location will need to be communicated
so that the system can associate the reading with a particular item (at a known geo-location) or area
of interest.


                                  Future Inspection of Overhead Transmission Lines                     2-
2-
                                                       Table 2-1
                                                       List of Sensor Needs
                                                                                                                     Update
                                                                    Item          Cause                Result                     Probability Consequence           Sensing Technologies
                                                                                                                     Interval
                                                                                                                                                                                                        System Concept


                                                   1    System Tampering      Terrorism          Tower/line down     Real-time       Low         High       Vibration, Acoustic, E-Field, Optical
                                                   2    System encroachment   Man-made           Safety hazard,      3–12 mo         High        Med        Optical, Satellite, Proximity, Vibration,
                                                                                                 Less reliable                                              E-Field
                                                   3    System encroachment   Vegetation         Flashover, Fire     3 mo            High        High       Optical, Satellite, LIDAR, Line-of-Sight,
                                                                                                                                                            Proximity
                                                   4    System encroachment   Avian Nesting,     Flashover           6–12 mo         High        High       Optical, Vibration, Leakage Current,
                                                                              Waste                                                                         Proximity, E-Field
                                                   5    Shield Wire           Corrosion          Flashover, Outage   3–6 years       Med         High       Optical, IR Spectroscopy, Eddy Current,
                                                                                                                                                            MSS
                                                   6    Shield Wire           Lightning          Flashover, Outage   1 year          Med         High       Optical, IR Spectroscopy, Eddy Current,
                                                                                                                                                            MSS, Lightning Detection, Vibration
                                                   7    Insulator (Polymer)   Age, Material      Outage              6 years         Med         High       Optical, Vibration, RFI, UV, IR
                                                                              Failure
                                                   8    Insulator (Ceramic)   Age, Material      Outage              12 years        Low         High       Optical, Vibration, RFI, UV, IR
                                                                              Failure


Future Inspection of Overhead Transmission Lines
                                                   9    Insulator             Contamination      Flashover           3 mo            Med         Med        Optical, RFI, UV, IR, Leakage Current
                                                   10 Insulator               Gun Shot           Outage              Real-time,      Med         High       Optical, Vibration, RFI, UV, IR, Acoustic
                                                                                                                     3 mo
                                                   11 Phase Conductor         External strands   Line Down, Fire     1 year          Low         High       Optical, Vibration, RFI, UV, IR
                                                                              broke
                                                   12 Phase Conductor         Internal strands   Line Down, Fire     1 year          Low         High       E-MAT, MSS, Electromagnetic
                                                                              broke
                                                   13 Phase Conductor         Corrosion of       Line Down, Fire     1 year          Low         High       E-MAT, MSS, Electromagnetic,
                                                                              steel core                                                                    IR Spectroscopy, Optical
Table 2-1
                                                      List of Sensor Needs (Continued)
                                                                                                                             Update
                                                                  Item                  Cause                Result                      Probability Consequence           Sensing Technologies
                                                                                                                             Interval
                                                   14 Connector Splice            Workmanship,        Line Down, Fire        1 year         Med         High       Direct Contact Temperature,
                                                                                  thermal cycling,                                                                 IR Temperature, Ohmmeter, RFI,
                                                                                  age                                                                              E-MAT, MSS
                                                   15 Hardware                    Age                 Line Down, Fire        6 years        Low         High       Optical, IR Spectroscopy
                                                   16 Phase Spacer                Age, galloping      Line Down, Fire        6 years        Low         Med        Optical, UV, RFI
                                                                                  event
                                                   17 Aerial Marker Ball          Vibration Dam‑      Safety concerns        1 year         Low         Med        Optical, UV, RFI
                                                                                  age, Age
                                                   18 Structure (Steel Lattice)   Corrosion           Reliability concerns   10 years       Med         Med        Optical, IR Spectroscopy
                                                   19 Structure (Steel Lattice)   Bent, damaged       Reliability concerns   1 year         Med         Med        Optical, Strain, Position, Tilt
                                                                                  members
                                                   20 Structure (Steel Pole)      Corrosion, age      Reliability concerns   10 years       Med         Med        Optical, IR Spectroscopy
                                                   21 Structure (Steel Pole)      Internal Deterio‑   Reliability concerns   1 year         Med         Med        Optical, MSS, Ultrasonics
                                                                                  ration
                                                   22 Foundation (Grillage)       Age, corrosion      Reliability concerns    10 years      High        High       Excavation, MSS, Radar, GPR Imaging,
                                                                                                                                                                   Half Cell, Voltage Potential
                                                   23 Foundation (Anchor Bolt) Age, corrosion         Reliability concerns   10 years       Low         High       Optical, Ultrasonics, E-MAT, Vibration
                                                   24 Foundation (Preform)        Age, corrosion      Reliability concerns   10 years       Med         High       Optical, Ultrasonics, E-MAT, Vibration
                                                   25 Foundation (Stub Angles) Age, corrosion         Reliability concerns   10 years       Low         High       Optical, Ultrasonics, E-MAT, Vibration
                                                   26 Foundation (Direct          Age, corrosion      Reliability concerns   10 years       High        High       Excavation, MSS, Half Cell, Voltage
                                                      Embedment)                                                                                                   Potential
                                                   27 Foundation (Anchor          Age, corrosion      Reliability concerns   10 years       High        High       Excavation, MSS, Half Cell, Voltage
                                                      Rods, Screw-In)                                                                                              Potential, Ultrasonics
                                                   28 Grounding                   Age, corrosion,     Reliability, Light‑    6 years        Med         Med        AC impedance, DC resistance, Impulse


Future Inspection of Overhead Transmission Lines
                                                                                  tampering           ning, Safety
                                                                                                      concerns
                                                                                                                                                                                                             System Concept


                                                   29 TLSA (Transmission Line     Lightning           Reliability, Lightning 1 year         Med         Med        Optical, IR, Leakage Current, Lightning


 2-
                                                      Surge Arrestor)             Strikes, age        concerns                                                     Strike Counter
System Concept


         UnManned               Manned
           UAV                  Airplane
          Balloon              Helicopter
          Satellite              Truck
       Robotic Crawler         Backpack

               Mobile Platform

         Sensor                Comm
                                Hub

                                                                                                     Central
                                                                                                    Repository

                                            Comm
                                             Hub
                    Sensor
                     Item
                     under                             Item
                      test                             under   Sensor
                                                                         LEGEND
                                                        test
                                                                                  Short Range Data
                 Item
                                                                                   Long Haul Data
                under      Sensor
                  test                                                            Remote Sensing
                                                               Sensor              Direct Sensing

                                                   Sensor        Item
                                       Sensor                   under
                                        Item                      test
                  Sensor               under
                   Item                  test
                  under
                    test
                                                    Item
                                                   under
               Tower Structure                       test


      Figure 2‑4
      Sensor System Architecture and Data Flow


 For flexibility, multiple protocols at the physical layer may be used for both short range communications
 between sensors and hubs, and long haul communication between hubs and the central repository.
 Consequently, every hub type need not read every sensor type, and every hub type need not
 communicate with the central repository. There may be applications where relaying readings
 from one hub to another is an effective method to communicate data back to the central reposi‑
 tory. Similarly, relaying readings between sensors before reaching a hub is also an acceptable
 communications approach.

 With regard to the handling of sensor data, there are system tradeoffs between processing power,
 communications bandwidth, and digital storage capacity. The system must be flexible to allow different
 sensor applications to handle these tradeoffs differently. For example, in some applications it will be
 most efficient and optimum to process sensor data locally at the sensor and to report back the reading
 as a simple answer, e.g. “no encroachment detected”. In other applications it may be desirable to
 have all of the information communicated back to the central repository for archival and possibly even
 human interpretation. In the former case, the amount of data to be passed through the communication
 channel is very low (1 bit, maybe once a day), but the processing power required at the sensor may
 be high in order to make an intelligent decision with high confidence. In the latter case, the amount of
 data passed through the communications channel is very high (maybe 10M byte for a high resolution
 image), with much greater potential for impact to system throughput and storage space. The latter
 approach may be merited when automated results are questionable and manual interpretation of the
 raw data is required.


2-        Future Inspection of Overhead Transmission Lines
System Concept


Hybrid sensing protocols or approaches may be advantageous and are supported by the system
architecture. For example, a flag sensor may simply indicate when an condition needs to be further
evaluated; Whether done remotely or while in the field, it may be desirable to interact with the sensor
in order to control the amount of detailed data that is provided. The flag sensor may conserve power
by not communicating until there is a problem. One possibility is an intelligent sensor that monitors a
system condition, and then, based on the sensed severity, applies a commensurate amount of on-board
resources (power, processing, memory, communications bandwidth) in order to operate effectively and
with high efficiency.

The key functional features of sensors and hubs are illustrated in Figure 2‑5 and Figure 2‑6 respectively.
Sensors typically require a source of power, a sensing mechanism, a controller to format measurements into
readings, and a short range wireless data communications mechanism. Communications hubs have similar
needs for power and controller functions, and in addition need wireless data communication mechanisms
to collect sensor readings (short range) and to relay sensor readings to the central repository (long range).
Hubs may also have local memory for storing readings, either to buffer data when communications links are
down, or as a local repository for data archival/backup.

Although the functional differences between sensors and hubs are delineated in these diagrams, device
implementation is flexible to combine features. In other words, hubs can also incorporate sensors and
sensors can also serve as hubs, it is not a requirement that they are separate devices. For example, a
hub could have a weather station hardwired into it, as well as built-in tower tilt and vibration sensing,
for added value. A distinguishing feature of a combinational device that is thought of as a “sensor”
versus a “hub” may be its power source. Sensor devices are in general expected to harvest power from
the environment and thus require very low maintenance, preferably none. Whereas hubs are in general
expected to be more complex, requiring possibly significant power sources such as large batteries, and
thus would require periodic maintenance.

Conceptually, sensors use a short range wireless link to the hub which uses a long range wireless link to the
central data repository. This is not a requirement, but is based on the vision that many low-cost, low-power,
low-bandwidth sensors will be deployed at a tower site, and that a local hub can help by collecting this
data, providing a local redundant data repository, and coordinating long haul communications.

2.2  Communications Considerations
A communications system for the instrumented tower concept provides a means for communicating
sensor data at transmission line structures to a central data collection and processing facility. A system
for large-scale, distributed monitoring and control is termed a Supervisory Control and Data Acquisi‑

                              Environmentally
                            Hardened Packaging

       Environmental
     Harvesting Desired,
     Otherwise Internal                               Power
     Battery or Fuel Cell


  Interface to Component
         Under Test
   1. Direct Attachment                                          Wireless
 2. Remote (e.g. camera)          Sensor         Controller                                Short Range
                                                              Communications
                                                                                              Wireless
                                                                                       Communications with
                                                                                       other Sensors or Hub


    Figure 2‑5
    Sensor Functional Diagram


                                   Future Inspection of Overhead Transmission Lines                           2-
System Concept


                               Environmentally
                             Hardened Packaging

        Environmental
      Harvesting Desired,
      Otherwise Internal                               Power
      Battery or Fuel Cell


     Short Range
      Wireless
  Communications with             Sensor                          Wireless
      Sensors                                     Controller
                                  Reader                       Communications              Wireless Interface to
                                                                                         Pass Readings to Other
                                                                                          Hubs (Daisy Chain) or
                                                                                         Over Long Haul Link to
                                                                                           Central Repository


                                                Memory to
                                              Store Readings


        Figure 2‑6
        Communications Hub Functional Diagram


 tion (SCADA) system. SCADA systems for wide-area monitoring have long been in existence and offer
 reliability enhancements for electrical power transmission systems. The instrumented tower concept
 requires a customized implementation based on the sensor population, data rates, and ranges, that can
 be interfaced into the central facility SCADA system or operate standalone running its own SCADA.
 This project does not address the SCADA layer, it instead focuses on the hardware making sure that
 the system is realizable with the proper protocols in place.

 Both the transmission line infrastructure and the sensors used for monitoring the infrastructure define
 the requirements for the operational characteristics of the instrumented tower communication system.
 The primary considerations are distance over which the data needs to be communicated (referred to as
 range) and the amount of data to be communicated in a period of time (referred to as data rate).

 Communication system range is influenced by several factors. The structures under consideration are steel
 poles and steel lattices installed over hundreds of miles, and the data that is generated locally needs to be
 collected at a central facility that may be tens to hundreds of miles away. Structures typically range from
 80 to 140 feet in height, although there are extreme cases as high as 300 feet. Structures are typically
 separated by 500 to 1,800 feet, although sometimes they may be closer.

 A variety of sensor configurations are envisioned within the system concept. Some sensors will be
 attached directly to transmission line components, for example conductor splices. Other sensors will
 be mounted to the structures themselves in order to monitor the structure integrity. Sometimes sensors
 mounted on structures will be used to monitor the condition of other components and structures, for
 example a camera with a high F-number lens might monitor a neighboring tower for tampering
 and right-of-way activity between towers. The need for these different sensor configurations leads to a
 distributed sensing system. The communications system will need to coordinate the collection of data
 from many distributed sensors for transfer to a central facility.

 The distributed location of sensors imposes several constraints on the sensor design. Sensors on the
 conductors between towers need to be small, low power, and have a local power source with a limited
 power producing capacity. Sensors on the tower structure can be larger in size and power consump‑
 tion. The constraints of the sensor also apply to the technology selected for communicating the sensor
 data. Because low power consumption is the most restricting constraint for the sensors between towers,


2-           Future Inspection of Overhead Transmission Lines
System Concept


the communication technology is consequently relatively short-range and infrequent to keep power
consumption at a minimum. The opposing requirements of low power consumption and short range
communication versus needing to collect data at a far away central facility influence the architecture
of the communication system.

The required data rate is defined by the type of sensor technology. The temperature sensor for a splice
transmits a very small amount of data, and the data is required infrequently. Thus, the aggregate data
rate is very low. Conversely, the camera output could be a sequence of frames or a continuous video
output that would need to be communicated using a high-speed and possibly continuous data link. The
data rate influences the power requirements for the communication technology.

Since hubs will likely require much higher power consumption than sensors in order to support long
range communications and greater bandwidth, it may be beneficial to incorporate a large solar
panel with battery at the hub. This would dictate additional logistics and periodic maintenance, but
the tradeoff may be worthwhile. On the other hand, it would not be desirable to do that for a large
population of sensors.

Data from each sensor cannot be directly transmitted to the central facility due to range and power
consumption trades. Thus, the communication system requires data communication relays. A number of
architectural options for the communication system are available to accomplish this:

    1. Sensor to passing mobile platform (e.g., robot or a low altitude air vehicle like a UAV or
       a helicopter) to central facility.
    2. Sensor to sensor, daisy chained to central facility (e.g. a mesh network).
    3. Sensor to over-the-horizon platform (e.g., balloon or a satellite) to central facility.
    4. Sensor to hub on a nearby tower. The hub has the similar options of hub to passing platform,
       hub to hub, and hub to over-the-horizon platform for passing data to a central facility, except
       that the hub can possibly be longer range and higher transmitted and consumed power.

Daisy chaining sensors and/or hubs results in an additive effect on the quantity of data to be communicated
at each node. However, the very low duty cycle and data rate of many of the sensors make daisy
chaining possible for certain sensor technologies. Higher data rate sensors may require more restric‑
tions on the number of devices sharing a communication channel. A combination of daisy chaining and
long haul communications may be an effective compromise. For example, towers 1–20 could operate
as a daisy chain with tower 20 transmitting back to the central facility. The next 20 towers could be
configured the same way.

Range and data rate effect the communication system architecture and a number of architectural
options should be considered during the evolution of the instrumented tower concept. To assist the
architectural development process, the fundamental performance characteristics of the communications
system are outlined in Table 2‑2 along with a rough assessment of the associated requirement for the
instrumented tower system concept.

2.3  Power Considerations
Sensors and communications hubs will require power for operation. While batteries may be convenient
to test and demonstrate the system, they are seen as a maintenance problem in the instrumented tower
concept. The goal is to use renewable power sources in lieu of batteries. This is a difficult challenge,
especially for wide range high bandwidth data communications requirements. With present technology,
it is not really possible to implement a batteryless system except for very limited and simple scenarios.
Even over the next 20 years, without significant breakthroughs this will remain a difficult challenge, albeit
a worthy one to keep in mind as new technologies are introduced.


                                   Future Inspection of Overhead Transmission Lines                       2-
System Concept


       Figure 2‑7
       Communications Networking Concept


 Alternatives to batteries include solar, wind, kinetic (line vibration), thermoelectric, radio waves, and the
 electric and magnetic fields that are generated from the power lines themselves. There are significant
 limitations with each of these alternatives, but in the right application they may be effective. For example,
 the EPRI splice sensor (discussed later under candidate technology), when attached to transmission lines
 that carry 100 Amps and greater currents, can harvest the magnetic field that is generated by that current,
 and in turn power the sensor without the need for a battery.

 The use of a rechargeable battery coupled with power harvesting may have strong merit. The present
 challenge with this approach is overcoming a limited number of recharge cycles and low temperature
 operation, but even a compromise solution may still hold high value now while technology improvements
 are anticipated.

 Potential for Harvesting Power from Line Vibration
 For sensors located on or very near a conductor, such as splice sensors or insulator sensors, energy
 harvesting using vibration may be a possible solution.

 Wind causes Aeolian vibrations to occur in transmission lines, the frequency and amplitude of which
 are determined by the wind velocity normal to the conductor length and the diameter of conductor. For
 a typical transmission line application using ACSR Drake conductor, vibration displacement amplitudes
 in the frequency range of 17–35Hz are typically on the order of 5%–12% of the conductor diameter
 when one vibration damper is used on the line, and between 3%–8% of the conductor diameter when
 two vibration dampers are used.1 Using the standard diameter of Drake conductor of 1.108 inches, the
 anticipated vibration displacement in the frequency range of 17–35Hz is between 30 and 100 mils.
 This corresponds with acceleration levels of approximately 0.1g–0.7g.

 The most common approaches to converting vibration energy into electrical power are through
 electrodynamic (moving coil through a magnetic field) and piezoelectric (conversion of strain
 energy to charge in polarized materials) transduction. Piezoelectric energy harvesting has been


       1 
            Transmission Line Reference Book, Wind-Induced Conductor Motion, Electric Power Research Institute, 1979.


2-10           Future Inspection of Overhead Transmission Lines
Table 2‑2
                                                      Performance Characteristics for Analysis of Communication Technologies
                                                   Characteristic                                   Description                                                  Assessment of Requirement
                                                   Range               Distance between communication nodes (i.e., a transmitter and             Short range: several hundred feet (conductor to tower; intra-tower)
                                                                       receiver), which can vary between tens of feet for line to tower          Medium range: a couple of thousand feet (tower to tower)
                                                                       communication or hundreds of miles for tower to central data              Long range: up to 100s of miles (tower to central facility)
                                                                       collection facility communication.
                                                   Frequency Band      Frequency band for transmitting and receiving data, which affects         Unlicensed preferred
                                                                       the need for licensing, meeting regulatory standards, maximum data
                                                                       throughput, certain multiple access schemes, and antenna size.
                                                   Network Topology    Architecture for transferring data among system elements. Common          Dependent upon communication architecture; most likely
                                                                       network topologies include point-to-point, line, star, ring, mesh, and    a point-to-multipoint topology
                                                                       bus.
                                                   Link Availability   Access to the communication channel as determined by line of sight        Burst modes (low data rate/duty cycle sensors)
                                                                       constraints, methods for establishing a link, including link initiation   Continuous (video sensors)
                                                                       and synchronization protocols; and certain aspects of multiple
                                                                       access methods including time-slot restrictions, spatial diversity,
                                                                       and duplexing method.
                                                   Link Robustness     Ability to establish and maintain the communication link when the         Required, but minor outages may be acceptable
                                                                       channel is degraded by such factors as rain, atmospheric conditions,
                                                                       interference, jamming, dense foliage, urban canyons, and multipath.
                                                                       Robustness is determined by link margin, frequency use, frequency
                                                                       diversity, bit error detection and correction techniques, and communica‑
                                                                       tion protocols (e.g., transmit-only or acknowledge with retry protocols).
                                                   Data Throughput     Amount of data through the system in a given time period, as limited     kbps (low data rate/duty cycle sensors)
                                                                       by the data rate (bits/second) of the transmission, continuous or bursty Mbps (video sensors)


Future Inspection of Overhead Transmission Lines
                                                                       nature of the transmission, type of modulation, message length, num‑
                                                                       ber of message bits that contain user data, two-way communication
                                                                       duplexing techniques, media access restrictions, collision handling
                                                                                                                                                                                                                       System Concept


                                                                       and avoidance schemes, and acknowledgement protocols.


 2-11
2-12
                                                      Table 2‑2
                                                      Performance Characteristics for Analysis of Communication Technologies (Continued)
                                                   Characteristic                                  Description                                                   Assessment of Requirement
                                                   Data Availability   System latency, which is the time the data was sent until the time the    Hours, to days, to months
                                                                                                                                                                                                                   System Concept


                                                                       end user receives the data, as affected by the system architecture
                                                                       and data distribution systems.
                                                   System Capacity     Number of simultaneous users and total number of users in a system      Thousands of sensors
                                                                       as limited by constraints of the signal processing system and multiple
                                                                       access methods defined by frequency use, collision avoidance protocols,
                                                                       time-slot restrictions, spatial diversity, and duplexing method.
                                                   Power               Amount of power consumed by the communication equipment on the            Very low power (microwatt)
                                                   Consumption         sensor to communicate data, which defines the types and capacities        Low power
                                                                       of power source for a particular sensing application. Power consump‑
                                                                       tion is primarily affected by the data rate and communication range
                                                                       of the communication equipment for a given technology.
                                                   Size                Dimensions of the communication equipment including the electronics,      As small as practical
                                                                       power source, power regulation and control circuitry, and antenna.
                                                                       The size is dependent upon the technology used and is influenced
                                                                       by the transmitted RF power necessary to close the link, complexity
                                                                       of the transmitted waveform, and the necessity of a receiver if two-way


Future Inspection of Overhead Transmission Lines
                                                                       communication is possible and/or necessary.
                                                   Maturity of         Measure of how long the technology has been available, which              Low risk, widespread availability, roadmap for longevity
                                                   Technology          can indicate the availability and variety of products, the commercial
                                                                       acceptance of a standard or de-facto standard and thus its possible
                                                                       longevity or the importance of long-term support for legacy products.
                                                   Cost of Communi‑    Costs of communication equipment development, production,                 Moderate non-recurring engineering costs, low production costs,
                                                   cating Data         installation, and accessing the infrastructure.                           and low maintenance and infrastructure operation costs
                                                   Human Interface     The need for a person in the loop in order to configure, operate,         Minimize need for human intervention. A highly automated
                                                                       and maintain the system                                                   system is desired
System Concept


     shown to be more efficient than electrodynamic harvesting, and several companies are currently
     developing off the shelf solutions for piezoelectric vibration energy harvesters. One device that is
     currently commercially available can produce up to 2mW of harvested power for vibration levels
     of less than 1g.2 Other researchers have claimed power density values as high as 40mW/cc per
     g of acceleration.3

     A review of several research efforts on power harvesting using piezoelectric materials was performed
     by Sodano, Inman, and Park.4 In this review, both methods of transduction and methods of energy
     storage were evaluated. In most applications, energy generated by vibration energy harvesters must be
     stored for later use. Two methods of storing this energy are the use of storage capacitors and the use of
     rechargeable batteries. One of the research efforts demonstrated that fully discharged batteries could
     be recharged without the use of any external power source. The summarized research concluded that
     rechargeable batteries provided much more versatility than capacitors due to the capacitor’s inability
     to store large amounts of power and the fast discharge rate of capacitors. With optimal vibration
     conditions and power storage circuitry, efficiencies as high as 50% were experimentally obtained by
     one research team, and as high as 70% were obtained by another. This is many times higher than the
     most efficient solar cells currently available.

     As technology evolves, vibration harvesting may provide a viable and affordable means of powering
     distributed sensors, though their application for the smart transmission line concept will probably be
     most feasible on those sensors located on or near a conductor.

     Potential for Harvesting Power from the Wind
     A windmill developed by S. Priya [reference Priya S., Applied Physics Letter 87, 184101 (2005)] of
     approximately 10 cm across, is attached to a rotating cam that flexes a series of piezoelectric crystals
     as it rotates. Piezoelectric materials generate a current when they are squeezed or stretched, and are
     commonly used to make a spark in gas lighters. Priya has found that a gentle breeze of 16 km per
     hour can generate a constant power of 7.5 milliwatts, which is adequate to operate many types of
     electronic sensors. A conventional generator that used a 10-cm turbine would convert only 1% of the
     available wind energy directly into electricity, but a piezoelectric generator can convert up to 18%,
     which is comparable to the average efficiency of the best large-scale windmills, according to Priya.
     Priya has also patented a much smaller device, measuring just 0.5 cm a side, which is driven by a
     smaller turbine fitted with tiny wind-catching cups, similar to the devices used by meteorologists to
     measure wind speed.

     Potential for Optical Power Transmission
     Non-conducting fiber optics can be used to transmit small amounts of power, although the efficiency
     is low. The system consists of an optical source (LED or laser diode) coupled to a fiber optic cable that
     delivers the light to a photovoltaic junction.

     Assuming a 1 watt laser diode or super-bright LED source, rough calculations indicate that 10 to 30 mW
     of power can be generated at a photovoltaic junction (solar cell). This is based on 50% efficiency cou‑
     pling to and from the fiber optic and 4 to 8% photovoltaic conversion efficiency. This example of energy
     conversion efficiencies is only a guide; more accurate calculations with specific components and laboratory
     confirmation should be done if this is to be considered as a viable power option.

         2 
              http://www.mide.com/prod_energy_harvester.html#specifications.
         3 
              http://www.omegasensors.com/datasheets/Energy%20Harvester%20Flyer.pdf.
         4
              “A Review of Power Harvesting from Vibration Using Piezoelectric Materials”, The Shock and Vibration
              Digest, 2004.


                                          Future Inspection of Overhead Transmission Lines                     2-13


System Concept


 Although this efficiency of 1 to 3% is very low, there are cases where this method may be useful for
 powering a remote sensor. For example, if a solar panel and battery is located on top of a tower, a
 sensor at the base of the tower could be operated by a two-fiber cable down the tower. One fiber would
 carry power and the other would be used to transmit control and data signals. For micropower sensors
 that are operated only a few minutes a day, the low efficiency may not be a factor.

 Potential for Other Power Harvesting Methods
 There is good potential for other power harvesting methods as well, although a technical review of
 these technologies is not a focus of this report. In close proximity to a transmission line system, the high
 electric and magnetic fields can be harvested as is demonstrated by the EPRI splice sensor. Solar power
 is also recognized as a prime candidate.


2-14       Future Inspection of Overhead Transmission Lines
Candidate Technology for the Instrumented Tower


3   CANDIDATE TECHNOLOGY FOR THE INSTRUMENTED
    TOWER


    T   here are many sensor, data communications, and mobile collection platform technologies that could
        be applied to the instrumented tower concept. This report attempts to address and provide insight into
    some of the enabling technologies that appear to be suited for the application. Candidate technologies
    are examined with regard to their suitability and state of readiness for the application, expectations
    for development potential over the next 20 years, and design constraints such as power requirements,
    physical requirements (size, weight, attachment, durability), and data/bandwidth requirements
    where applicable.

    This section of the report is organized into three main areas as follows:

        1. Sensing technology
        2. Data communications technology
        3. Mobile collection platforms


    3.1  Sensing Technology
    Sensing needs were a focus of the kickoff meeting and are documented in Table 3‑1. Insight into some
    of the sensing technologies that were identified as candidates to meet those needs is provided in this
    section, organized as follows:

        1. Optical Image Sensing
        2. Infrared Image Sensing
        3. Ultraviolet Image Sensing
        4. Satellite Image Sensing
        5. LIDAR
        6. Vibration Sensing
        7. Acoustic Sensing
        8. Strain Sensing
        9. Tilt Sensing
        10. Magnetostrictive Sensing (MsS)
        11. Ultrasonic Sensing
        12. Electromagnetic Acoustic Transducer (EMAT)
        13. Eddy Current Sensing
        14. Ground Penetrating Radar (GPR)
        15. Proximity Sensing
        16. Voltage Potential and Half Cell Measurement
        17. Radio Frequency Interference Sensing
        18. Leakage Current Sensing
        19. Direct Contact Temperature Sensing
        20. Lightning Sensing and Counting


    Table 3‑3 below summarizes the technologies above addressed in this report and maps them to
    categories of sensing applications derived from the needs documented in Table 2‑1.


                                      Future Inspection of Overhead Transmission Lines                     3-
3-
                                                        Table 3‑1
                                                        Summary Table
                                                                               Candidate
                                                                              Technologies
                                                                                  (2.1)

                                                                                                                                                                                                    Voltage
                                                                                                                                                                                                                       Leak‑
                                                                                             Infra‑ Ultra‑ Satel‑       Vibra‑                                Ultra‑         Eddy           Prox‑     Poten‑                  Temper‑   Light‑
                                                                                Optical                           LIDAR        Acoustic Strain   Tilt   MsS            EMAT           GPR                       RFI     age
                                                                                              red violet lite            tion                                 sonic         Current         imity   tial Half                  ature    ning
                                                                                                                                                                                                                      Current
                                                                                                                                                                                                       Cell
                                                   Application                   3.1.1       3.1.2 3.1.3 3.1.4 3.1.5 3.1.6      3.1.7   3.1.8 3.1.9 3.1.10 3.1.11 3.1.12 3.1.13 3.1.14 3.1.15 3.1.16 3.1.17 3.1.18 3.1.19 3.1.20
                                                                                                                                                                                                                                                 COUNT
                                                   Mechanical/Structural
                                                   Integrity
                                                      Foundation                                                          x                              x      x                      x               x                                           5
                                                      Tower Structure              x                                      x               x       x      x      x       x      x                       x                                  x       10
                                                      Hardware                     x                                                                                                                                                               1
                                                      Connectors, Splices          x                                                                                    x                                                                          2
                                                      Conductors                   x                                                                                    x                                                                          2
                                                                                                                                                                                                                                                         Candidate Technology for the Instrumented Tower


                                                   Electrical/Operational
                                                   Integrity
                                                      Connectors, Splices                     x                                                                                                                                 x                  2
                                                      Conductors                              x                                                                                                                                 x                  2
                                                      Insulators                              x      x                    x                                                                                     x       x                          5
                                                     Transmission Line
                                                                                              x      x                                                                                                          x       x                 x        5
                                                      Surge Arrestors


Future Inspection of Overhead Transmission Lines
                                                   Clearance
                                                      Trees                        x                        x      x                                                                         x                                                     4
                                                      Avian                        x                               x      x       x                                                          x                                                     5
                                                      Encroachment                 x                        x      x      x                                                                  x                                                     5
                                                      Line Sag                     x                               x                                                                         x                                                     3
                                                     Galloping
                                                                                   x                                                                                                         x                                                     2
                                                      conductors

                                                   Security
                                                     Tampering (in
                                                                                   x                                      x       x                                                          x                                                     4
                                                      process)
                                                      Tampering (result of)        x                        x                                     x                                                                                                3

                                                                  COUNT           11          4      2      3      4      6       2       1      2       2      2       3      1       1     6         2        2       2       2         2
Candidate Technology for the Instrumented Tower


3.1.1  Optical Image Sensing
Optical imaging includes methods in which an image provided by a camera is interpreted by computer
analysis to identify or detect specific conditions. Different camera systems can provide image repre‑
sentations in visible, infrared or ultraviolet spectral bands and each of these bands has advantages for
detecting different conditions or defects. There are also a variety of methods for positioning or deploying
imaging cameras with some choices more suitable for detecting certain types of defects. Optical imaging
is the automated analog of current visual inspection methods and has potential application for a high
percentage of the transmission line components to be inspected.

Image Analysis
Computer analysis of images to detect specific conditions or abnormalities is widely used in manufacturing
and other well-structured areas where images are obtained with consistent lighting, viewpoint, magnification
and other factors. Analysis of outdoor images with wide variations in illumination is more complex but
adaptive methods are available to compensate for changing conditions of sun and shadow. Statistical
methods are used to normalize image intensity and minimize the effects of slowly changing artifacts such
as shadows and glare spots.

Computer analysis typically consists of several steps:

    1. Image capture using monochrome, color, infrared or ultraviolet cameras. The image is
       converted to a digital representation either internally in a digital camera or by a frame
       grabber if an analog camera is used.
    2. A filtering step is usually included to remove image noise, normalize illumination or
       enhance image contrast.
    3. The image is segmented to identify regions that correspond to physical object such as
       trees, towers, insulators or conductors. Segmentation algorithms may be based on finding
       edges, corners or other shapes. Segmentation may also be based on color differences or
       difference in image texture or other patterns.
    4. Each object identified in the segmented image is characterized by describing a set of
       features. These feature sets include measurements of intensity, area, perimeter, shape,
       color and connections to other objects.
    5. Feature sets are matched against a database to identify specific types of objects. For
       example a large green object with a generally round shape would be classified as a tree
       or bush while a long thin object with no connection to other objects could be classified
       as a conductor between towers.
    6. Finally, analysis of each object is done by comparing specific characteristics of the
       observed object with conditions specified in the database. In the case of a tree or bush,
       the comparison might be related to the position in the right-of-way while in the case of
       a conductor; the condition might be the amount of mid-span sag or the absence of a
       marker ball.
    7. If certain conditions are met or not met, the computer system would signal to an operator
       for corrective action.

The condition of transmission lines changes really slowly and there is a relatively low level of activity on
and around a line. This may make the processing of images more feasible. However many of the condi‑
tions that are being inspected for are hidden from clear view or require multiple lines of sight making
it difficult. With this in mind, three primary approaches to camera deployment and image processing
are discussed below.


                                   Future Inspection of Overhead Transmission Lines                      3-
Candidate Technology for the Instrumented Tower


 Fixed Cameras- Image analysis is simplified when cameras are mounted at fixed locations with
 fixed orientations. This facilitates storing a reference image for comparison with the current image to
 determine if anything has changed. For example, a camera mounted on a tower could capture images
 showing the right-of-way under the conductors and compare with a reference image. If image analysis
 detects any new object in the current image, this would be interpreted as encroachment in the right-
 of-way. A similar approach could be taken to evaluate component degradation.

 Pan/Tilt Mounts with Zoom Lenses- The fixed camera approach simplifies image analysis but
 would require more cameras than a method that utilizes cameras with azimuth and elevation (pan and tilt)
 control and possibly a zoom lens. Such a camera, mounted on a tower, could be controlled to execute a
 repeated observation of a transmission line span using a raster scan with the zoom lens increasing image
 magnification for more distant views. As illustrated in the figure below, a mosaic of 50 to 100 images
 will provide good detail of the right-of-way between towers, conductors in the span and the hardware
 of adjacent towers. Image analysis software would have to include inputs of the elevation and azimuth
 positions to determine the location of the image frame. This would be used to access a data base listing
 the types of objects expected in each frame for comparison with the objects found in the current image. A
 complete visual tour of spans forward and backward from the camera could be done in 10 to 20 minutes
 so inspection strategies could range from continual scans to detect possible vandalism or terrorist acts to
 once-a day or even less frequent scans to provide time for solar cell battery charging.


      Figure 3‑1
      Mosiac of Images from Pan/Tilt Camera Mounted

 Movable Cameras- Additional flexibility can be introduced by mounting the camera, with pan/
 tilt/zoom positioning, on a platform that can move along the transmission line span. The figure below
 illustrates the concept of a camera mounted on a robot that can move along a static wire to traverse
 multiple spans of a transmission line. In this case image analysis and comparison would include GPS
 coordinates of the robot location as well as of the elevation and azimuth orientations to determine
 the location of the image frame. The inspection strategy would most likely involve moving the robot to
 specified GPS coordinates and then capturing a sequence of images at predetermined elevation, azimuth
 and zoom settings. Objects identified in each frame would be compared to objects in a database for
 all frames of view along the transmission line. The imaging system could perform a complete video tour
 and analysis from one location in 10 to 20 minutes and the robot would then move to the next inspec‑
 tion location, possibly 400 to 600 yards along the span. If power requirements can be met, this should
 result in inspection of 2 to 5 miles of line per day.

 Another approach would be to install a camera on a Unmanned Aerial Vehicle (UAV). This would have
 the advantage of a faster inspection time and ability to be deployed in storm response situations.


3-        Future Inspection of Overhead Transmission Lines
Candidate Technology for the Instrumented Tower


    Figure 3‑2
    Camera Mounted on Static Wire Robot

Cameras
Mass production of components for consumer digital cameras has resulted in improved performance
and reduced cost for cameras intended for automated computer image analysis. A large number of
monochrome and color cameras with resolutions ranging from 640 x 480 pixels to 2K x 2K pixels are
available and image resolutions are expected to increase in the coming years. Signal interfaces range
from the conventional RS-170 analog signals to standard digital interfaces including USB, IEEE 1394
(Firewire), CameraLink and GigabitEthernet as well as wireless modes. In the future we cans expect to
see fewer analog cameras and more high-speed digital transmission, especially wireless. Many cam‑
eras include electronic shutter control allowing extended exposure times for low light operation. Black
and white cameras are more sensitive than color cameras. Sensitivity and SNR are primarily functions
of the CCD imaging arrays and significant improvements are not expected in the near future.

    Summary of Cameras and Image Processing
 Commercial               Color and monochrome cameras are being applied in many outdoor
 technology options       surveillance applications. Very little software specifically developed for
                          automated transmission line inspection is available but the building blocks
                          for developing such applications exist.
 Expected                 Cameras and image processing computers will become physically smaller
 improvements over        with higher resolution and greater processing capability in the future.
 the next 20 years        As computer power increases, image analysis algorithms will become
                          more capable, approaching artificial intelligence goals.
 Physical interface       Optical methods are non-contact. Cameras can be equipped with
 requirements             telephoto lenses to increase the stand-off distance though this reduces
                          the field-of-view. Zoom lenses can be used to provide large scene
                          overviews and highly magnified views of critical locations.
 Power requirements       Typical voltages are 5 VDC and 12–24 VDC. Power consumption
                          is typically 1 to 5 watts.
 Data/bandwidth           Video data rates are required between the camera and image processing
                          computer but data from the camera-computer system will be low bandwidth,
                          digital data describing a specific condition identified by image processing.
                          In addition, it would be desirable to transmit images of the condition for
                          reference or additional interpretation by an operator. Digital images would
                          be in compressed format and might range from 50 to 300 kilobytes.
 Size/weight              From 1” x 1” x 1” to 2” x 2” x 4” and weighing from a few ounces to a pound.


                                 Future Inspection of Overhead Transmission Lines                       3-
Candidate Technology for the Instrumented Tower


 Smart Cameras- Several manufacturers supply cameras with image processing computers built into
 the case. All standard image analysis routines can be programmed in these “smart cameras”, eliminating
 the need for a separate image analysis computer. In addition to standard video output, these camera
 systems include USB and wireless interfaces so the results of image analysis can be reported over a low
 bandwidth channel. They also provide the capability of transmitting compressed images at low data rates
 when it is desirable for an operator to see a scene to verify a conclusion or decide of a course of action.
 Some of these smart camera computers can accept other input signals so they could potentially provide
 all of the computational functions of a sensor node.


      Summary of Smart Cameras
  Commercial                Sony, VC Vision and others provide monochrome cameras in rugged
  technology options        housings. The Sony system is based on a 400 MHz x86 architecture
                            and is compatible with a number of image processing software packages.
                            The VC Vision system is available with either color or monochrome imager
                            and uses a 400 MHz processor from TI.
  Expected                  The variety and capability of smart cameras will increase rapidly. The
  improvements over         systems will become physically smaller with higher resolution and greater
   the next 20 years        processing capability. As computer power increases, more complex image
                            analysis algorithms and software will be included with these systems.
  Physical interface        Optical methods are non-contact. Cameras can be equipped with telephoto
  requirements              lenses to increase the stand-off distance though this reduces the field-of-view.
                            Zoom lenses can be used to provide large scene overviews and highly
                            magnified views of critical locations.
  Power requirements        Values for the Sony system are: 10.5 to 26.4 volts with 7.5 watts.
  Data/bandwidth            The camera-computer provides Ethernet, USB 1.1 and RS-232 interfaces
                            as well as digital i/o lines that could be used to control/sample other
                            sensors. Data transmitted from the system will be low bandwidth, digital
                            data describing a specific condition identified by image processing.
                            Digital images would be transmitted in compressed format and might
                            range from 50 to 300 kilobytes.
  Size/weight               The Sony camera can be considered typical for this group.
                            It is 2.3” x 2.2” x 4.5” and weighs 14 ounces.


 Applications of Optical Imaging
 Computer analysis of camera images can be used for automated detection of a wide range of defects that
 are currently found by visual observation. Encroachment on the ground or on towers can be identified by
 detecting objects in locations that should be clear. Wires and conductors can be inspected and broken
 strands that extend away from the surface of the cable can be detected. Images of insulators can be ana‑
 lyzed and the presence of contamination or physical damage (such as gunshot damage) can be detected.
 The condition or absence of phase spacers or marker balls can be determined by image analysis. Also,
 tower tampering by terrorists or vandals could be promptly identified in order to alert authorities.

 The condition of structural components can be evaluated by image analysis although this is more
 complex. Edge and line detection algorithms would be used to identify lattice objects and these would
 be compared to database entries to determine if any are missing, bent or out of position. The surface
 patterns of steel poles or lattice members would also be analyzed to detect patterns that would indicate
 rust, corrosion or other surface damage.


3-        Future Inspection of Overhead Transmission Lines
Candidate Technology for the Instrumented Tower


The effectiveness of inspecting components such as insulators and tower members will depend on the
camera position and the viewing angle. If a single camera is mounted at the top of each tower, it will not
be in a good position to see the insulators and lattice members of that tower and it will be a long distance
from the adjacent towers. A camera on a line crawling robot would have the advantage of seeing the
tower and insulators from several different positions and the robot moves toward the tower.

3.1.2  Infrared Image Sensing
Infrared cameras are sensitive to longer wavelengths than conventional color cameras. The most
useful infrared band for transmission line inspection is long-wave or thermal IR, from 8 to 14 micron
wavelength. Early thermal infrared cameras used a single detector with a scanner to build up an
image but current systems use microbolometer arrays and quantum well devices fabricated with typical
resolution of 320 x 240 pixels. Many infrared camera systems today are designed for operators
conducting thermal surveys and include image enhancement software and an LCD viewing screen.
Most are intended for use at fairly short range and long focal length lenses (made from germanium)
are expensive. Radiometric cameras are calibrated so that an accurate surface temperature can be
read from the thermal image. Non-radiometric cameras provide an indication of relative temperature
but do not give an absolute temperature.

The amount of infrared radiation from a source depends on the temperature of the surface and also
on the emissivity of the source. Very smooth or shiny surfaces emit a smaller amount of radiation than
rough or dull surfaces. Accurate temperature measurements require knowledge or assumptions of the
surface emissivity. When the surface condition is unknown it is still possible to identify hot spots by
determining temperature differences even though the absolute temperature cannot be measured.

IR cameras are often classified as cooled or uncooled. High-end thermal IR cameras often provide a
peltier or compressor system to cool the detector to reduce the effect of thermal noise. Uncooled cameras
typically are less expensive, smaller and use less power but will be less sensitive and have more image
noise . Costs for thermal infrared cameras range from $7K to $50K depending on the features, resolution,
accuracy and lenses included.

Some IR cameras, such as the OEM Photon from Indigo or the Cantronic Thermal Ranger, are intended
for integration into automated surveillance or inspection systems. Compared to handheld systems
intended for operator use, these cameras are small, compact and have low power requirements.
These would be suitable for an automated transmission line inspection station when used with custom
image analysis software.

In the transmission line inspection systems, thermal IR cameras are most often used to identify hot spots
caused by leakage current dry band arcing on insulators or failing connections, e.g. splices o dead
ends compression connectors. One alternative to a complete IR camera system is to include an infrared
thermometer, which is a single IR detector with optics to focus radiation from a small area on the detector
(essentially a 1x1 pixel camera). The IR thermometer would be mounted and bore-sighted to a conven‑
tional camera on a pan/tilt mount. Image analysis would be used to aim the thermometer at locations
in the image where elevated temperatures might indicate failing components. Slight variations in the
orientation could be used to build up a thermal image of a component. This process would be very slow
compared to an array IR camera but might be a useful low cost alternative for a camera station placed
on a tower where actual imaging will be required only a small fraction of the available time.

Applications of Infrared Imaging
Infrared imaging can be used to detect heat generated by insulator leakage currents or failing
components such as a conductor splice. With appropriate image analysis, it could be used for
automated detection of failing insulators or damaged conductors.


                                   Future Inspection of Overhead Transmission Lines                      3-
Candidate Technology for the Instrumented Tower


      Summary of Infrared Imaging
  Commercial                Systems suitable for outdoor use and transmission line inspection
  technology options        by an operator are available from several manufacturers. Most are
                            battery powered and include image processing functions to enhance and
                            measure temperature differences. IR imagers (without specialized image
                            processing functions) are also available. Additional image analysis
                            would be required for automated identification of thermal hot spots
                            indicating a problem.
  Expected                  The image resolution of IR cameras will increase as nanotechnology
  improvements over         techniques are applied to microbolometer arrays. IR cameras will be
  the next 20 years         produced in greater variety and greater volume due to use in the surveil‑
                            lance and security areas. The increased volume will result in lower unit
                            prices. “Smart IR cameras”, including a programmable image processing
                            computer will be available. Digital interfaces, including USB, Firewire
                            Ethernet and wireless will be included.
  Physical interface        As an optical method, thermal IR imaging is non-contact. Stand-off
  requirements              distances can range from several feet to several hundred feet if telephoto
                            lenses are used.
  Power requirements        Typically 7–15 VDC
                            2–15 watts for uncooled cameras
  Data/bandwidth            The camera video interface is typically NTSC or PAL. After image analysis,
                            data transmitted from the system will be low bandwidth, digital data
                            describing specific conditions identified by image processing. Digital
                            images would be transmitted in compressed format and might range
                            from 50 to 300 kilobytes.
  Size/weight               Dimensions from 2” x 2” x 4” (excluding lens) to 4” x 5” x 9”
                            Weight from .5 lbs to 4 lbs depending on features and lens.


 3.1.3  Ultraviolet Image Sensing
 CCD imaging arrays can be optimized for detection of ultraviolet light by making the silicon substrate
 very thin and directing the incident radiation onto the back surface. This overcomes the performance limits
 of the conventional front-illuminated CCDs by illuminating and collecting charge through the back surface
 away from the polysilicon electrodes. Ultraviolet cameras, sensitive to wavelengths shorter than the visible
 spectrum are widely used in astronomy and for inspection of silicon wafers. Many manufacturers of CCD
 arrays and video cameras offer “UV enhanced” versions for QA or process inspection.

 The primary use of UV cameras in transmission line inspection is to locate corona sources. One of
 the difficulties of detecting corona on transmission lines is that the large UV content of solar radiation
 is much greater than typical transmission line corona sources. In order to detect corona discharge
 outdoors in the daytime, it is necessary to filter the light to use only a narrow band of the UV spectrum
 (250–280 nanometers) where solar UV is absorbed by the atmosphere. Cameras using this technique
 are termed “solar-blind”.

 Several manufacturers, including Ofil and CoroCam, supply UV cameras for use in transmission
 line inspection. These are typically intended to be hand-held or mounted on a tripod. The operator
 will direct the camera at a potential source of corona and observe an LCD screen to determine if a UV
 source is present. The cameras include controls for adjusting the sensitivity and software for measuring
 the intensity of corona discharge by counting photon events.


3-        Future Inspection of Overhead Transmission Lines
 Future Inspection of Overhead Transmission Lines
 Future Inspection of Overhead Transmission Lines
 Future Inspection of Overhead Transmission Lines
 Future Inspection of Overhead Transmission Lines
 Future Inspection of Overhead Transmission Lines
 Future Inspection of Overhead Transmission Lines
 Future Inspection of Overhead Transmission Lines
 Future Inspection of Overhead Transmission Lines
 Future Inspection of Overhead Transmission Lines
 Future Inspection of Overhead Transmission Lines
 Future Inspection of Overhead Transmission Lines
 Future Inspection of Overhead Transmission Lines
 Future Inspection of Overhead Transmission Lines
 Future Inspection of Overhead Transmission Lines
 Future Inspection of Overhead Transmission Lines
 Future Inspection of Overhead Transmission Lines
 Future Inspection of Overhead Transmission Lines
 Future Inspection of Overhead Transmission Lines
 Future Inspection of Overhead Transmission Lines
 Future Inspection of Overhead Transmission Lines
 Future Inspection of Overhead Transmission Lines
 Future Inspection of Overhead Transmission Lines
 Future Inspection of Overhead Transmission Lines
 Future Inspection of Overhead Transmission Lines
 Future Inspection of Overhead Transmission Lines
 Future Inspection of Overhead Transmission Lines
 Future Inspection of Overhead Transmission Lines
 Future Inspection of Overhead Transmission Lines
 Future Inspection of Overhead Transmission Lines
 Future Inspection of Overhead Transmission Lines
 Future Inspection of Overhead Transmission Lines
 Future Inspection of Overhead Transmission Lines
 Future Inspection of Overhead Transmission Lines
 Future Inspection of Overhead Transmission Lines
 Future Inspection of Overhead Transmission Lines
 Future Inspection of Overhead Transmission Lines
 Future Inspection of Overhead Transmission Lines
 Future Inspection of Overhead Transmission Lines
 Future Inspection of Overhead Transmission Lines
 Future Inspection of Overhead Transmission Lines
 Future Inspection of Overhead Transmission Lines
 Future Inspection of Overhead Transmission Lines
 Future Inspection of Overhead Transmission Lines
 Future Inspection of Overhead Transmission Lines
 Future Inspection of Overhead Transmission Lines
 Future Inspection of Overhead Transmission Lines
 Future Inspection of Overhead Transmission Lines
 Future Inspection of Overhead Transmission Lines

Mais conteúdo relacionado

Mais procurados

Mais procurados (20)

testing formats
testing formatstesting formats
testing formats
 
Design of substation (with Transformer Design)
Design of substation (with Transformer Design) Design of substation (with Transformer Design)
Design of substation (with Transformer Design)
 
Power line LiDAR Mapping projects
Power line LiDAR Mapping projectsPower line LiDAR Mapping projects
Power line LiDAR Mapping projects
 
Sample calculation-for-differential-relays
Sample calculation-for-differential-relaysSample calculation-for-differential-relays
Sample calculation-for-differential-relays
 
transmission line
transmission line transmission line
transmission line
 
Under ground cables presention
Under ground cables presentionUnder ground cables presention
Under ground cables presention
 
Power cables
Power cablesPower cables
Power cables
 
Power Line Carrier Communication
Power Line Carrier CommunicationPower Line Carrier Communication
Power Line Carrier Communication
 
BUSBAR PROTECTION
BUSBAR PROTECTIONBUSBAR PROTECTION
BUSBAR PROTECTION
 
Dog Conductor
Dog ConductorDog Conductor
Dog Conductor
 
Classification of transmission lines
Classification of transmission linesClassification of transmission lines
Classification of transmission lines
 
Insulation coordination.
Insulation coordination.Insulation coordination.
Insulation coordination.
 
Substation presentation by ram
Substation presentation by ramSubstation presentation by ram
Substation presentation by ram
 
Underground cables
Underground cablesUnderground cables
Underground cables
 
OPGW Optical Ground Wire
OPGW Optical Ground WireOPGW Optical Ground Wire
OPGW Optical Ground Wire
 
Low voltage cables
Low voltage cablesLow voltage cables
Low voltage cables
 
Electrical System Design
Electrical System Design Electrical System Design
Electrical System Design
 
Overhead line work ppt
Overhead line work pptOverhead line work ppt
Overhead line work ppt
 
Testing,maintenance&protection
Testing,maintenance&protectionTesting,maintenance&protection
Testing,maintenance&protection
 
Procedure cable testing
Procedure cable testingProcedure cable testing
Procedure cable testing
 

Destaque

Power transmission(ppt)
Power transmission(ppt)Power transmission(ppt)
Power transmission(ppt)zeeshan715
 
Construction EHV Transmission Line
Construction EHV Transmission LineConstruction EHV Transmission Line
Construction EHV Transmission LineSURESH GOPAL
 
Electrical transmission line
Electrical transmission lineElectrical transmission line
Electrical transmission lineDhananjay Jha
 
Mt 141-dura wrap-repairs-power-plant-cooling-tower-supply-line
Mt 141-dura wrap-repairs-power-plant-cooling-tower-supply-lineMt 141-dura wrap-repairs-power-plant-cooling-tower-supply-line
Mt 141-dura wrap-repairs-power-plant-cooling-tower-supply-lineAndreas Kyriakides
 
포스텍 석/박사 학위논문(2012.8)
포스텍 석/박사 학위논문(2012.8)포스텍 석/박사 학위논문(2012.8)
포스텍 석/박사 학위논문(2012.8)POSTECH Library
 
매설배관 건전성평가
매설배관 건전성평가매설배관 건전성평가
매설배관 건전성평가Li SeonYeob
 
4pp 실험 발표자료
4pp 실험 발표자료4pp 실험 발표자료
4pp 실험 발표자료boonga
 
[IoT] MAKE with Open H/W + Node.JS - 4th
[IoT] MAKE with Open H/W + Node.JS - 4th[IoT] MAKE with Open H/W + Node.JS - 4th
[IoT] MAKE with Open H/W + Node.JS - 4thPark Jonggun
 
Robotic cable inspection system
Robotic cable inspection system Robotic cable inspection system
Robotic cable inspection system Mahesh Thiruveedula
 
논문 프로포절 발표_20130524
논문 프로포절 발표_20130524논문 프로포절 발표_20130524
논문 프로포절 발표_20130524승윤 차
 
AMCO Electrical and Engineering Co, Kolkata
AMCO Electrical and Engineering Co, Kolkata AMCO Electrical and Engineering Co, Kolkata
AMCO Electrical and Engineering Co, Kolkata amcoelectricals
 
Robotic monitoring of powersystems by sriharsha
Robotic monitoring of powersystems by sriharshaRobotic monitoring of powersystems by sriharsha
Robotic monitoring of powersystems by sriharshaSri Harsha
 
GIS tools for transmission line routing
GIS tools for transmission line routingGIS tools for transmission line routing
GIS tools for transmission line routingdlbelin
 
Surge impedance sil
Surge impedance silSurge impedance sil
Surge impedance silh-nouri
 

Destaque (20)

Problems in overhead transmission line
Problems in overhead transmission lineProblems in overhead transmission line
Problems in overhead transmission line
 
Power transmission(ppt)
Power transmission(ppt)Power transmission(ppt)
Power transmission(ppt)
 
Construction EHV Transmission Line
Construction EHV Transmission LineConstruction EHV Transmission Line
Construction EHV Transmission Line
 
Electrical transmission line
Electrical transmission lineElectrical transmission line
Electrical transmission line
 
Mt 141-dura wrap-repairs-power-plant-cooling-tower-supply-line
Mt 141-dura wrap-repairs-power-plant-cooling-tower-supply-lineMt 141-dura wrap-repairs-power-plant-cooling-tower-supply-line
Mt 141-dura wrap-repairs-power-plant-cooling-tower-supply-line
 
포스텍 석/박사 학위논문(2012.8)
포스텍 석/박사 학위논문(2012.8)포스텍 석/박사 학위논문(2012.8)
포스텍 석/박사 학위논문(2012.8)
 
My training ppt
My training pptMy training ppt
My training ppt
 
매설배관 건전성평가
매설배관 건전성평가매설배관 건전성평가
매설배관 건전성평가
 
Distribution system 2
Distribution system  2Distribution system  2
Distribution system 2
 
4pp 실험 발표자료
4pp 실험 발표자료4pp 실험 발표자료
4pp 실험 발표자료
 
[IoT] MAKE with Open H/W + Node.JS - 4th
[IoT] MAKE with Open H/W + Node.JS - 4th[IoT] MAKE with Open H/W + Node.JS - 4th
[IoT] MAKE with Open H/W + Node.JS - 4th
 
Robotic cable inspection system
Robotic cable inspection system Robotic cable inspection system
Robotic cable inspection system
 
논문 프로포절 발표_20130524
논문 프로포절 발표_20130524논문 프로포절 발표_20130524
논문 프로포절 발표_20130524
 
CV imran-Asghar
CV imran-AsgharCV imran-Asghar
CV imran-Asghar
 
AMCO Electrical and Engineering Co, Kolkata
AMCO Electrical and Engineering Co, Kolkata AMCO Electrical and Engineering Co, Kolkata
AMCO Electrical and Engineering Co, Kolkata
 
Power Plant maintenance by ROBOT
Power Plant maintenance by ROBOTPower Plant maintenance by ROBOT
Power Plant maintenance by ROBOT
 
Power in visayas
Power in visayasPower in visayas
Power in visayas
 
Robotic monitoring of powersystems by sriharsha
Robotic monitoring of powersystems by sriharshaRobotic monitoring of powersystems by sriharsha
Robotic monitoring of powersystems by sriharsha
 
GIS tools for transmission line routing
GIS tools for transmission line routingGIS tools for transmission line routing
GIS tools for transmission line routing
 
Surge impedance sil
Surge impedance silSurge impedance sil
Surge impedance sil
 

Semelhante a Future Inspection of Overhead Transmission Lines

NEETRAC (Chapter 2: MV Cable System Issues)
NEETRAC (Chapter 2: MV Cable System Issues)NEETRAC (Chapter 2: MV Cable System Issues)
NEETRAC (Chapter 2: MV Cable System Issues)AHMED MOHAMED HEGAB
 
Using Synchrophasor Data for Phase Angle Monitoring
Using Synchrophasor Data for Phase Angle MonitoringUsing Synchrophasor Data for Phase Angle Monitoring
Using Synchrophasor Data for Phase Angle MonitoringPower System Operation
 
final report (parking project).pdf
final report (parking project).pdffinal report (parking project).pdf
final report (parking project).pdfgamefacegamer
 
Multi-Band Rejection EMI Shielding
Multi-Band Rejection EMI ShieldingMulti-Band Rejection EMI Shielding
Multi-Band Rejection EMI ShieldingSourav Rakshit
 
Innovative Payloads for Small Unmanned Aerial System-Based Person
Innovative Payloads for Small Unmanned Aerial System-Based PersonInnovative Payloads for Small Unmanned Aerial System-Based Person
Innovative Payloads for Small Unmanned Aerial System-Based PersonAustin Jensen
 
Smart Traffic Management System using Internet of Things (IoT)-btech-cse-04-0...
Smart Traffic Management System using Internet of Things (IoT)-btech-cse-04-0...Smart Traffic Management System using Internet of Things (IoT)-btech-cse-04-0...
Smart Traffic Management System using Internet of Things (IoT)-btech-cse-04-0...TanuAgrawal27
 
Csi thermal handbook
Csi thermal handbookCsi thermal handbook
Csi thermal handbookSunworks
 
Smart Street System
Smart Street SystemSmart Street System
Smart Street SystemLibin Thomas
 
Realtimesamplingofutilization
RealtimesamplingofutilizationRealtimesamplingofutilization
RealtimesamplingofutilizationVicente Nava
 
Project Report Distance measurement system
Project Report Distance measurement systemProject Report Distance measurement system
Project Report Distance measurement systemkurkute1994
 
Tesi ph d_andrea_barucci_small
Tesi ph d_andrea_barucci_smallTesi ph d_andrea_barucci_small
Tesi ph d_andrea_barucci_smallAndrea Barucci
 
LTE_from_Theory_to_Practise.pdf
LTE_from_Theory_to_Practise.pdfLTE_from_Theory_to_Practise.pdf
LTE_from_Theory_to_Practise.pdfATEC3
 
Bx310x Product Specification
Bx310x Product SpecificationBx310x Product Specification
Bx310x Product SpecificationFrederic Petit
 
2016XXXX_Sensor_system_WEB
2016XXXX_Sensor_system_WEB2016XXXX_Sensor_system_WEB
2016XXXX_Sensor_system_WEBShan Guan
 
Power Supply Equipment Market for Water Electrolysis.pdf
Power Supply Equipment Market for Water Electrolysis.pdfPower Supply Equipment Market for Water Electrolysis.pdf
Power Supply Equipment Market for Water Electrolysis.pdfMohit BISResearch
 
Mobile phone intelligent jamming system
Mobile phone intelligent jamming systemMobile phone intelligent jamming system
Mobile phone intelligent jamming systemPatel Ibrahim
 
Ansi c37-61-1973-ieee-std-321-1973-pdf
Ansi c37-61-1973-ieee-std-321-1973-pdfAnsi c37-61-1973-ieee-std-321-1973-pdf
Ansi c37-61-1973-ieee-std-321-1973-pdfNoel Ramos
 
Supercoducting Cables in Grid
Supercoducting Cables in GridSupercoducting Cables in Grid
Supercoducting Cables in Gridprajesh88
 
Project report on Eye tracking interpretation system
Project report on Eye tracking interpretation systemProject report on Eye tracking interpretation system
Project report on Eye tracking interpretation systemkurkute1994
 

Semelhante a Future Inspection of Overhead Transmission Lines (20)

NEETRAC (Chapter 2: MV Cable System Issues)
NEETRAC (Chapter 2: MV Cable System Issues)NEETRAC (Chapter 2: MV Cable System Issues)
NEETRAC (Chapter 2: MV Cable System Issues)
 
Using Synchrophasor Data for Phase Angle Monitoring
Using Synchrophasor Data for Phase Angle MonitoringUsing Synchrophasor Data for Phase Angle Monitoring
Using Synchrophasor Data for Phase Angle Monitoring
 
final report (parking project).pdf
final report (parking project).pdffinal report (parking project).pdf
final report (parking project).pdf
 
Multi-Band Rejection EMI Shielding
Multi-Band Rejection EMI ShieldingMulti-Band Rejection EMI Shielding
Multi-Band Rejection EMI Shielding
 
Innovative Payloads for Small Unmanned Aerial System-Based Person
Innovative Payloads for Small Unmanned Aerial System-Based PersonInnovative Payloads for Small Unmanned Aerial System-Based Person
Innovative Payloads for Small Unmanned Aerial System-Based Person
 
Smart Traffic Management System using Internet of Things (IoT)-btech-cse-04-0...
Smart Traffic Management System using Internet of Things (IoT)-btech-cse-04-0...Smart Traffic Management System using Internet of Things (IoT)-btech-cse-04-0...
Smart Traffic Management System using Internet of Things (IoT)-btech-cse-04-0...
 
Csi thermal handbook
Csi thermal handbookCsi thermal handbook
Csi thermal handbook
 
Smart Street System
Smart Street SystemSmart Street System
Smart Street System
 
Realtimesamplingofutilization
RealtimesamplingofutilizationRealtimesamplingofutilization
Realtimesamplingofutilization
 
Project Report Distance measurement system
Project Report Distance measurement systemProject Report Distance measurement system
Project Report Distance measurement system
 
Tesi ph d_andrea_barucci_small
Tesi ph d_andrea_barucci_smallTesi ph d_andrea_barucci_small
Tesi ph d_andrea_barucci_small
 
LTE_from_Theory_to_Practise.pdf
LTE_from_Theory_to_Practise.pdfLTE_from_Theory_to_Practise.pdf
LTE_from_Theory_to_Practise.pdf
 
report
reportreport
report
 
Bx310x Product Specification
Bx310x Product SpecificationBx310x Product Specification
Bx310x Product Specification
 
2016XXXX_Sensor_system_WEB
2016XXXX_Sensor_system_WEB2016XXXX_Sensor_system_WEB
2016XXXX_Sensor_system_WEB
 
Power Supply Equipment Market for Water Electrolysis.pdf
Power Supply Equipment Market for Water Electrolysis.pdfPower Supply Equipment Market for Water Electrolysis.pdf
Power Supply Equipment Market for Water Electrolysis.pdf
 
Mobile phone intelligent jamming system
Mobile phone intelligent jamming systemMobile phone intelligent jamming system
Mobile phone intelligent jamming system
 
Ansi c37-61-1973-ieee-std-321-1973-pdf
Ansi c37-61-1973-ieee-std-321-1973-pdfAnsi c37-61-1973-ieee-std-321-1973-pdf
Ansi c37-61-1973-ieee-std-321-1973-pdf
 
Supercoducting Cables in Grid
Supercoducting Cables in GridSupercoducting Cables in Grid
Supercoducting Cables in Grid
 
Project report on Eye tracking interpretation system
Project report on Eye tracking interpretation systemProject report on Eye tracking interpretation system
Project report on Eye tracking interpretation system
 

Mais de Corporación Eléctrica del Ecuador, CELEC EP

Mais de Corporación Eléctrica del Ecuador, CELEC EP (20)

ELEVATION GRADE
ELEVATION GRADEELEVATION GRADE
ELEVATION GRADE
 
SSLL-PE-2015-1S
SSLL-PE-2015-1SSSLL-PE-2015-1S
SSLL-PE-2015-1S
 
TE2-PE-2015-1S
TE2-PE-2015-1STE2-PE-2015-1S
TE2-PE-2015-1S
 
TE1-PE-2015-1S
TE1-PE-2015-1STE1-PE-2015-1S
TE1-PE-2015-1S
 
PROBLEMA ESPECIAL TE2.pdf
PROBLEMA ESPECIAL TE2.pdfPROBLEMA ESPECIAL TE2.pdf
PROBLEMA ESPECIAL TE2.pdf
 
TE2-TE-2014-2S
TE2-TE-2014-2STE2-TE-2014-2S
TE2-TE-2014-2S
 
TE1-TE-2014-2S
TE1-TE-2014-2STE1-TE-2014-2S
TE1-TE-2014-2S
 
SSLL-TE--2014-2S
SSLL-TE--2014-2SSSLL-TE--2014-2S
SSLL-TE--2014-2S
 
TE2-SE-2014-2S
TE2-SE-2014-2STE2-SE-2014-2S
TE2-SE-2014-2S
 
La Tecnología Transformadora de los Vehículos Eléctricos
La Tecnología Transformadora de los Vehículos EléctricosLa Tecnología Transformadora de los Vehículos Eléctricos
La Tecnología Transformadora de los Vehículos Eléctricos
 
TE1-SE-2014-2S
TE1-SE-2014-2STE1-SE-2014-2S
TE1-SE-2014-2S
 
SSLL-SE-2014-2S
SSLL-SE-2014-2SSSLL-SE-2014-2S
SSLL-SE-2014-2S
 
SOLUCIÓN TE2-PE-2014-2S
SOLUCIÓN TE2-PE-2014-2SSOLUCIÓN TE2-PE-2014-2S
SOLUCIÓN TE2-PE-2014-2S
 
SSLL-PE-2014-2S
SSLL-PE-2014-2SSSLL-PE-2014-2S
SSLL-PE-2014-2S
 
TE2-PE-2014-2S
TE2-PE-2014-2STE2-PE-2014-2S
TE2-PE-2014-2S
 
TE1-PE-2014-2S
TE1-PE-2014-2STE1-PE-2014-2S
TE1-PE-2014-2S
 
Contabilidad Administrativa UQAM
Contabilidad Administrativa UQAMContabilidad Administrativa UQAM
Contabilidad Administrativa UQAM
 
Enseñar a Aprender
Enseñar a AprenderEnseñar a Aprender
Enseñar a Aprender
 
3D Smith Chart
3D Smith Chart3D Smith Chart
3D Smith Chart
 
SSLL-TE-2014-1S
SSLL-TE-2014-1SSSLL-TE-2014-1S
SSLL-TE-2014-1S
 

Último

Exploring the Future Potential of AI-Enabled Smartphone Processors
Exploring the Future Potential of AI-Enabled Smartphone ProcessorsExploring the Future Potential of AI-Enabled Smartphone Processors
Exploring the Future Potential of AI-Enabled Smartphone Processorsdebabhi2
 
A Domino Admins Adventures (Engage 2024)
A Domino Admins Adventures (Engage 2024)A Domino Admins Adventures (Engage 2024)
A Domino Admins Adventures (Engage 2024)Gabriella Davis
 
The Role of Taxonomy and Ontology in Semantic Layers - Heather Hedden.pdf
The Role of Taxonomy and Ontology in Semantic Layers - Heather Hedden.pdfThe Role of Taxonomy and Ontology in Semantic Layers - Heather Hedden.pdf
The Role of Taxonomy and Ontology in Semantic Layers - Heather Hedden.pdfEnterprise Knowledge
 
08448380779 Call Girls In Friends Colony Women Seeking Men
08448380779 Call Girls In Friends Colony Women Seeking Men08448380779 Call Girls In Friends Colony Women Seeking Men
08448380779 Call Girls In Friends Colony Women Seeking MenDelhi Call girls
 
How to convert PDF to text with Nanonets
How to convert PDF to text with NanonetsHow to convert PDF to text with Nanonets
How to convert PDF to text with Nanonetsnaman860154
 
2024: Domino Containers - The Next Step. News from the Domino Container commu...
2024: Domino Containers - The Next Step. News from the Domino Container commu...2024: Domino Containers - The Next Step. News from the Domino Container commu...
2024: Domino Containers - The Next Step. News from the Domino Container commu...Martijn de Jong
 
How to Troubleshoot Apps for the Modern Connected Worker
How to Troubleshoot Apps for the Modern Connected WorkerHow to Troubleshoot Apps for the Modern Connected Worker
How to Troubleshoot Apps for the Modern Connected WorkerThousandEyes
 
Scaling API-first – The story of a global engineering organization
Scaling API-first – The story of a global engineering organizationScaling API-first – The story of a global engineering organization
Scaling API-first – The story of a global engineering organizationRadu Cotescu
 
[2024]Digital Global Overview Report 2024 Meltwater.pdf
[2024]Digital Global Overview Report 2024 Meltwater.pdf[2024]Digital Global Overview Report 2024 Meltwater.pdf
[2024]Digital Global Overview Report 2024 Meltwater.pdfhans926745
 
Injustice - Developers Among Us (SciFiDevCon 2024)
Injustice - Developers Among Us (SciFiDevCon 2024)Injustice - Developers Among Us (SciFiDevCon 2024)
Injustice - Developers Among Us (SciFiDevCon 2024)Allon Mureinik
 
EIS-Webinar-Prompt-Knowledge-Eng-2024-04-08.pptx
EIS-Webinar-Prompt-Knowledge-Eng-2024-04-08.pptxEIS-Webinar-Prompt-Knowledge-Eng-2024-04-08.pptx
EIS-Webinar-Prompt-Knowledge-Eng-2024-04-08.pptxEarley Information Science
 
04-2024-HHUG-Sales-and-Marketing-Alignment.pptx
04-2024-HHUG-Sales-and-Marketing-Alignment.pptx04-2024-HHUG-Sales-and-Marketing-Alignment.pptx
04-2024-HHUG-Sales-and-Marketing-Alignment.pptxHampshireHUG
 
Mastering MySQL Database Architecture: Deep Dive into MySQL Shell and MySQL R...
Mastering MySQL Database Architecture: Deep Dive into MySQL Shell and MySQL R...Mastering MySQL Database Architecture: Deep Dive into MySQL Shell and MySQL R...
Mastering MySQL Database Architecture: Deep Dive into MySQL Shell and MySQL R...Miguel Araújo
 
Presentation on how to chat with PDF using ChatGPT code interpreter
Presentation on how to chat with PDF using ChatGPT code interpreterPresentation on how to chat with PDF using ChatGPT code interpreter
Presentation on how to chat with PDF using ChatGPT code interpreternaman860154
 
Automating Google Workspace (GWS) & more with Apps Script
Automating Google Workspace (GWS) & more with Apps ScriptAutomating Google Workspace (GWS) & more with Apps Script
Automating Google Workspace (GWS) & more with Apps Scriptwesley chun
 
Boost PC performance: How more available memory can improve productivity
Boost PC performance: How more available memory can improve productivityBoost PC performance: How more available memory can improve productivity
Boost PC performance: How more available memory can improve productivityPrincipled Technologies
 
Unblocking The Main Thread Solving ANRs and Frozen Frames
Unblocking The Main Thread Solving ANRs and Frozen FramesUnblocking The Main Thread Solving ANRs and Frozen Frames
Unblocking The Main Thread Solving ANRs and Frozen FramesSinan KOZAK
 
The 7 Things I Know About Cyber Security After 25 Years | April 2024
The 7 Things I Know About Cyber Security After 25 Years | April 2024The 7 Things I Know About Cyber Security After 25 Years | April 2024
The 7 Things I Know About Cyber Security After 25 Years | April 2024Rafal Los
 
Apidays Singapore 2024 - Building Digital Trust in a Digital Economy by Veron...
Apidays Singapore 2024 - Building Digital Trust in a Digital Economy by Veron...Apidays Singapore 2024 - Building Digital Trust in a Digital Economy by Veron...
Apidays Singapore 2024 - Building Digital Trust in a Digital Economy by Veron...apidays
 
Breaking the Kubernetes Kill Chain: Host Path Mount
Breaking the Kubernetes Kill Chain: Host Path MountBreaking the Kubernetes Kill Chain: Host Path Mount
Breaking the Kubernetes Kill Chain: Host Path MountPuma Security, LLC
 

Último (20)

Exploring the Future Potential of AI-Enabled Smartphone Processors
Exploring the Future Potential of AI-Enabled Smartphone ProcessorsExploring the Future Potential of AI-Enabled Smartphone Processors
Exploring the Future Potential of AI-Enabled Smartphone Processors
 
A Domino Admins Adventures (Engage 2024)
A Domino Admins Adventures (Engage 2024)A Domino Admins Adventures (Engage 2024)
A Domino Admins Adventures (Engage 2024)
 
The Role of Taxonomy and Ontology in Semantic Layers - Heather Hedden.pdf
The Role of Taxonomy and Ontology in Semantic Layers - Heather Hedden.pdfThe Role of Taxonomy and Ontology in Semantic Layers - Heather Hedden.pdf
The Role of Taxonomy and Ontology in Semantic Layers - Heather Hedden.pdf
 
08448380779 Call Girls In Friends Colony Women Seeking Men
08448380779 Call Girls In Friends Colony Women Seeking Men08448380779 Call Girls In Friends Colony Women Seeking Men
08448380779 Call Girls In Friends Colony Women Seeking Men
 
How to convert PDF to text with Nanonets
How to convert PDF to text with NanonetsHow to convert PDF to text with Nanonets
How to convert PDF to text with Nanonets
 
2024: Domino Containers - The Next Step. News from the Domino Container commu...
2024: Domino Containers - The Next Step. News from the Domino Container commu...2024: Domino Containers - The Next Step. News from the Domino Container commu...
2024: Domino Containers - The Next Step. News from the Domino Container commu...
 
How to Troubleshoot Apps for the Modern Connected Worker
How to Troubleshoot Apps for the Modern Connected WorkerHow to Troubleshoot Apps for the Modern Connected Worker
How to Troubleshoot Apps for the Modern Connected Worker
 
Scaling API-first – The story of a global engineering organization
Scaling API-first – The story of a global engineering organizationScaling API-first – The story of a global engineering organization
Scaling API-first – The story of a global engineering organization
 
[2024]Digital Global Overview Report 2024 Meltwater.pdf
[2024]Digital Global Overview Report 2024 Meltwater.pdf[2024]Digital Global Overview Report 2024 Meltwater.pdf
[2024]Digital Global Overview Report 2024 Meltwater.pdf
 
Injustice - Developers Among Us (SciFiDevCon 2024)
Injustice - Developers Among Us (SciFiDevCon 2024)Injustice - Developers Among Us (SciFiDevCon 2024)
Injustice - Developers Among Us (SciFiDevCon 2024)
 
EIS-Webinar-Prompt-Knowledge-Eng-2024-04-08.pptx
EIS-Webinar-Prompt-Knowledge-Eng-2024-04-08.pptxEIS-Webinar-Prompt-Knowledge-Eng-2024-04-08.pptx
EIS-Webinar-Prompt-Knowledge-Eng-2024-04-08.pptx
 
04-2024-HHUG-Sales-and-Marketing-Alignment.pptx
04-2024-HHUG-Sales-and-Marketing-Alignment.pptx04-2024-HHUG-Sales-and-Marketing-Alignment.pptx
04-2024-HHUG-Sales-and-Marketing-Alignment.pptx
 
Mastering MySQL Database Architecture: Deep Dive into MySQL Shell and MySQL R...
Mastering MySQL Database Architecture: Deep Dive into MySQL Shell and MySQL R...Mastering MySQL Database Architecture: Deep Dive into MySQL Shell and MySQL R...
Mastering MySQL Database Architecture: Deep Dive into MySQL Shell and MySQL R...
 
Presentation on how to chat with PDF using ChatGPT code interpreter
Presentation on how to chat with PDF using ChatGPT code interpreterPresentation on how to chat with PDF using ChatGPT code interpreter
Presentation on how to chat with PDF using ChatGPT code interpreter
 
Automating Google Workspace (GWS) & more with Apps Script
Automating Google Workspace (GWS) & more with Apps ScriptAutomating Google Workspace (GWS) & more with Apps Script
Automating Google Workspace (GWS) & more with Apps Script
 
Boost PC performance: How more available memory can improve productivity
Boost PC performance: How more available memory can improve productivityBoost PC performance: How more available memory can improve productivity
Boost PC performance: How more available memory can improve productivity
 
Unblocking The Main Thread Solving ANRs and Frozen Frames
Unblocking The Main Thread Solving ANRs and Frozen FramesUnblocking The Main Thread Solving ANRs and Frozen Frames
Unblocking The Main Thread Solving ANRs and Frozen Frames
 
The 7 Things I Know About Cyber Security After 25 Years | April 2024
The 7 Things I Know About Cyber Security After 25 Years | April 2024The 7 Things I Know About Cyber Security After 25 Years | April 2024
The 7 Things I Know About Cyber Security After 25 Years | April 2024
 
Apidays Singapore 2024 - Building Digital Trust in a Digital Economy by Veron...
Apidays Singapore 2024 - Building Digital Trust in a Digital Economy by Veron...Apidays Singapore 2024 - Building Digital Trust in a Digital Economy by Veron...
Apidays Singapore 2024 - Building Digital Trust in a Digital Economy by Veron...
 
Breaking the Kubernetes Kill Chain: Host Path Mount
Breaking the Kubernetes Kill Chain: Host Path MountBreaking the Kubernetes Kill Chain: Host Path Mount
Breaking the Kubernetes Kill Chain: Host Path Mount
 

Future Inspection of Overhead Transmission Lines

  • 1. Future Inspection of Overhead Transmission Lines 1016921
  • 2.
  • 3. Future Inspection of Overhead Transmission Lines 1016921 Technical Update, May 2008 EPRI Project Manager A. Phillips
  • 4. DISCLAIMER OF WARRANTIES AND LIMITATION OF LIABILITIES THIS DOCUMENT WAS PREPARED BY THE ORGANIZATION(S) NAMED BELOW AS AN ACCOUNT OF WORK SPONSORED OR COSPONSORED BY THE ELECTRIC POWER RESEARCH INSTITUTE, INC. (EPRI). NEITHER EPRI, ANY MEMBER OF EPRI, ANY COSPONSOR, THE ORGANIZATION(S) BELOW, NOR ANY PERSON ACTING ON BEHALF OF ANY OF THEM: (A) MAKES ANY WARRANTY OR REPRESENTATION WHATSOEVER, EXPRESS OR IMPLIED, (I) WITH RESPECT TO THE USE OF ANY INFORMATION, APPARATUS, METHOD, PROCESS, OR SIMILAR ITEM DISCLOSED IN THIS DOCUMENT, INCLUDING MERCHANTABILITY AND FITNESS FOR A PARTICULAR PURPOSE, OR (II) THAT SUCH USE DOES NOT INFRINGE ON OR INTERFERE WITH PRIVATELY OWNED RIGHTS, INCLUDING ANY PARTY’S INTELLECTUAL PROPERTY, OR (III) THAT THIS DOCUMENT IS SUITABLE TO ANY PARTICULAR USER’S CIRCUM- STANCE; OR (B) ASSUMES RESPONSIBILITY FOR ANY DAMAGES OR OTHER LIABILITY WHATSOEVER (INCLUDING ANY CONSEQUENTIAL DAMAGES, EVEN IF EPRI OR ANY EPRI REPRESENTATIVE HAS BEEN ADVISED OF THE POS- SIBILITY OF SUCH DAMAGES) RESULTING FROM YOUR SELECTION OR USE OF THIS DOCUMENT OR ANY INFORMATION, APPARATUS, METHOD, PROCESS, OR SIMILAR ITEM DISCLOSED IN THIS DOCUMENT. ORGANIZATION(S) THAT PREPARED THIS DOCUMENT   Southwest Research Institute NOTE For further information about EPRI, call the EPRI Customer Assistance Center at 800.313.3774 or e-mail askepri@epri.com. Electric Power Research Institute and EPRI are registered service marks of the Electric Power Research Institute, Inc. Copyright © 2008 Electric Power Research Institute, Inc. All rights reserved.
  • 5. Citations This report was prepared by Southwest Research Institute 6220 Culebra Road San Antonio, Texas 78238 Principal Investigators   J. Major   J. Alvarez   E. Franke   G. Light   P. Allen   S. Edwards Electric Power Research Institute 1300 West WT Harris Boulevard, Charlotte, NC 28262 Principal Investigator   A. Phillips This report describes research sponsored by the Electric Power Research Institute (EPRI). This publication is a corporate document that should be cited in the literature in the following manner: Future Inspection of Overhead Transmission Lines. EPRI, Palo Alto, CA: 2008. 1016921. Future Inspection of Overhead Transmission Lines iii
  • 6.
  • 7. Product Description Results and Findings This report documents scenarios and technologies that can be applied in the future for the inspection of transmission lines. Scenarios describe the utilization of a range of concepts, including distributed sensors, unmanned airborne vehicles, RF communication, and robotics. An approach to performing demonstration projects using currently available technologies is provided and will be implemented in the following phases of the project. Challenges and Objectives Possible visions for the inspection of transmission lines in a multi-decade time frame are provided here. As the requirements for transmission line reliability and availability become more stringent and the availability of qualified personnel is reduced, technology will become a major enabler. This report documents possible technologies and scenarios that may help in meeting these challenges. Applications, Value, and Use A demonstration of some of the concepts using some of the currently available technologies will be underway in 2009. This document serves as a roadmap for the demonstration. EPRI Perspective This report provides a vision for the future of inspection and assessment of transmission lines and sets the basis for technology development and demonstrations in the future. Approach Utility staff familiar with transmission line inspection, experts in sensing and communicating technol- ogy, and transmission system researchers collaborated to develop this document. Keywords Transmission line Inspection Assessment Future Future Inspection of Overhead Transmission Lines v
  • 8.
  • 9. Acknowledgments The participation of utility representatives in the brainstorming and document development phases is acknowledged and appreciated. Without this visionary guidance the development of this document would not have been possible. A special thanks to Alan Holloman from Southern Company, John Kile from TVA and Bill Hewitt from San Diego Gas and Electric. Future Inspection of Overhead Transmission Lines vii
  • 10.
  • 11. Contents 1 BACKGROUND. . . . . . . . . . . . . . . . . . . . . . . . . . . . . . . . . . . . . . . . . . . . . . . 1-1 2 SYSTEM CONCEPT. . . . . . . . . . . . . . . . . . . . . . . . . . . . . . . . . . . . . . . . . . . . 2-1 . 2.1  System Architecture............................................................................................. 2-2 2.2  Communications Considerations........................................................................... 2-7 2.3  Power Considerations.......................................................................................... 2-9 3 CANDIDATE TECHNOLOGY FOR THE INSTRUMENTED TOWER. . . . . . . . . . . . . 3-1 3.1  Sensing Technology. ........................................................................................... 3-1 . 3.1.1  Optical Image Sensing............................................................................... 3-3 . 3.1.2  Infrared Image Sensing. ............................................................................. 3-7 . 3.1.3  Ultraviolet Image Sensing........................................................................... 3-8 . 3.1.4  Satellite Image Sensing. ............................................................................. 3-9 . 3.1.5  LIDAR....................................................................................................... 3-10 3.1.6  Vibration Sensing. ..................................................................................... 3-11 . 3.1.7  Acoustic Sensing. ...................................................................................... 3-13 . 3.1.8  Strain Sensing........................................................................................... 3-14 . 3.1.9  Tilt Sensing................................................................................................ 3-14 3.1.10  Magnetostrictive Sensing (MsS).................................................................. 3-15 3.1.11  Ultrasonic Sensing.................................................................................... 3-18 3.1.12  Electromagnetic-Acoustic Transducer (EMAT)............................................... 3-19 3.1.13  Eddy Current Sensing. .............................................................................. 3-22 . 3.1.14  Ground Penetrating Radar......................................................................... 3-24 3.1.15  Proximity Sensing..................................................................................... 3-24 3.1.16  Voltage Potential and Half Cell Measurement.............................................. 3-25 . 3.1.17  Radio Frequency Interference Sensing......................................................... 3-27 3.1.18  Leakage Current Sensing........................................................................... 3-28 3.1.19  Direct Contact Temperature Sensing. .......................................................... 3-28 . 3.1.20  Lightning Strike Sensing............................................................................ 3-29 3.2  Data Communications Technology........................................................................ 3-30 3.2.1  RF Wireless Line of Sight (LOS) Transceiver Technology.................................. 3-30 3.2.2  RF Wireless Backscatter Technology............................................................ 3-35 3.2.3  RF Wireless Over-the-Horizon Technology.................................................... 3-35 3.2.4  Infrared Technology................................................................................... 3-36 3.2.5  Fiber Optic Technology.............................................................................. 3-37 3.2.6  Free Space Optical Communication Technology........................................... 3-38 . 3.2.7  Data Communication Over Power Line......................................................... 3-39 3.2.8  Data Communications Summary.................................................................. 3-39 3.3  Mobile Collection Platforms................................................................................. 3-39 . 3.3.1  Manned Mobile Platforms. ......................................................................... 3-40 . 3.3.2  Unmanned Mobile Platforms....................................................................... 3-40 3.3.2.1  Unmanned Aerial Vehicles (UAVs)..................................................... 3-40 3.3.2.2  Balloons......................................................................................... 3-40 . 3.3.2.3  Satellites......................................................................................... 3-41 3.3.2.4  Robotic Crawler Platform.................................................................. 3-41 Future Inspection of Overhead Transmission Lines ix
  • 12. 4 Demonstration Scenario. . . . . . . . . . . . . . . . . . . . . . . . . . . . . . . . . . . . . . . . 4-1 A Appendix – Sensing Technology Summary Table . . . . . . . . . . . . . . . . . . . . . A-1 Future Inspection of Overhead Transmission Lines
  • 13. List of Figures Figure 2‑1 Illustration of Sensor Needs for Transmission Lines and Towers . ........................ 2-1 Figure 2‑2 Conceptual Sketch Showing Possible Scenarios for Inspecting Transmission Lines of the Future......................................................................................... 2-2 Figure 2‑3 Image Showing a Single Structure Illustrating Some of He Concepts. .................. 2-3 . Figure 2‑4 Sensor System Architecture and Data Flow...................................................... 2-6 Figure 2‑5 Sensor Functional Diagram............................................................................ 2-7 Figure 2‑6 Communications Hub Functional Diagram....................................................... 2-8 Figure 2‑7 Communications Networking Concept............................................................ 2-10 Figure 3‑1 Mosiac of Images from Pan/Tilt Camera Mounted............................................ 3-4 Figure 3‑2 Camera Mounted on Static Wire Robot. ......................................................... 3-5 . Figure 3‑3 Illustration of the MsS Guided Wave Technology Showing Transmission and Receiving.............................................................................................. 3-16 Figure 3‑4 A Single MsS Generates and Detects Guided Waves Propagating in Both Directions......................................................................................... 3-16 Figure 3‑5 MsS Wave Reflected by a Defect in a Pipe...................................................... 3-17 Figure 3‑6 Energized Implementation of EPRI EMAT Device to Inspect for Broken Srands Internal to the Conductor Shoe............................................. 3-22 Figure 3‑7 Cathodic Protection Rectifier Connected to a Pipeline. ...................................... 3-26 . Figure 4-1 Proposed Demonstration System Sensor/Hub Configuration. ............................. 4-2 . Future Inspection of Overhead Transmission Lines xi
  • 14.
  • 15. List of Tables Table 2-1 List of Sensor Needs..................................................................................... 2-4 Table 2‑2 Performance Characteristics for Analysis of Communication Technologies........... 2-11 . Table 3‑1 Summary Table............................................................................................ 3-2 Table 3‑2 Summary of IEEE 802 Technology.................................................................. 3-32 Table 3‑3 Summary of Non-Standardized RF LOS Technology.......................................... 3-33 Table 3‑4 Summary of IEEE 802 Technology.................................................................. 3-34 Table 3‑5 Summary of RF Backscatter Technology........................................................... 3-35 Table 3‑6 Summary of SATCOM Technology................................................................. 3-36 . Table 3‑7 Summary of Infrared Technology ................................................................... 3-37 Table 3‑8 Summary of Fiber Optic Technology .............................................................. 3-38 Table 3‑9 Summary of Free Space Optical Technology.................................................... 3-38 Table A‑1 Sensing Technology Summary Table............................................................... A-2 Future Inspection of Overhead Transmission Lines xiii
  • 16.
  • 17. Background 1 BACKGROUND T ransmission line components are currently inspected assessed utilizing field personnel, whether ground based or airborne. EPRI, and others, have in the past, and are currently developing inspection technologies for implementation using traditional manned inspection methods. The consideration for automated/unmanned implementation of inspection technologies is generally not accounted for in developments, as viable approaches for automated inspection are not in place and it is a futuristic thought rather than a present day reality. With the advent of transmission line security issues the pressure/ opportunity for automated, unmanned/continuous monitoring on transmission lines is increasing with a nearer term focus. Technology developments in sensors, robotics, unmanned vehicles, satellite and wireless data communications could be leveraged to enable the development of an effective automated inspection system for transmission line/tower monitoring applications. A meeting was held on May 16, 2007, with EPRI and some of their electric power utility members, in order to kick off this effort. EPRI provided the following reports for reference: ■ Overhead Transmission Inspection and Assessment Guidelines – 2006, 4th Edition (1012310) ■ Airborne Inventory and Inspection of Transmission Lines, Airborne Patrol System Advanced Prototype, Technical Progress, November 2000 (1001168) ■ Airborne Inventory and Inspection of Transmission Lines, Unmanned Airborne Vehicle (UAV), Final Report, September 2000 (1000712) ■ Airborne Inventory and Inspection of Transmission Lines, Avcan System Corporation’s Helicopter Patrol System, Final Report, March 2000 (TR-114773) ■ Airborne Inventory and Inspection of Transmission Lines, Airborne Patrol System, Final Report, December 1999 (TR-114229) ■ Airborne Inventory and Inspection of Transmission Lines, Unmanned Airborne Vehicles (UAV), Final Report, December 1999 (TR-113682) The objectives and outline of this document are as follows: 1. Document the system concept as agreed upon at the kick off meeting 2. Address candidate technology for the system 3. Address demonstration scenarios for potential near future implementation Future Inspection of Overhead Transmission Lines 1-
  • 18.
  • 19. System Concept 2 SYSTEM CONCEPT A system concept is defined for the instrumentation of electric power utility towers with sensor technology designed to increase the efficiency, reliability, safety, and security of electric power transmission. The system concept is fueled by a list of sensing needs that was generated at the kickoff meeting and is provided for reference in Figure 2‑2. The variety of sensor needs is illustrated in Figure 2‑1. It was agreed that the system scope is limited to transmission line applications (i.e., 69 kV and above), not distribution, with the focus on steel lattice and pole structures, not wooden. It was also agreed that the addition of wiring to interconnect and/or power distributed sensors is not viable because of electromagnetic susceptibility concerns and labor intensive installation. Consequently, sensor concepts will rely on wireless and/or fiber optic technology. Figure 2‑2 and Figure 2‑3 shows some of the high level concepts that are listed below: ■ Sensors distributed on transmission structures and/or conductors. ■ Sensors that may or may not communicate with “hub” installed on the structure – either wireless or wired. ■ Sensor information is collected, stored and analyzed in a “central database” which is part of the utility’s current data management system. The data is collected/communicated from the sensors/“hubs” to the “central database” using one of the following methods: ■ Wirelessly back to the “central database” from the individual structure “hub”, e.g. RF directly, via satellite or cell phone network. Figure 2‑1 Illustration of Sensor Needs for Transmission Lines and Towers Future Inspection of Overhead Transmission Lines 2-
  • 20. System Concept ■ Collected using a vehicle traveling the length of the line. The data from the collection vehicle is transferred during or after the inspection. The following is a list of possible data collection vehicles: – Unmanned Airborne Vehicle (UAV) – Manned Aerial Vehicle – “Line Crawler” Robot ■ If the vehicle data collection approach is utilized: – The vehicle may collect the data wirelessly directly from the sensors (possibly excluding the need for a structure “hub”). – The vehicle may also have sensors aboard recording data during the collection process, (e.g. video, UV, IR, still images). These concepts are discussed in detail in the following sections. Figure 2‑2 Conceptual Sketch Showing Possible Scenarios for Inspecting Transmission Lines of the Future 2.1  System Architecture The system is comprised of a) sensors that acquire diagnostic data from components of interest and b) communications hubs that collect the sensor data and relay it to a central repository. Sensors may be directly attached to the item being monitored, or may be remotely located such as in the case of a camera. Communications hubs may be mounted on or near towers or may be located on a wide variety of mobile platforms, such as manned airplanes or unmanned line crawlers or UAVs. Sensors and hubs may operate and be polled periodically (e.g., at intervals of minutes, hours, days) or continuously monitored (e.g., a real time alarm) depending on the application. In any case, sensors communicate their results via hubs to a central repository. Figure 2‑4 illustrates the architecture and flow of data. 2- Future Inspection of Overhead Transmission Lines
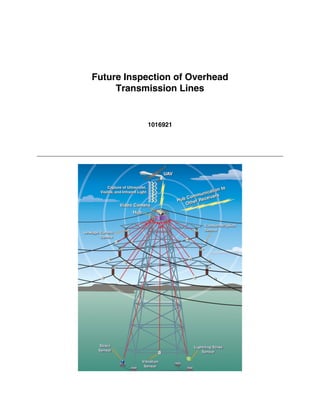
  • 21. System Concept Figure 2‑3 Image Showing a Single Structure Illustrating Some of He Concepts An important feature of the system is flexibility and interoperability with a wide variety of sensor types and communications methods. The information that is required for each sensor reading is: ■ Unique sensor ID (across all sensor types) ■ Raw data measurement or processed result ■ Date and time of the reading ■ Sensor type and geo-location The sensor type and geo-location may be associated with the ID and hard coded in a database at the central repository so that this information doesn’t need to be redundantly transmitted through the system for every reading. For remote mobile sensors, the geo-location will need to be communicated so that the system can associate the reading with a particular item (at a known geo-location) or area of interest. Future Inspection of Overhead Transmission Lines 2-
  • 22. 2- Table 2-1 List of Sensor Needs Update Item Cause Result Probability Consequence Sensing Technologies Interval System Concept 1 System Tampering Terrorism Tower/line down Real-time Low High Vibration, Acoustic, E-Field, Optical 2 System encroachment Man-made Safety hazard, 3–12 mo High Med Optical, Satellite, Proximity, Vibration, Less reliable E-Field 3 System encroachment Vegetation Flashover, Fire 3 mo High High Optical, Satellite, LIDAR, Line-of-Sight, Proximity 4 System encroachment Avian Nesting, Flashover 6–12 mo High High Optical, Vibration, Leakage Current, Waste Proximity, E-Field 5 Shield Wire Corrosion Flashover, Outage 3–6 years Med High Optical, IR Spectroscopy, Eddy Current, MSS 6 Shield Wire Lightning Flashover, Outage 1 year Med High Optical, IR Spectroscopy, Eddy Current, MSS, Lightning Detection, Vibration 7 Insulator (Polymer) Age, Material Outage 6 years Med High Optical, Vibration, RFI, UV, IR Failure 8 Insulator (Ceramic) Age, Material Outage 12 years Low High Optical, Vibration, RFI, UV, IR Failure Future Inspection of Overhead Transmission Lines 9 Insulator Contamination Flashover 3 mo Med Med Optical, RFI, UV, IR, Leakage Current 10 Insulator Gun Shot Outage Real-time, Med High Optical, Vibration, RFI, UV, IR, Acoustic 3 mo 11 Phase Conductor External strands Line Down, Fire 1 year Low High Optical, Vibration, RFI, UV, IR broke 12 Phase Conductor Internal strands Line Down, Fire 1 year Low High E-MAT, MSS, Electromagnetic broke 13 Phase Conductor Corrosion of Line Down, Fire 1 year Low High E-MAT, MSS, Electromagnetic, steel core IR Spectroscopy, Optical
  • 23. Table 2-1 List of Sensor Needs (Continued) Update Item Cause Result Probability Consequence Sensing Technologies Interval 14 Connector Splice Workmanship, Line Down, Fire 1 year Med High Direct Contact Temperature, thermal cycling, IR Temperature, Ohmmeter, RFI, age E-MAT, MSS 15 Hardware Age Line Down, Fire 6 years Low High Optical, IR Spectroscopy 16 Phase Spacer Age, galloping Line Down, Fire 6 years Low Med Optical, UV, RFI event 17 Aerial Marker Ball Vibration Dam‑ Safety concerns 1 year Low Med Optical, UV, RFI age, Age 18 Structure (Steel Lattice) Corrosion Reliability concerns 10 years Med Med Optical, IR Spectroscopy 19 Structure (Steel Lattice) Bent, damaged Reliability concerns 1 year Med Med Optical, Strain, Position, Tilt members 20 Structure (Steel Pole) Corrosion, age Reliability concerns 10 years Med Med Optical, IR Spectroscopy 21 Structure (Steel Pole) Internal Deterio‑ Reliability concerns 1 year Med Med Optical, MSS, Ultrasonics ration 22 Foundation (Grillage) Age, corrosion Reliability concerns 10 years High High Excavation, MSS, Radar, GPR Imaging, Half Cell, Voltage Potential 23 Foundation (Anchor Bolt) Age, corrosion Reliability concerns 10 years Low High Optical, Ultrasonics, E-MAT, Vibration 24 Foundation (Preform) Age, corrosion Reliability concerns 10 years Med High Optical, Ultrasonics, E-MAT, Vibration 25 Foundation (Stub Angles) Age, corrosion Reliability concerns 10 years Low High Optical, Ultrasonics, E-MAT, Vibration 26 Foundation (Direct Age, corrosion Reliability concerns 10 years High High Excavation, MSS, Half Cell, Voltage Embedment) Potential 27 Foundation (Anchor Age, corrosion Reliability concerns 10 years High High Excavation, MSS, Half Cell, Voltage Rods, Screw-In) Potential, Ultrasonics 28 Grounding Age, corrosion, Reliability, Light‑ 6 years Med Med AC impedance, DC resistance, Impulse Future Inspection of Overhead Transmission Lines tampering ning, Safety concerns System Concept 29 TLSA (Transmission Line Lightning Reliability, Lightning 1 year Med Med Optical, IR, Leakage Current, Lightning 2- Surge Arrestor) Strikes, age concerns Strike Counter
  • 24. System Concept UnManned Manned UAV Airplane Balloon Helicopter Satellite Truck Robotic Crawler Backpack Mobile Platform Sensor Comm Hub Central Repository Comm Hub Sensor Item under Item test under Sensor LEGEND test Short Range Data Item Long Haul Data under Sensor test Remote Sensing Sensor Direct Sensing Sensor Item Sensor under Item test Sensor under Item test under test Item under Tower Structure test Figure 2‑4 Sensor System Architecture and Data Flow For flexibility, multiple protocols at the physical layer may be used for both short range communications between sensors and hubs, and long haul communication between hubs and the central repository. Consequently, every hub type need not read every sensor type, and every hub type need not communicate with the central repository. There may be applications where relaying readings from one hub to another is an effective method to communicate data back to the central reposi‑ tory. Similarly, relaying readings between sensors before reaching a hub is also an acceptable communications approach. With regard to the handling of sensor data, there are system tradeoffs between processing power, communications bandwidth, and digital storage capacity. The system must be flexible to allow different sensor applications to handle these tradeoffs differently. For example, in some applications it will be most efficient and optimum to process sensor data locally at the sensor and to report back the reading as a simple answer, e.g. “no encroachment detected”. In other applications it may be desirable to have all of the information communicated back to the central repository for archival and possibly even human interpretation. In the former case, the amount of data to be passed through the communication channel is very low (1 bit, maybe once a day), but the processing power required at the sensor may be high in order to make an intelligent decision with high confidence. In the latter case, the amount of data passed through the communications channel is very high (maybe 10M byte for a high resolution image), with much greater potential for impact to system throughput and storage space. The latter approach may be merited when automated results are questionable and manual interpretation of the raw data is required. 2- Future Inspection of Overhead Transmission Lines
  • 25. System Concept Hybrid sensing protocols or approaches may be advantageous and are supported by the system architecture. For example, a flag sensor may simply indicate when an condition needs to be further evaluated; Whether done remotely or while in the field, it may be desirable to interact with the sensor in order to control the amount of detailed data that is provided. The flag sensor may conserve power by not communicating until there is a problem. One possibility is an intelligent sensor that monitors a system condition, and then, based on the sensed severity, applies a commensurate amount of on-board resources (power, processing, memory, communications bandwidth) in order to operate effectively and with high efficiency. The key functional features of sensors and hubs are illustrated in Figure 2‑5 and Figure 2‑6 respectively. Sensors typically require a source of power, a sensing mechanism, a controller to format measurements into readings, and a short range wireless data communications mechanism. Communications hubs have similar needs for power and controller functions, and in addition need wireless data communication mechanisms to collect sensor readings (short range) and to relay sensor readings to the central repository (long range). Hubs may also have local memory for storing readings, either to buffer data when communications links are down, or as a local repository for data archival/backup. Although the functional differences between sensors and hubs are delineated in these diagrams, device implementation is flexible to combine features. In other words, hubs can also incorporate sensors and sensors can also serve as hubs, it is not a requirement that they are separate devices. For example, a hub could have a weather station hardwired into it, as well as built-in tower tilt and vibration sensing, for added value. A distinguishing feature of a combinational device that is thought of as a “sensor” versus a “hub” may be its power source. Sensor devices are in general expected to harvest power from the environment and thus require very low maintenance, preferably none. Whereas hubs are in general expected to be more complex, requiring possibly significant power sources such as large batteries, and thus would require periodic maintenance. Conceptually, sensors use a short range wireless link to the hub which uses a long range wireless link to the central data repository. This is not a requirement, but is based on the vision that many low-cost, low-power, low-bandwidth sensors will be deployed at a tower site, and that a local hub can help by collecting this data, providing a local redundant data repository, and coordinating long haul communications. 2.2  Communications Considerations A communications system for the instrumented tower concept provides a means for communicating sensor data at transmission line structures to a central data collection and processing facility. A system for large-scale, distributed monitoring and control is termed a Supervisory Control and Data Acquisi‑ Environmentally Hardened Packaging Environmental Harvesting Desired, Otherwise Internal Power Battery or Fuel Cell Interface to Component Under Test 1. Direct Attachment Wireless 2. Remote (e.g. camera) Sensor Controller Short Range Communications Wireless Communications with other Sensors or Hub Figure 2‑5 Sensor Functional Diagram Future Inspection of Overhead Transmission Lines 2-
  • 26. System Concept Environmentally Hardened Packaging Environmental Harvesting Desired, Otherwise Internal Power Battery or Fuel Cell Short Range Wireless Communications with Sensor Wireless Sensors Controller Reader Communications Wireless Interface to Pass Readings to Other Hubs (Daisy Chain) or Over Long Haul Link to Central Repository Memory to Store Readings Figure 2‑6 Communications Hub Functional Diagram tion (SCADA) system. SCADA systems for wide-area monitoring have long been in existence and offer reliability enhancements for electrical power transmission systems. The instrumented tower concept requires a customized implementation based on the sensor population, data rates, and ranges, that can be interfaced into the central facility SCADA system or operate standalone running its own SCADA. This project does not address the SCADA layer, it instead focuses on the hardware making sure that the system is realizable with the proper protocols in place. Both the transmission line infrastructure and the sensors used for monitoring the infrastructure define the requirements for the operational characteristics of the instrumented tower communication system. The primary considerations are distance over which the data needs to be communicated (referred to as range) and the amount of data to be communicated in a period of time (referred to as data rate). Communication system range is influenced by several factors. The structures under consideration are steel poles and steel lattices installed over hundreds of miles, and the data that is generated locally needs to be collected at a central facility that may be tens to hundreds of miles away. Structures typically range from 80 to 140 feet in height, although there are extreme cases as high as 300 feet. Structures are typically separated by 500 to 1,800 feet, although sometimes they may be closer. A variety of sensor configurations are envisioned within the system concept. Some sensors will be attached directly to transmission line components, for example conductor splices. Other sensors will be mounted to the structures themselves in order to monitor the structure integrity. Sometimes sensors mounted on structures will be used to monitor the condition of other components and structures, for example a camera with a high F-number lens might monitor a neighboring tower for tampering and right-of-way activity between towers. The need for these different sensor configurations leads to a distributed sensing system. The communications system will need to coordinate the collection of data from many distributed sensors for transfer to a central facility. The distributed location of sensors imposes several constraints on the sensor design. Sensors on the conductors between towers need to be small, low power, and have a local power source with a limited power producing capacity. Sensors on the tower structure can be larger in size and power consump‑ tion. The constraints of the sensor also apply to the technology selected for communicating the sensor data. Because low power consumption is the most restricting constraint for the sensors between towers, 2- Future Inspection of Overhead Transmission Lines
  • 27. System Concept the communication technology is consequently relatively short-range and infrequent to keep power consumption at a minimum. The opposing requirements of low power consumption and short range communication versus needing to collect data at a far away central facility influence the architecture of the communication system. The required data rate is defined by the type of sensor technology. The temperature sensor for a splice transmits a very small amount of data, and the data is required infrequently. Thus, the aggregate data rate is very low. Conversely, the camera output could be a sequence of frames or a continuous video output that would need to be communicated using a high-speed and possibly continuous data link. The data rate influences the power requirements for the communication technology. Since hubs will likely require much higher power consumption than sensors in order to support long range communications and greater bandwidth, it may be beneficial to incorporate a large solar panel with battery at the hub. This would dictate additional logistics and periodic maintenance, but the tradeoff may be worthwhile. On the other hand, it would not be desirable to do that for a large population of sensors. Data from each sensor cannot be directly transmitted to the central facility due to range and power consumption trades. Thus, the communication system requires data communication relays. A number of architectural options for the communication system are available to accomplish this: 1. Sensor to passing mobile platform (e.g., robot or a low altitude air vehicle like a UAV or a helicopter) to central facility. 2. Sensor to sensor, daisy chained to central facility (e.g. a mesh network). 3. Sensor to over-the-horizon platform (e.g., balloon or a satellite) to central facility. 4. Sensor to hub on a nearby tower. The hub has the similar options of hub to passing platform, hub to hub, and hub to over-the-horizon platform for passing data to a central facility, except that the hub can possibly be longer range and higher transmitted and consumed power. Daisy chaining sensors and/or hubs results in an additive effect on the quantity of data to be communicated at each node. However, the very low duty cycle and data rate of many of the sensors make daisy chaining possible for certain sensor technologies. Higher data rate sensors may require more restric‑ tions on the number of devices sharing a communication channel. A combination of daisy chaining and long haul communications may be an effective compromise. For example, towers 1–20 could operate as a daisy chain with tower 20 transmitting back to the central facility. The next 20 towers could be configured the same way. Range and data rate effect the communication system architecture and a number of architectural options should be considered during the evolution of the instrumented tower concept. To assist the architectural development process, the fundamental performance characteristics of the communications system are outlined in Table 2‑2 along with a rough assessment of the associated requirement for the instrumented tower system concept. 2.3  Power Considerations Sensors and communications hubs will require power for operation. While batteries may be convenient to test and demonstrate the system, they are seen as a maintenance problem in the instrumented tower concept. The goal is to use renewable power sources in lieu of batteries. This is a difficult challenge, especially for wide range high bandwidth data communications requirements. With present technology, it is not really possible to implement a batteryless system except for very limited and simple scenarios. Even over the next 20 years, without significant breakthroughs this will remain a difficult challenge, albeit a worthy one to keep in mind as new technologies are introduced. Future Inspection of Overhead Transmission Lines 2-
  • 28. System Concept Figure 2‑7 Communications Networking Concept Alternatives to batteries include solar, wind, kinetic (line vibration), thermoelectric, radio waves, and the electric and magnetic fields that are generated from the power lines themselves. There are significant limitations with each of these alternatives, but in the right application they may be effective. For example, the EPRI splice sensor (discussed later under candidate technology), when attached to transmission lines that carry 100 Amps and greater currents, can harvest the magnetic field that is generated by that current, and in turn power the sensor without the need for a battery. The use of a rechargeable battery coupled with power harvesting may have strong merit. The present challenge with this approach is overcoming a limited number of recharge cycles and low temperature operation, but even a compromise solution may still hold high value now while technology improvements are anticipated. Potential for Harvesting Power from Line Vibration For sensors located on or very near a conductor, such as splice sensors or insulator sensors, energy harvesting using vibration may be a possible solution. Wind causes Aeolian vibrations to occur in transmission lines, the frequency and amplitude of which are determined by the wind velocity normal to the conductor length and the diameter of conductor. For a typical transmission line application using ACSR Drake conductor, vibration displacement amplitudes in the frequency range of 17–35Hz are typically on the order of 5%–12% of the conductor diameter when one vibration damper is used on the line, and between 3%–8% of the conductor diameter when two vibration dampers are used.1 Using the standard diameter of Drake conductor of 1.108 inches, the anticipated vibration displacement in the frequency range of 17–35Hz is between 30 and 100 mils. This corresponds with acceleration levels of approximately 0.1g–0.7g. The most common approaches to converting vibration energy into electrical power are through electrodynamic (moving coil through a magnetic field) and piezoelectric (conversion of strain energy to charge in polarized materials) transduction. Piezoelectric energy harvesting has been 1  Transmission Line Reference Book, Wind-Induced Conductor Motion, Electric Power Research Institute, 1979. 2-10 Future Inspection of Overhead Transmission Lines
  • 29. Table 2‑2 Performance Characteristics for Analysis of Communication Technologies Characteristic Description Assessment of Requirement Range Distance between communication nodes (i.e., a transmitter and Short range: several hundred feet (conductor to tower; intra-tower) receiver), which can vary between tens of feet for line to tower Medium range: a couple of thousand feet (tower to tower) communication or hundreds of miles for tower to central data Long range: up to 100s of miles (tower to central facility) collection facility communication. Frequency Band Frequency band for transmitting and receiving data, which affects Unlicensed preferred the need for licensing, meeting regulatory standards, maximum data throughput, certain multiple access schemes, and antenna size. Network Topology Architecture for transferring data among system elements. Common Dependent upon communication architecture; most likely network topologies include point-to-point, line, star, ring, mesh, and a point-to-multipoint topology bus. Link Availability Access to the communication channel as determined by line of sight Burst modes (low data rate/duty cycle sensors) constraints, methods for establishing a link, including link initiation Continuous (video sensors) and synchronization protocols; and certain aspects of multiple access methods including time-slot restrictions, spatial diversity, and duplexing method. Link Robustness Ability to establish and maintain the communication link when the Required, but minor outages may be acceptable channel is degraded by such factors as rain, atmospheric conditions, interference, jamming, dense foliage, urban canyons, and multipath. Robustness is determined by link margin, frequency use, frequency diversity, bit error detection and correction techniques, and communica‑ tion protocols (e.g., transmit-only or acknowledge with retry protocols). Data Throughput Amount of data through the system in a given time period, as limited kbps (low data rate/duty cycle sensors) by the data rate (bits/second) of the transmission, continuous or bursty Mbps (video sensors) Future Inspection of Overhead Transmission Lines nature of the transmission, type of modulation, message length, num‑ ber of message bits that contain user data, two-way communication duplexing techniques, media access restrictions, collision handling System Concept and avoidance schemes, and acknowledgement protocols. 2-11
  • 30. 2-12 Table 2‑2 Performance Characteristics for Analysis of Communication Technologies (Continued) Characteristic Description Assessment of Requirement Data Availability System latency, which is the time the data was sent until the time the Hours, to days, to months System Concept end user receives the data, as affected by the system architecture and data distribution systems. System Capacity Number of simultaneous users and total number of users in a system Thousands of sensors as limited by constraints of the signal processing system and multiple access methods defined by frequency use, collision avoidance protocols, time-slot restrictions, spatial diversity, and duplexing method. Power Amount of power consumed by the communication equipment on the Very low power (microwatt) Consumption sensor to communicate data, which defines the types and capacities Low power of power source for a particular sensing application. Power consump‑ tion is primarily affected by the data rate and communication range of the communication equipment for a given technology. Size Dimensions of the communication equipment including the electronics, As small as practical power source, power regulation and control circuitry, and antenna. The size is dependent upon the technology used and is influenced by the transmitted RF power necessary to close the link, complexity of the transmitted waveform, and the necessity of a receiver if two-way Future Inspection of Overhead Transmission Lines communication is possible and/or necessary. Maturity of Measure of how long the technology has been available, which Low risk, widespread availability, roadmap for longevity Technology can indicate the availability and variety of products, the commercial acceptance of a standard or de-facto standard and thus its possible longevity or the importance of long-term support for legacy products. Cost of Communi‑ Costs of communication equipment development, production, Moderate non-recurring engineering costs, low production costs, cating Data installation, and accessing the infrastructure. and low maintenance and infrastructure operation costs Human Interface The need for a person in the loop in order to configure, operate, Minimize need for human intervention. A highly automated and maintain the system system is desired
  • 31. System Concept shown to be more efficient than electrodynamic harvesting, and several companies are currently developing off the shelf solutions for piezoelectric vibration energy harvesters. One device that is currently commercially available can produce up to 2mW of harvested power for vibration levels of less than 1g.2 Other researchers have claimed power density values as high as 40mW/cc per g of acceleration.3 A review of several research efforts on power harvesting using piezoelectric materials was performed by Sodano, Inman, and Park.4 In this review, both methods of transduction and methods of energy storage were evaluated. In most applications, energy generated by vibration energy harvesters must be stored for later use. Two methods of storing this energy are the use of storage capacitors and the use of rechargeable batteries. One of the research efforts demonstrated that fully discharged batteries could be recharged without the use of any external power source. The summarized research concluded that rechargeable batteries provided much more versatility than capacitors due to the capacitor’s inability to store large amounts of power and the fast discharge rate of capacitors. With optimal vibration conditions and power storage circuitry, efficiencies as high as 50% were experimentally obtained by one research team, and as high as 70% were obtained by another. This is many times higher than the most efficient solar cells currently available. As technology evolves, vibration harvesting may provide a viable and affordable means of powering distributed sensors, though their application for the smart transmission line concept will probably be most feasible on those sensors located on or near a conductor. Potential for Harvesting Power from the Wind A windmill developed by S. Priya [reference Priya S., Applied Physics Letter 87, 184101 (2005)] of approximately 10 cm across, is attached to a rotating cam that flexes a series of piezoelectric crystals as it rotates. Piezoelectric materials generate a current when they are squeezed or stretched, and are commonly used to make a spark in gas lighters. Priya has found that a gentle breeze of 16 km per hour can generate a constant power of 7.5 milliwatts, which is adequate to operate many types of electronic sensors. A conventional generator that used a 10-cm turbine would convert only 1% of the available wind energy directly into electricity, but a piezoelectric generator can convert up to 18%, which is comparable to the average efficiency of the best large-scale windmills, according to Priya. Priya has also patented a much smaller device, measuring just 0.5 cm a side, which is driven by a smaller turbine fitted with tiny wind-catching cups, similar to the devices used by meteorologists to measure wind speed. Potential for Optical Power Transmission Non-conducting fiber optics can be used to transmit small amounts of power, although the efficiency is low. The system consists of an optical source (LED or laser diode) coupled to a fiber optic cable that delivers the light to a photovoltaic junction. Assuming a 1 watt laser diode or super-bright LED source, rough calculations indicate that 10 to 30 mW of power can be generated at a photovoltaic junction (solar cell). This is based on 50% efficiency cou‑ pling to and from the fiber optic and 4 to 8% photovoltaic conversion efficiency. This example of energy conversion efficiencies is only a guide; more accurate calculations with specific components and laboratory confirmation should be done if this is to be considered as a viable power option. 2  http://www.mide.com/prod_energy_harvester.html#specifications. 3  http://www.omegasensors.com/datasheets/Energy%20Harvester%20Flyer.pdf. 4 “A Review of Power Harvesting from Vibration Using Piezoelectric Materials”, The Shock and Vibration Digest, 2004. Future Inspection of Overhead Transmission Lines 2-13  
  • 32. System Concept Although this efficiency of 1 to 3% is very low, there are cases where this method may be useful for powering a remote sensor. For example, if a solar panel and battery is located on top of a tower, a sensor at the base of the tower could be operated by a two-fiber cable down the tower. One fiber would carry power and the other would be used to transmit control and data signals. For micropower sensors that are operated only a few minutes a day, the low efficiency may not be a factor. Potential for Other Power Harvesting Methods There is good potential for other power harvesting methods as well, although a technical review of these technologies is not a focus of this report. In close proximity to a transmission line system, the high electric and magnetic fields can be harvested as is demonstrated by the EPRI splice sensor. Solar power is also recognized as a prime candidate. 2-14 Future Inspection of Overhead Transmission Lines
  • 33. Candidate Technology for the Instrumented Tower 3 CANDIDATE TECHNOLOGY FOR THE INSTRUMENTED TOWER T here are many sensor, data communications, and mobile collection platform technologies that could be applied to the instrumented tower concept. This report attempts to address and provide insight into some of the enabling technologies that appear to be suited for the application. Candidate technologies are examined with regard to their suitability and state of readiness for the application, expectations for development potential over the next 20 years, and design constraints such as power requirements, physical requirements (size, weight, attachment, durability), and data/bandwidth requirements where applicable. This section of the report is organized into three main areas as follows: 1. Sensing technology 2. Data communications technology 3. Mobile collection platforms 3.1  Sensing Technology Sensing needs were a focus of the kickoff meeting and are documented in Table 3‑1. Insight into some of the sensing technologies that were identified as candidates to meet those needs is provided in this section, organized as follows: 1. Optical Image Sensing 2. Infrared Image Sensing 3. Ultraviolet Image Sensing 4. Satellite Image Sensing 5. LIDAR 6. Vibration Sensing 7. Acoustic Sensing 8. Strain Sensing 9. Tilt Sensing 10. Magnetostrictive Sensing (MsS) 11. Ultrasonic Sensing 12. Electromagnetic Acoustic Transducer (EMAT) 13. Eddy Current Sensing 14. Ground Penetrating Radar (GPR) 15. Proximity Sensing 16. Voltage Potential and Half Cell Measurement 17. Radio Frequency Interference Sensing 18. Leakage Current Sensing 19. Direct Contact Temperature Sensing 20. Lightning Sensing and Counting Table 3‑3 below summarizes the technologies above addressed in this report and maps them to categories of sensing applications derived from the needs documented in Table 2‑1. Future Inspection of Overhead Transmission Lines 3-
  • 34. 3- Table 3‑1 Summary Table Candidate Technologies (2.1) Voltage Leak‑ Infra‑ Ultra‑ Satel‑ Vibra‑ Ultra‑ Eddy Prox‑ Poten‑ Temper‑ Light‑ Optical LIDAR Acoustic Strain Tilt MsS EMAT GPR RFI age red violet lite tion sonic Current imity tial Half ature ning Current Cell Application 3.1.1 3.1.2 3.1.3 3.1.4 3.1.5 3.1.6 3.1.7 3.1.8 3.1.9 3.1.10 3.1.11 3.1.12 3.1.13 3.1.14 3.1.15 3.1.16 3.1.17 3.1.18 3.1.19 3.1.20 COUNT Mechanical/Structural Integrity    Foundation x x x x x 5    Tower Structure x x x x x x x x x x 10    Hardware x 1    Connectors, Splices x x 2    Conductors x x 2 Candidate Technology for the Instrumented Tower Electrical/Operational Integrity    Connectors, Splices x x 2    Conductors x x 2    Insulators x x x x x 5   Transmission Line x x x x x 5 Surge Arrestors Future Inspection of Overhead Transmission Lines Clearance    Trees x x x x 4    Avian x x x x x 5    Encroachment x x x x x 5    Line Sag x x x 3   Galloping x x 2 conductors Security   Tampering (in x x x x 4 process)    Tampering (result of) x x x 3 COUNT 11 4 2 3 4 6 2 1 2 2 2 3 1 1 6 2 2 2 2 2
  • 35. Candidate Technology for the Instrumented Tower 3.1.1  Optical Image Sensing Optical imaging includes methods in which an image provided by a camera is interpreted by computer analysis to identify or detect specific conditions. Different camera systems can provide image repre‑ sentations in visible, infrared or ultraviolet spectral bands and each of these bands has advantages for detecting different conditions or defects. There are also a variety of methods for positioning or deploying imaging cameras with some choices more suitable for detecting certain types of defects. Optical imaging is the automated analog of current visual inspection methods and has potential application for a high percentage of the transmission line components to be inspected. Image Analysis Computer analysis of images to detect specific conditions or abnormalities is widely used in manufacturing and other well-structured areas where images are obtained with consistent lighting, viewpoint, magnification and other factors. Analysis of outdoor images with wide variations in illumination is more complex but adaptive methods are available to compensate for changing conditions of sun and shadow. Statistical methods are used to normalize image intensity and minimize the effects of slowly changing artifacts such as shadows and glare spots. Computer analysis typically consists of several steps: 1. Image capture using monochrome, color, infrared or ultraviolet cameras. The image is converted to a digital representation either internally in a digital camera or by a frame grabber if an analog camera is used. 2. A filtering step is usually included to remove image noise, normalize illumination or enhance image contrast. 3. The image is segmented to identify regions that correspond to physical object such as trees, towers, insulators or conductors. Segmentation algorithms may be based on finding edges, corners or other shapes. Segmentation may also be based on color differences or difference in image texture or other patterns. 4. Each object identified in the segmented image is characterized by describing a set of features. These feature sets include measurements of intensity, area, perimeter, shape, color and connections to other objects. 5. Feature sets are matched against a database to identify specific types of objects. For example a large green object with a generally round shape would be classified as a tree or bush while a long thin object with no connection to other objects could be classified as a conductor between towers. 6. Finally, analysis of each object is done by comparing specific characteristics of the observed object with conditions specified in the database. In the case of a tree or bush, the comparison might be related to the position in the right-of-way while in the case of a conductor; the condition might be the amount of mid-span sag or the absence of a marker ball. 7. If certain conditions are met or not met, the computer system would signal to an operator for corrective action. The condition of transmission lines changes really slowly and there is a relatively low level of activity on and around a line. This may make the processing of images more feasible. However many of the condi‑ tions that are being inspected for are hidden from clear view or require multiple lines of sight making it difficult. With this in mind, three primary approaches to camera deployment and image processing are discussed below. Future Inspection of Overhead Transmission Lines 3-
  • 36. Candidate Technology for the Instrumented Tower Fixed Cameras- Image analysis is simplified when cameras are mounted at fixed locations with fixed orientations. This facilitates storing a reference image for comparison with the current image to determine if anything has changed. For example, a camera mounted on a tower could capture images showing the right-of-way under the conductors and compare with a reference image. If image analysis detects any new object in the current image, this would be interpreted as encroachment in the right- of-way. A similar approach could be taken to evaluate component degradation. Pan/Tilt Mounts with Zoom Lenses- The fixed camera approach simplifies image analysis but would require more cameras than a method that utilizes cameras with azimuth and elevation (pan and tilt) control and possibly a zoom lens. Such a camera, mounted on a tower, could be controlled to execute a repeated observation of a transmission line span using a raster scan with the zoom lens increasing image magnification for more distant views. As illustrated in the figure below, a mosaic of 50 to 100 images will provide good detail of the right-of-way between towers, conductors in the span and the hardware of adjacent towers. Image analysis software would have to include inputs of the elevation and azimuth positions to determine the location of the image frame. This would be used to access a data base listing the types of objects expected in each frame for comparison with the objects found in the current image. A complete visual tour of spans forward and backward from the camera could be done in 10 to 20 minutes so inspection strategies could range from continual scans to detect possible vandalism or terrorist acts to once-a day or even less frequent scans to provide time for solar cell battery charging. Figure 3‑1 Mosiac of Images from Pan/Tilt Camera Mounted Movable Cameras- Additional flexibility can be introduced by mounting the camera, with pan/ tilt/zoom positioning, on a platform that can move along the transmission line span. The figure below illustrates the concept of a camera mounted on a robot that can move along a static wire to traverse multiple spans of a transmission line. In this case image analysis and comparison would include GPS coordinates of the robot location as well as of the elevation and azimuth orientations to determine the location of the image frame. The inspection strategy would most likely involve moving the robot to specified GPS coordinates and then capturing a sequence of images at predetermined elevation, azimuth and zoom settings. Objects identified in each frame would be compared to objects in a database for all frames of view along the transmission line. The imaging system could perform a complete video tour and analysis from one location in 10 to 20 minutes and the robot would then move to the next inspec‑ tion location, possibly 400 to 600 yards along the span. If power requirements can be met, this should result in inspection of 2 to 5 miles of line per day. Another approach would be to install a camera on a Unmanned Aerial Vehicle (UAV). This would have the advantage of a faster inspection time and ability to be deployed in storm response situations. 3- Future Inspection of Overhead Transmission Lines
  • 37. Candidate Technology for the Instrumented Tower Figure 3‑2 Camera Mounted on Static Wire Robot Cameras Mass production of components for consumer digital cameras has resulted in improved performance and reduced cost for cameras intended for automated computer image analysis. A large number of monochrome and color cameras with resolutions ranging from 640 x 480 pixels to 2K x 2K pixels are available and image resolutions are expected to increase in the coming years. Signal interfaces range from the conventional RS-170 analog signals to standard digital interfaces including USB, IEEE 1394 (Firewire), CameraLink and GigabitEthernet as well as wireless modes. In the future we cans expect to see fewer analog cameras and more high-speed digital transmission, especially wireless. Many cam‑ eras include electronic shutter control allowing extended exposure times for low light operation. Black and white cameras are more sensitive than color cameras. Sensitivity and SNR are primarily functions of the CCD imaging arrays and significant improvements are not expected in the near future. Summary of Cameras and Image Processing Commercial Color and monochrome cameras are being applied in many outdoor technology options surveillance applications. Very little software specifically developed for automated transmission line inspection is available but the building blocks for developing such applications exist. Expected Cameras and image processing computers will become physically smaller improvements over with higher resolution and greater processing capability in the future. the next 20 years As computer power increases, image analysis algorithms will become more capable, approaching artificial intelligence goals. Physical interface Optical methods are non-contact. Cameras can be equipped with requirements telephoto lenses to increase the stand-off distance though this reduces the field-of-view. Zoom lenses can be used to provide large scene overviews and highly magnified views of critical locations. Power requirements Typical voltages are 5 VDC and 12–24 VDC. Power consumption is typically 1 to 5 watts. Data/bandwidth Video data rates are required between the camera and image processing computer but data from the camera-computer system will be low bandwidth, digital data describing a specific condition identified by image processing. In addition, it would be desirable to transmit images of the condition for reference or additional interpretation by an operator. Digital images would be in compressed format and might range from 50 to 300 kilobytes. Size/weight From 1” x 1” x 1” to 2” x 2” x 4” and weighing from a few ounces to a pound. Future Inspection of Overhead Transmission Lines 3-
  • 38. Candidate Technology for the Instrumented Tower Smart Cameras- Several manufacturers supply cameras with image processing computers built into the case. All standard image analysis routines can be programmed in these “smart cameras”, eliminating the need for a separate image analysis computer. In addition to standard video output, these camera systems include USB and wireless interfaces so the results of image analysis can be reported over a low bandwidth channel. They also provide the capability of transmitting compressed images at low data rates when it is desirable for an operator to see a scene to verify a conclusion or decide of a course of action. Some of these smart camera computers can accept other input signals so they could potentially provide all of the computational functions of a sensor node. Summary of Smart Cameras Commercial Sony, VC Vision and others provide monochrome cameras in rugged technology options housings. The Sony system is based on a 400 MHz x86 architecture and is compatible with a number of image processing software packages. The VC Vision system is available with either color or monochrome imager and uses a 400 MHz processor from TI. Expected The variety and capability of smart cameras will increase rapidly. The improvements over systems will become physically smaller with higher resolution and greater the next 20 years processing capability. As computer power increases, more complex image analysis algorithms and software will be included with these systems. Physical interface Optical methods are non-contact. Cameras can be equipped with telephoto requirements lenses to increase the stand-off distance though this reduces the field-of-view. Zoom lenses can be used to provide large scene overviews and highly magnified views of critical locations. Power requirements Values for the Sony system are: 10.5 to 26.4 volts with 7.5 watts. Data/bandwidth The camera-computer provides Ethernet, USB 1.1 and RS-232 interfaces as well as digital i/o lines that could be used to control/sample other sensors. Data transmitted from the system will be low bandwidth, digital data describing a specific condition identified by image processing. Digital images would be transmitted in compressed format and might range from 50 to 300 kilobytes. Size/weight The Sony camera can be considered typical for this group. It is 2.3” x 2.2” x 4.5” and weighs 14 ounces. Applications of Optical Imaging Computer analysis of camera images can be used for automated detection of a wide range of defects that are currently found by visual observation. Encroachment on the ground or on towers can be identified by detecting objects in locations that should be clear. Wires and conductors can be inspected and broken strands that extend away from the surface of the cable can be detected. Images of insulators can be ana‑ lyzed and the presence of contamination or physical damage (such as gunshot damage) can be detected. The condition or absence of phase spacers or marker balls can be determined by image analysis. Also, tower tampering by terrorists or vandals could be promptly identified in order to alert authorities. The condition of structural components can be evaluated by image analysis although this is more complex. Edge and line detection algorithms would be used to identify lattice objects and these would be compared to database entries to determine if any are missing, bent or out of position. The surface patterns of steel poles or lattice members would also be analyzed to detect patterns that would indicate rust, corrosion or other surface damage. 3- Future Inspection of Overhead Transmission Lines
  • 39. Candidate Technology for the Instrumented Tower The effectiveness of inspecting components such as insulators and tower members will depend on the camera position and the viewing angle. If a single camera is mounted at the top of each tower, it will not be in a good position to see the insulators and lattice members of that tower and it will be a long distance from the adjacent towers. A camera on a line crawling robot would have the advantage of seeing the tower and insulators from several different positions and the robot moves toward the tower. 3.1.2  Infrared Image Sensing Infrared cameras are sensitive to longer wavelengths than conventional color cameras. The most useful infrared band for transmission line inspection is long-wave or thermal IR, from 8 to 14 micron wavelength. Early thermal infrared cameras used a single detector with a scanner to build up an image but current systems use microbolometer arrays and quantum well devices fabricated with typical resolution of 320 x 240 pixels. Many infrared camera systems today are designed for operators conducting thermal surveys and include image enhancement software and an LCD viewing screen. Most are intended for use at fairly short range and long focal length lenses (made from germanium) are expensive. Radiometric cameras are calibrated so that an accurate surface temperature can be read from the thermal image. Non-radiometric cameras provide an indication of relative temperature but do not give an absolute temperature. The amount of infrared radiation from a source depends on the temperature of the surface and also on the emissivity of the source. Very smooth or shiny surfaces emit a smaller amount of radiation than rough or dull surfaces. Accurate temperature measurements require knowledge or assumptions of the surface emissivity. When the surface condition is unknown it is still possible to identify hot spots by determining temperature differences even though the absolute temperature cannot be measured. IR cameras are often classified as cooled or uncooled. High-end thermal IR cameras often provide a peltier or compressor system to cool the detector to reduce the effect of thermal noise. Uncooled cameras typically are less expensive, smaller and use less power but will be less sensitive and have more image noise . Costs for thermal infrared cameras range from $7K to $50K depending on the features, resolution, accuracy and lenses included. Some IR cameras, such as the OEM Photon from Indigo or the Cantronic Thermal Ranger, are intended for integration into automated surveillance or inspection systems. Compared to handheld systems intended for operator use, these cameras are small, compact and have low power requirements. These would be suitable for an automated transmission line inspection station when used with custom image analysis software. In the transmission line inspection systems, thermal IR cameras are most often used to identify hot spots caused by leakage current dry band arcing on insulators or failing connections, e.g. splices o dead ends compression connectors. One alternative to a complete IR camera system is to include an infrared thermometer, which is a single IR detector with optics to focus radiation from a small area on the detector (essentially a 1x1 pixel camera). The IR thermometer would be mounted and bore-sighted to a conven‑ tional camera on a pan/tilt mount. Image analysis would be used to aim the thermometer at locations in the image where elevated temperatures might indicate failing components. Slight variations in the orientation could be used to build up a thermal image of a component. This process would be very slow compared to an array IR camera but might be a useful low cost alternative for a camera station placed on a tower where actual imaging will be required only a small fraction of the available time. Applications of Infrared Imaging Infrared imaging can be used to detect heat generated by insulator leakage currents or failing components such as a conductor splice. With appropriate image analysis, it could be used for automated detection of failing insulators or damaged conductors. Future Inspection of Overhead Transmission Lines 3-
  • 40. Candidate Technology for the Instrumented Tower Summary of Infrared Imaging Commercial Systems suitable for outdoor use and transmission line inspection technology options by an operator are available from several manufacturers. Most are battery powered and include image processing functions to enhance and measure temperature differences. IR imagers (without specialized image processing functions) are also available. Additional image analysis would be required for automated identification of thermal hot spots indicating a problem. Expected The image resolution of IR cameras will increase as nanotechnology improvements over techniques are applied to microbolometer arrays. IR cameras will be the next 20 years produced in greater variety and greater volume due to use in the surveil‑ lance and security areas. The increased volume will result in lower unit prices. “Smart IR cameras”, including a programmable image processing computer will be available. Digital interfaces, including USB, Firewire Ethernet and wireless will be included. Physical interface As an optical method, thermal IR imaging is non-contact. Stand-off requirements distances can range from several feet to several hundred feet if telephoto lenses are used. Power requirements Typically 7–15 VDC 2–15 watts for uncooled cameras Data/bandwidth The camera video interface is typically NTSC or PAL. After image analysis, data transmitted from the system will be low bandwidth, digital data describing specific conditions identified by image processing. Digital images would be transmitted in compressed format and might range from 50 to 300 kilobytes. Size/weight Dimensions from 2” x 2” x 4” (excluding lens) to 4” x 5” x 9” Weight from .5 lbs to 4 lbs depending on features and lens. 3.1.3  Ultraviolet Image Sensing CCD imaging arrays can be optimized for detection of ultraviolet light by making the silicon substrate very thin and directing the incident radiation onto the back surface. This overcomes the performance limits of the conventional front-illuminated CCDs by illuminating and collecting charge through the back surface away from the polysilicon electrodes. Ultraviolet cameras, sensitive to wavelengths shorter than the visible spectrum are widely used in astronomy and for inspection of silicon wafers. Many manufacturers of CCD arrays and video cameras offer “UV enhanced” versions for QA or process inspection. The primary use of UV cameras in transmission line inspection is to locate corona sources. One of the difficulties of detecting corona on transmission lines is that the large UV content of solar radiation is much greater than typical transmission line corona sources. In order to detect corona discharge outdoors in the daytime, it is necessary to filter the light to use only a narrow band of the UV spectrum (250–280 nanometers) where solar UV is absorbed by the atmosphere. Cameras using this technique are termed “solar-blind”. Several manufacturers, including Ofil and CoroCam, supply UV cameras for use in transmission line inspection. These are typically intended to be hand-held or mounted on a tripod. The operator will direct the camera at a potential source of corona and observe an LCD screen to determine if a UV source is present. The cameras include controls for adjusting the sensitivity and software for measuring the intensity of corona discharge by counting photon events. 3- Future Inspection of Overhead Transmission Lines