SlideShare uma empresa Scribd logo
1 de 12
Baixar para ler offline
Delamination of a strong film from a ductile substrate during
          indentation unloading

          A. Abdul-Baqi and E. Van der Giessen
          Delft University of Technology, Koiter Institute Delft, Mekelweg 2, 2628 CD Delft, The Netherlands


          (Received 23 October 2000; accepted 23 February 2001)


          In this work, a finite element method was performed to simulate the spherical
          indentation of a ductile substrate coated by a strong thin film. Our objective was to
          study indentation-induced delamination of the film from the substrate. The film was
          assumed to be linear elastic, the substrate was elastic–perfectly plastic, and the indenter
          was rigid. The interface was modeled by means of a cohesive surface. The constitutive
          law of the cohesive surface included a coupled description of normal and tagential
          failure. Cracking of the coating itself was not included. During loading, it was found
          that delamination occurs in a tangential mode rather than a normal one and was
          initiated at two to three times the contact radius. Normal delamination occurred during
          the unloading stage, where a circular part of the coating, directly under the contact
          area was lifted off from the substrate. Normal delamination was imprinted on the load
          versus displacement curve as a hump. There was critical value of the interfacial
          strength above which delamination was prevented for a given material system and a
          given indentation depth. The energy consumption by the delamination process was
          calculated and separated from the part dissipated by the substrate. The effect of
          residual stress in the film and waviness of the interface on delamination was discussed.


I. INTRODUCTION                                                      displacement curves show a reduction in the stiffness or
   Industrial application of thin hard-film-coated systems           even a sudden discontinuity which is usually attributed to
continuously progresses. Coatings are commonly used to               the coating cracking. Delamination without any accom-
enhance reliability, such as chemical resistance, wear re-           panying through-thickness cracks has been observed by
sistance, corrosion resistance, and thermal barriers. Ad-            Li and Bhushan2 in their nanoindentation experiments on
hesion between the film and the substrate determines, to             single and multilayer coatings. There is no evidence in
a great deal, the durability of that system. The enhance-            the literature, to the authors’ knowledge, whether delami-
ment gained by the coating may be accompanied by the                 nation can give rise to any characteristic fingerprint on
risk of poor adhesion between the coating and the sub-               the load versus displacement curve.
strate. Failure of the interface between the coating and                Bagchi and Evans3 have reviewed the mechanics of
the substrate may lead to premature failure of otherwise             thin film decohesion motivated by residual stress. The
long lasting systems. Indentation is one of the traditional          emphasis in their work is on the role of the interface
methods to quantify the mechanical properties of mate-               debond energy and the methods of its quantitative meas-
rials, and during the last decades it has also been advo-            urement. They argue that most thin film adhesion tests do
cated as a tool to characterize the properties of thin films         not measure the interface debond energy because the
or coatings. At the same time, for example for hard wear-            strain energy release rate cannot be deconvoluted from
resistant coatings, indentation can be viewed as an el-              the work done by the external load. Viable procedures to
ementary step of concentrated loading. For these reasons,            extract the interfacial energy from indentation experi-
many experimental as well as theoretical studies have                ments will depend strongly on the precise mechanisms
been devoted to indentation of coated systems during                 involved. The relative contribution of each mechanism to
recent years.                                                        the overall observed behavior and failure mode depends
   Interfacial delamination is commonly observed in                  on the material properties and loading conditions in a
indentation experiments to be accompanied by other                   complex manner. In the case of ductile films on a
failure phenomena, such as coating cracking and subse-               hard substrate, coating delamination is coupled to plas-
quent spalling. 1,2 The corresponding load versus                    tic expansion of the film with the driving force for

1396                      J. Mater. Res., Vol. 16, No. 5, May 2001     © 2001 Materials Research Society
A. Abdul-Baqi et al.: Delamination of a strong film from a ductile substrate during indentation unloading


delamination being delivered via buckling of the film                  II. PROBLEM FORMULATION
(see also Ref. 4). On the other hand, coatings on rela-                   The interface between the coating and the substrate is
tively ductile substrates often fail during indentation by             modeled by means of a cohesive surface, where a small
radial and in some cases circumferential cracks through                displacement jump between the film and substrate is al-
the film. The mechanics of delamination in such systems                lowed, with normal and tangential components n and
has been analyzed by Drory and Hutchinson5 for deep
                                                                         t, respectively. The interfacial behavior is specified in
indentation with depths that are 2 to 3 orders of magni-               terms of a constitutive equation for the corresponding
tude larger than the coating thickness. They have also                 traction components Tn and Tt at the same location.
reviewed briefly the commonly used test methods for                    The constitutive law we adopt in this study is an elastic
evaluating adhesion.                                                   one, so that any energy dissipation associated with sepa-
   Hainsworth et al.6 have suggested a simple model for                ration is ignored. Thus, it can be specified through a
estimating the work of interfacial debonding from the                  potential, i.e.,
maximum indentation depth and the final delamination
radius. In this model, the elastic energy of the indented
coating is approximated by the elastic energy of a cen-                                      T =−             = n, t         .              (1)
trally loaded disc. The idea has also been used in cross-
sectional indentation by Sa nchez et al. 7 as a new
                                ´
technique to characterize interfacial adhesion. The pro-               The potential reflects the physics of the adhesion be-
portionality between the delamination area and the film                tween coating and substrate. Here, we use the potential
lateral deflection predicted by the model was confirmed                that was given by Xu and Needleman9
by the experimental results.
   The objective of the present paper is to offer an im-                                                  n                      n   1−q
proved understanding of indentation-induced delamina-                           =        +        exp −        1−r+
                                                                                     n        n
                                                                                                          n                      n   r−1
tion and to test the validity of the above-mentioned
simple estimates. For this purpose, we perform a numeri-                                          r−q     n            t
                                                                                                                        2
                                                                                    − q+                      exp −                  .      (2)
cal simulation of the process of indentation of thin elastic                                      r−1     n            t
                                                                                                                         2

film on a relatively soft substrate with a small spherical
indenter. The complete cycle of the indentation process,               with n and t the normal and tangential works of
both loading and unloading, is simulated. The indenter is              separation (q      t/ n) and   n and  t two characteris-
assumed to be rigid, the film is elastic and strong, and the           tics lengths. The parameter r governs the coupling
substrate is elastic–perfectly plastic. The interface is               between normal and tangential responses. As shown in
modeled by a cohesive surface, which allows one to                     Fig. 2, both tractions are highly nonlinear functions
study initiation and propagation of delamination during                of separation with a distinct maximum of the nor-
the indentation process. Separate criteria for delamina-               mal (tangential) traction of max ( max) which occurs at
tion growth are not needed in this way. The aim of this                a separation of n          n ( t     t/√2). The normal
study is to investigate the possibility and the phenom-
enology of interfacial delamination with emphasis on the
unloading part of the indentation process and the asso-
ciated normal delamination. The interfacial failure during
the loading part has been studied by the authors in a
previous work.8 Delamination was found to occur in
a tangential mode driven by the shear stress at the inter-
face. It is initiated at a radial distance which is two or
three times the contact radius resulting in a ring-shaped
delaminated area and imprinted on the load–
displacement curve as a kind.8 In this paper we will study
the characteristics of normal delamination, conditions
for the occurrence/suppression this mode of failure, and
its fingerprint on the load–displacement curve and pro-
vide some quantitative measures about the interfacial
strength. The effect of residual stress in the film and
waviness of the interface on delamination will also be
investigated. It is emphasized that the calculations as-
sume that other failure events, mainly through-thickness
coating cracks, do not occur.                                                       FIG. 1. Geometry of the analyzed problem.

                                               J. Mater. Res., Vol. 16, No. 5, May 2001                                                    1397
A. Abdul-Baqi et al.: Delamination of a strong film from a ductile substrate during indentation unloading


                                                                                The coating is assumed to be a strong, perfectly elastic
                                                                             material with Young’s modulus Ec and Poisson’s ration
                                                                              c (subscript c for coating).
                                                                                The substrate is supposed to be a standard isotropic
                                                                             elastoplastic material with plastic flow being controlled
                                                                             by the von Mises stress. For numerical convenience,
                                                                             however, we adopt a rate-sensitive version of this model,
                                                                             expressed by

                                                                                                             3 sij . p                                n
                                                                                               .                            .p        .           e
                                                                                                   ij
                                                                                                     p
                                                                                                         =                       =        y               ,        (5)
                                                                                                             2 e                                  y

                                                                                                                         .       .       .e
                                                                             for the plastic part of the strain rate, p    ij      ij     ij.
                                                                             Here, sij are the deviator components of the Piola–
                                                                                                            .
                                                                             Kirchhoff stress ij and ij are the dual Lagran-
                                                                             gean strain-rate components. Furthermore, e
                                                                             √(3/2)sijsij is the von Mises stress, n is the rate sensitivity
                                                                                               .
                                                                             exponent, and y is a reference strain rate. In the limit of
                                                                             n → , this constitutive model reduces to the rate-
                                                                             independent von Mises plasticity with yield stress y.
                                                                             Values of n on the order of 100 are frequently used for
                                                                             metals (see e.g., Ref. 10), so that the value of e at yield
                                                                             is within a few percent of y for the strain rates that are
                                                                             encountered in our analysis. The elastic part of the strain
                                                                                   .
                                                                             rate, e , is given in terms of the Jaumann stress rate as
                                                                                     ij

                                                                                                                 ij                .e
                                                                                                                           Rijkl     kl       ,                    (6)

                                                                             with the elastic modulus tensor Rijkl being determined by
                                                                             Young’s modulus Es and Poisson’s ration s (subscript s
                                                                             for substrate).
                                                                                The problem actually solved is illustrated in Fig. 1.
FIG. 2. Normal and tangential responses according to the interfacial         The indenter is assumed rigid and to have a spherical tip
potential [Eq. (1)]: (a) normal response Tn( n ); (b) tangential response    characterized by its radius R. The film is characterized by
Tt( t). Both are normalized by their respective peak values max and
                                                                             its thickness t and is bonded to a half-infinite substrate
 max.
                                                                             by an interface specified above. Assuming both coating
                                                                             and substrate to be isotropic, the problem is axisymmet-
(tangential) work of separation, n ( t ), can now be ex-                     ric, with radial coordinate r and axial coordinate z in the
pressed in terms of the corresponding strengths max                          indentation direction. The actual calculation is carried
( max) as                                                                    out for a substrate of height L − t and radius L, but L is
                                                                             taken large enough so that the solution is independent of
                                         1                                   L and thus approaches the half-infinite substrate solution.
     n   = exp 1    max n        t   =     exp 1       max t    .    (3)        The analysis is carried out numerically using a finite
                                         2
                                                                             strain, finite element method. It uses a total Lagrangian
Using these along with the definition q = t / n, we can                      formulation in which equilibrium is expressed in terms of
relate the normal and shear strengths through                                the principle of virtual work as

                                     1
                                                                                                        dv +                       dS =                            (7)
                                             t
                   max   =                       max     .           (4)                  ij
                                                                                                   ij                  T                              ti ui ds .
                                                                                      v                           Si                              v
                             q   2 exp 1     n


The coupling parameters r and q are chosen such that the                     Here, v is the total L × L region analyzed and v is its
shear peak traction decreases with positive n and in-                        boundary, both in the undeformed configuration. With
creases with negative n [Fig. 2(b)]. More details are                        xi    (r, z, ) the coordinates in the undeformed configu-
given in Ref. 8.                                                             ration, ui and ti are the components of displacement and

1398                                                   J. Mater. Res., Vol. 16, No. 5, May 2001
A. Abdul-Baqi et al.: Delamination of a strong film from a ductile substrate during indentation unloading


traction vector, respectively. The virtual strains ij cor-                      The substrate is simply supported at the bottom, so
respond to the virtual displacement field ui via the strain                     that the remaining boundary conditions read
definition,
                                                                                              uz r, L = 0 for 0      r     L
                          1                                                                   ur 0, z = 0 for 0      z     L .         (12)
                    ij   = ui, j + uj,i + uk,iuk, j                     (8)
                          2                                                     However the size L will be chosen large enough that
where a comma denotes (covariant) differentiation with                          the solution is independent from the precise remote
respect to xi. The second term in the left-hand side of                         conditions.
Eq. (7) is the contribution of the interface, which is here
measured in the deformed configuration (Si {r|z = t}).                          III. MODEL PARAMETERS
The (true) traction transmitted across the interface has
components T , while the displacement jump is , with                                There are various material parameters that enter the
   being either the local normal direction (         n) or the                  problem, but the main ones are the interfacial normal
tangential direction (      t) in the (r, z)-plane. Here, and                   strength max, the coating thickness t, the coating
in the remainder, the axisymmetry of the problem is ex-                         Young’s modulus Ec, the maximum indentation depth
ploited, so that u      t       i
                                              0.                                hmax, and the substrate yield strength y. In the results to
                                        i
   The precise boundary conditions are also illustrated in                      be presented subsequently we focus mainly on the effect
Fig. 1. The indentation process is performed incremen-                          of the interfacial normal strength max, keeping the same
                                          .                                     value of y        1.0 GPa (with a reference strain rate of
tally with a constant indentation rate h . Outside the con-                     .
tact area with radius a in the reference configuration, the                       y    0.1 s−1 and n      100). The elastic properties are
film surface is traction free,                                                  taken to be Ec       500 GPa, c      0.33, Es     200 GPa,
                                                                                and s      0.33.
         tr(r, 0)         t z(r, 0)      0 for a     r      L    .      (9)         For the cohesive surface we have chosen the same
Inside the contact area we assume perfect sliding condi-                        values for n and t, namely 0.1 m. As in the previous
tions. The boundary conditions are specified with respect                       study,8 the coupling parameters r and q are both taken
to a rotated local frame of reference ( , , ) as shown in                       equal to 0.5 which give rise to qualitatively realistic cou-
                                                          .                     pling between normal and tangential responses of the
Fig. 1. In the normal direction, the displacement rate u
is controlled by the motion of the indenter, while in the                       interface. The values of max that have been investigated
tangential direction the traction t is set to zero; i.e.,                       vary approximately between 0.5 and 2.0 GPa. These cor-
                                                                                respond to interfacial energies for normal failure ranging
u (r, z)
˙           ˙
            hcos , t (r, z) 0 for 0 r a . (10)                                  from 150 to 600 J/m2, which are realistic values for the
                                                                                interface toughnesses of well-adhering deposited films.11
Numerical experiments using perfect sticking conditions
                                                                                Note that a constant value of q implies that the shear
instead have shown that the precise boundary condi-
                                                                                strength max always scales with the normal strength
tions only have a significant effect very close to the
                                                                                  max according to Eq. (4).
contact area and do not alter the results for delamination
                                                                                    We have used an indenter of radius R        25 m and
to be presented later. During the loading part, contact
                                                                                most of the results are for a film thickness t      2.5 m.
nodes are identified by their spatial location with respect
                                                                                Indentation as well as retraction are performed at a con-
to the indenter; simply, at a certain indentation depth h                                   .
                                                                                stant rate h     ±1 mm/s. The size L of the system ana-
and displacement increment h, the node is considered to
                                                                                lyzed (Fig. 1) is taken to be 50t. This proved to be large
be in contact if the vertical distance between the node and
                                                                                enough that the results are independent of L and therefore
the indenter is not greater than h. During the unloading
                                                                                identical to those for a coated half-infinite medium. The
part, a node is released from contact on the basis of both
                                                                                mesh is an arrangement of 12,000 quadrilateral elements
its spatial location and the force it exerts on the indenter;
                                                                                and 12,342 nodes. The elements are built up of four lin-
if the normal component of the nodal force is smaller
                                                                                ear strain triangles in a cross arrangement to minimize
than a critical value, and the vertical distance between the
                                                                                numerical problems due to plastic incompressibility. To
node and the indenter is positive, the node is released
                                                                                resolve properly the high stress gradients under the
from contact. The critical value for the nodal force is
                                                                                indenter and for an accurate detection of the contact
taken to be 1% of the average current nodal force. It
                                                                                nodes, the mesh is made very fine locally near the con-
should be noted that using a value 1 order of magnitude
                                                                                tact area with an element size of t/10.
smaller did not significantly affect the results. The in-
                                                                                    Consistent with the type of elements in the coating
dentation force F is computed from the tractions in the
                                                                                and the substrate, linear two-noded elements are used
contact region,
                                                                                along the interface. Integration of the cohesive surface
                               a                                                contribution in Eq. (7) is carried out using two-point
                     F=            t z r, 0 2 r dr    .               (11)
                              0                                                 Gauss integration. Failure, or delamination, of the

                                                          J. Mater. Res., Vol. 16, No. 5, May 2001                                     1399
A. Abdul-Baqi et al.: Delamination of a strong film from a ductile substrate during indentation unloading


interface at any location develops when    exceeds . A                   is a result of the resistance of the substrate to the film
practical definition of when a complete crack has formed                 bending in this region. It was demonstrated by the au-
is         2 .12                                                         thors8 that the normal displacement induced by this stress
   The maximum indentation depth applied in all calcu-                   will reduce the interfacial shear strength [Fig. 2(b)],
lations is hmax 2t. Further indentation can be done but                  which in turn may lead to shear delamination.
was not considered relevant since real coatings will have                   As the indenter is withdrawn, at the same rate as dur-
cracked by then and the present model is no longer                       ing loading, the elastically bent coating tends to seek its
applicable.                                                              original flat shape. For the material parameters here this
                                                                         peeling tendency induces reverse plastic flow in the sub-
                                                                         strate under the indenter. As this proceeds, the initially
IV. RESULTS AND DISCUSSION                                               compressive stress evolves into a tensile stress in the
A. Perfect interface                                                     interface directly under the initial contact region (Fig. 3).
   For the purpose of reference, we first consider a sys-                The figure also shows that the tensile area increases
tem with a perfect interface; i.e., its strength is suffi-               slowly in size during the process of unloading, and its
ciently higher than the stresses induced by the particular               final size is roughly the same as the maximum contact
loading. This can be achieved by rigidly connecting the                  radius amax.
coating to the substrate, which corresponds to taking                       To study the evolution of the tensile normal stress at
                                                                         the interface, its maximum value max is recorded to-
  max/ y →     . Of particular relevance here, is the devel-                                                      n

opment of the stress distribution along the interface dur-               gether with its position r along the interface, as shown in
ing the unloading stage and, in particular, the component                Fig. 4. In the initial stages of unloading, tension is found
normal to the interface n. From this, we can already get                 only in the ring outside the contact area (Fig. 3). Upon
qualitative insight into when and where delamination                     continued unloading, the peeling effect causes interfacial
may occur.                                                               tension to develop rapidly, Fig. 4(a), with the location of
   Figure 3 shows the normal stress at the interface at                  the maximum closely following the instantaneous con-
different instants between maximum indentation depth                     tact radius a [Fig. 4(b)]. The largest value of max    n

and complete retraction of the indenter, as specified                    2.7 GPa obtained in this particular case is reached at the
through the load F relative to the maximum indenter                      end of the unloading and located at the symmetry axis.
load. At the maximum indentation depth, the interface                       On the basis of these results, interfacial failure leading
stress is of course compressive and almost uniform over                  to normal delamination may be expected during the un-
the current contact area due to plastic flow in the sub-                 loading stage when the interfacial strength max is lower
strate. The compressive stress attains a peak value of                   than the maximum tensile stress max reached at any
                                                                                                                 n

approximately 4 GPa just outside the contact region                      moment. In the present case, normal delamination is
of radius amax. Relatively low tensile normal stresses are               avoided on the other hand if the interfacial strength max
found beyond the compressive region, at r ≈ 3amax. This                  exceeds 2.7 GPa.
                                                                            Figure 5, curve (e), shows the indentation load versus
                                                                         displacement curve for this case of a perfect interface.
                                                                         Such a curve is one of the most common outputs of
                                                                         indentation experiments. Its importance stems from the
                                                                         fact that it is a signature of the indented material system.
                                                                         Several techniques have been reported in the literature to
                                                                         extract the mechanical properties of both homogeneous
                                                                         and composite or coated materials from indentation ex-
                                                                         periments (e.g., Refs. 13–17). In the forthcoming section,
                                                                         we will therefore study the interfacial failure process in
                                                                         more detail and provide some qualitative measures of the
                                                                         interfacial strength.

                                                                         B. Finite-strength interface
                                                                            In this section, and throughout the rest of this paper,
                                                                         we will study interfaces with finite strengths to allow for
                                                                         interfacial delamination to develop. To demonstrate the
FIG. 3. Normal stress variations along a perfect interface at the be-    effect of the interfacial failure on the load–displacement
ginning of unloading (F = Fmax) until complete retrieval of the in-      data, Fig. 5 shows the predicted curves for different val-
denter (F   0).                                                          ues of interfacial strength max. The rest of the material

1400                                              J. Mater. Res., Vol. 16, No. 5, May 2001
A. Abdul-Baqi et al.: Delamination of a strong film from a ductile substrate during indentation unloading


                                                                         FIG. 5. Load versus displacement curves for several values of inter-
                                                                         facial strength max: (a) 0.55; ( b) 1.1; (c) 1.5; (d) 2.2 GPa. Curve (e)
                                                                         is for a perfect interface.


                                                                         reduction is due to shear delamination at that stage, as
                                                                         discussed in detail in Ref. 8. In all other cases shown, the
                                                                         interface strength was large enough to prevent shear de-
                                                                         lamination but not normal delamination.
                                                                            The interfacial strength above which delamination is
                                                                         prevented is found to be max           2.21 GPa (curve d in
                                                                         Fig. 5). From the results discussed above for a perfect
                                                                         interface, however, we expected delamination at even
                                                                         higher strengths, up to 2.7 GPa. The difference must be
                                                                         attributed to the fact that the cohesive surface description
                                                                         for the finite-strength interface provides additional com-
                                                                         pliance to the system even before failure. This additional
FIG. 4. (a) Evolution of the maximum normal stress max with inden-
                                                                         compliance results from the limited normal opening at
                                                    n
tation depth during unloading. (b) Corresponding location at the in-     the interface ( n < n), whereas a perfect interface, by
terface at which the stress is maximum.                                  definition, does not allow such opening. Although the
                                                                         energy consumed at the interface in this state is ex-
                                                                         tremely small, the extra compliance does give rise to a
and geometrical parameters are the same as before. In-                   small redistribution of the normal stress over the inter-
terfacial delamination during unloading was found in all                 face and a reduction of the maximum normal stress max.  n
cases shown in Fig. 5 (except case e). Compared to the                      Figure 6(a) shows a contour plot of the von Mises
perfect interface case (curve e), the initiation of delami-              effective stress at the end of the loading stage (F = Fmax)
nation is seen to result in a rather sudden reduction of the             for the case (c) in Fig. 5 with max       1.5 GPa. The size
unloading stiffness at sufficiently small F. For higher                  of the plastic zone at this depth of h 2t is about 5 times
interfacial strengths, delamination is imprinted on the                  the maximum contact radius. To illustrate the delamina-
load versus displacement curve as a hump where                           tion process, Fig. 6(b) shows a contour plot of the verti-
the stiffness becomes negative. This phenomena will be                   cal stress component zz at the end of the unloading
explained in more detail later in this section. Another                  process (F       0). The first thing to observe is that the
characteristic of delamination that can be observed in the               radius of the delaminated zone, rd, is about 50% larger
load–displacement curve is the negligible residual inden-                than the maximum contact radius amax reached during
tation depth at the end of the unloading. In the absence of              indentation. Second, we observe a region with compres-
delamination (case e), the residual indentation depth is                 sive normal stress in front of the delamination tip. This
more than half the maximum indentation depth. Curve a,                   region is the remainder of the compressive region gen-
which corresponds to the lowest max, shows a little de-                  erated during the loading stage, which has apparently
crease in the stiffness at the end of the loading stage. This            hardly changed during unloading. It thus seemed that

                                                 J. Mater. Res., Vol. 16, No. 5, May 2001                                                  1401
A. Abdul-Baqi et al.: Delamination of a strong film from a ductile substrate during indentation unloading


                                                                         FIG. 7. Evolution of the delamination radius during unloading for
                                                                         hmax    5 m and several values of max (or equivalently n).


                                                                         at a relatively high initial propagation velocity compared
                                                                                                     .
                                                                         to the indentation rate h and then reaches a lower ve-
                                                                                                    .
                                                                         locity on the order of h . The crack is stopped when it
                                                                         reaches the region with sufficiently high compressive
                                                                         stress (Fig. 6). The final delamination radius is about
                                                                         1.5 times the maximum contact area for all values of
                                                                           max. It is clear in the figure that for lower interfacial
                                                                         strengths, delamination starts earlier in the unloading
                                                                         process. On the other hand, the lower the interfacial
                                                                         strength, the lower the residual indentation depth hr (per-
                                                                         manent indentation depth left at the end of the unload-
                                                                         ing). Figure 7 reveals that residual indentation depth hr
                                                                         for several values of max 0.55 GPa. Lower interfacial
                                                                         strengths even lead to small negative residual indentation
                                                                         depths, where the coating bulges upwards at the end of
                                                                         the unloading.
                                                                             The observations indicate that delamination is the out-
                                                                         come of a complex interaction between various mecha-
FIG. 6. (a) Contour plot of the von Mises stress at the end of loading
                                                                         nisms. To get further insight into this competition,
(F = Fmax). (b) Contour plot of the stress component zz at the end of
the unloading (F 0) for max 1.5 GPa (curve c in Fig. 5). The plot        Fig. 8(a) shows the decomposition of the total energy of
also shows the delaminated region.                                       the system into interfacial energy Uin, elastic energy Uel
                                                                         (in the film and substrate), and dissipated, plastic energy
delamination was initiated under the retrieving indenter,                Upl for the case of max         1.5 GPa (curve c in Fig. 5).
expanded in the radial direction and was arrested in this                Other values of interfacial strength show the same quali-
compressive interfacial stress region.                                   tative behavior. In this particular case, delamination ini-
   The progressive development of delamination with                      tiated at h 1.5t 3.75 m. It is clear in the figure that
continued unloading is shown in Fig. 7 for several values                the plastic energy is constant at the initial stage of the
of max. It should be noted that, except for max                          unloading, i.e., the initial stage for the unloading is al-
2.2 GPa, delamination starts at a distance from the sym-                 most purely elastic. This is in agreement with what is
metry axis. For these cases rd represents the location of                commonly observed in indentation experiments Ref. 13.
the delamination tip which is traveling away from the                    Limited reverse plasticity is seen to have contributed to a
symmetry axis. Since the other tip reaches the symmetry                  little increase (less than 10%) in the plastic energy. At the
axis almost immediately, rd can be considered to a good                  onset of delamination, the plastic energy reaches a con-
approximation as the radius of the delaminated circular                  stant value. The contribution of the film and the substrate
area. In all cases shown in Fig. 7 delamination starts                   to the elastic energy is demonstrated in Fig. 8(b). The

1402                                               J. Mater. Res., Vol. 16, No. 5, May 2001
A. Abdul-Baqi et al.: Delamination of a strong film from a ductile substrate during indentation unloading


                                                                           stiffness, shown in Fig. 7, is now readily attributed to the
                                                                           spontaneous opening of the interface at the initial stage of
                                                                           delamination (Fig. 7). As explained in the previous para-
                                                                           graph and shown in Fig. 8, the processes that control the
                                                                           system during delamination are the unflexing of the coat-
                                                                           ing and the interfacial delamination. The coating evi-
                                                                           dently provides a positive contribution to the overall
                                                                           stiffness, whereas the energy release from the interface
                                                                           gives a negative contribution. This can be seen in Fig. 8,
                                                                           where the stiffness provided by each energy source is the
                                                                           curvature of the corresponding curve. For relatively
                                                                           strong interfaces, the energy release from the interface
                                                                           dominates during the first stage of delamination when the
                                                                                                                                   .
                                                                           rate of propagation, relative to the indentation rate h , is
                                                                           high. During the second stage, the process is governed by
                                                                           the unflexing of the coating, thus giving rise to a positive
                                                                           overall stiffness (note that the coating response is con-
                                                                           strained by the indenter which is withdrawn at a given
                                                                           rate). It is this complex interplay between these two
                                                                           terms which shapes the overall behavior of the system,
                                                                           including the load–displacement curve.

                                                                           C. Comparison with a simple estimate
                                                                              Deduction of quantitative information about the inter-
                                                                           facial strength from indentation experiments, in particu-
                                                                           lar from load–displacement curves and delamination
                                                                           areas, is hindered by the rather complicated interplay
                                                                           between the film elastic energy and the interfacial en-
                                                                           ergy. A simple estimate for the work of interfacial
                                                                           debonding from final delamination results has been given
                                                                           by Hainsworth et al.6 This estimate is based on an energy
                                                                           balance involving the interfacial energy and the elastic
FIG. 8. (a) Decomposition of total energy into interfacial energy (Uin),
                                                                           energy in the coating (the elastic energy in the substrate
elastic energy (Uel), and plastic energy (Upl ). (b) Contribution of the
film and substrate to the elastic energy. In (a) and (b) max 1.5 GPa,      is neglected). The latter is approximated by the elastic
the normalization constant is Umax ∫hmaxF dh, and the vertical dashed
                                        0
                                                                           energy of a centrally loaded disc of radius rd with
lines identify the initiation of delamination.                             clamped edges. On the basis of this model, the interfacial
                                                                           work of separation is estimated by
elastic energy of the substrate is seen to decrease more
rapidly compared to the elastic energy of the film at the                                                2Ect 3 hmax2 − hr2
initial stage of the unloading. This is in agreement with
                                                                                               est
                                                                                               n     =              2
                                                                                                                               ,   (13)
                                                                                                           31      c    rd4
what is reported in the literature that the initial stiffness
of the unloading is predominantly controlled by the sub-                   in terms of directly measurable quantities.
strate for indentation depths larger than the film thick-                     As the model shows a strong dependence on the coat-
ness.13–17 At the onset of delamination, the substrate                     ing thickness t and the maximum indentation depth hmax,
elastic energy reaches a constant value, whereas the                       we have chosen to vary these two parameters over a
film elastic energy decreases as the film unbends. This                    certain range and compare the model predictions with
indicates that the main contribution to the energy release,                our FEM findings. A set of calculations using a conical
and hence the advance of delamination, come from the                       indenter with a 68° semiangle is also performed to ex-
film. It is also interesting to notice that, at the end of                 amine the model’s sensitivity to the indenter’s geometry
the unloading, there still exists some elastic energy in the               which is not captured by Eq. (13).
system. This energy is small compared to the dissipated                       Despite its very approximate nature, Eq. (13) does
energy (plastic energy), but when compared with the in-                    capture some of the qualitative trends, as shown in Fig. 9.
terfacial energy, Uin, it seems to have a significant value.               For instance, one expects from (13) that rd2 hmax for a
   On the basis of the above observations, the unstable                    given interfacial strength (or energy) and coating prop-
part of the load–displacement curves, with negative                        erties (and neglecting the residual indentation depth).

                                                    J. Mater. Res., Vol. 16, No. 5, May 2001                                       1403
A. Abdul-Baqi et al.: Delamination of a strong film from a ductile substrate during indentation unloading


The results of a series computations for two different                     The more serious limitation of Eq. (13) is that the in-
strengths are summarized in Fig. 9(a) and are seen to be                terfacial energy estimated from the numerical results do
consistent with this scaling. The conical indenter results              not agree quantitatively with the actual energies. As dem-
presented in the figure show the same trend. Sanchez  ´                 onstrated in Tables I–III, the interfacial energies are se-
et al.7 have used Eq. (13) and a modified version of it on              verely overestimated. In Table I we notice that the higher
their cross-sectional indentation data, and they have also              the maximum indentation depth, the better the estimate.
confirmed the linear relation between the delamination                  This can be understood by recalling that the model is
area and the maximum deflection of the coating. Second,                 based on the expression for the deflection of a clamped
according to (13), rd4/3 is proportional to t, with all other           disc loaded at the center,18 where the deformation is
quantities being the same. Our results, shown in Fig. 9(b)              assumed to be pure bending. The contribution of the
are consistent with this as well. Finally, over the range of            stretching is ignored; this is reasonable when the radius
Ec       350–600 GPa, the proportionality between rd4                   of the disc is large compared to its thickness. In the
and Ec is also found to be consistent with the prediction               case of indentation, this condition is analogous to contact
of Eq. (13).                                                            radius (or maximum indentation depth) being larger than
   However, not all trends are correct. For example,                    the film thickness. This explains the better estimation at
Eq. (13) predicts a lower slope for the delamination area               larger maximum indentation depths. This trend is also
versus h max curve for higher values of interfacial                     observed for the conical indenter in Table II, but the
strength, whereas the FEM results presented in Fig.9(a)                 quality of the estimate here is even worse. The reason is
show the opposite tendency.                                             that the cone produces more stretching of the film than
                                                                        the sphere, resulting in less accuracy of the model. In
                                                                        Table III, the smaller the coating thickness, the better the
                                                                        estimate according to Eq. (13). The same explanation


                                                                        TABLE I. Estimates for n from Eq. (13) on the basis of the com-
                                                                        puted values hr and rd for t  2.5 m and several values of hmax. The
                                                                        actual value is n     500 J/m2.
                                                                                                                                      est
                                                                        hmax ( m)             hr ( m)             rd ( m)             n /   n

                                                                           2.5                 0.79                 8.14             15.02
                                                                           3.0                 0.67                10.62              7.86
                                                                           3.5                 0.64                12.25              6.15
                                                                           4.0                 0.64                13.61              5.32
                                                                           4.5                 0.63                14.82              4.82
                                                                           5.0                 0.63                15.94              4.46


                                                                        TABLE II. Same as in Table I but for a conical indenter.
                                                                                                                                      est
                                                                        hmax ( m)             hr ( m)             rd ( m)             n /   n

                                                                           2.5                 0.43                 4.75            139.34
                                                                           3.0                 0.42                 6.49             58.24
                                                                           3.5                 0.43                 7.81             37.92
                                                                           4.0                 0.45                 9.03             27.84
                                                                           4.5                 0.47                10.24             21.32
                                                                           5.0                 0.49                11.45             16.86


                                                                        TABLE III. Estimates for n from E8. (13) on the basis of the com-
                                                                        puted values of hr and rd for hmax 5 m and several values of t. The
                                                                        actual value is n      500 J/m2.
                                                                                                                                      est
                                                                        t ( m)             hr ( m)              rd ( m)               n /   n

                                                                         2.5                 0.63                 15.94               4.46
                                                                         3.0                 0.58                 16.59               6.58
                                                                         3.5                 0.56                 17.23               9.00
                                                                         4.0                 0.54                 17.84              11.69
                                                                         4.5                 0.54                 18.43              14.62
FIG. 9. (a) Delamination area rd2 versus the maximum indentation         5.0                 0.54                 19.00              17.75
depth hmax. (b) rd4/3 versus coating thickness t.

1404                                            J. Mater. Res., Vol. 16, No. 5, May 2001
A. Abdul-Baqi et al.: Delamination of a strong film from a ductile substrate during indentation unloading


holds here too. Evidently, the assumption that the disc is
clamped at its boundary in questionable. If it is assumed
that the disc is simply supported, the expression for est n
in Eq. 13 must be multiplied by (1 + c)/(3 + c).
This will give better estimates, but large errors are still
possible.
   Note that Eq. 13 does not incorporate the influence of
the substrate. To see the accuracy of this approximation,
we have investigated the dependence of the delamination
radius rd on the substrate properties Es and y. Varying
the substrate Young’s modulus Es from 100 to 500 GPa,
the resulting delamination radius increases with Es by
25%. On the other hand, an increase of the yield stress y
from 0.72 to 2.0 GPa gives values of rd that decrease by
only 6%. The reason for this is that the yield stress de-
termines the size of the plastic zone in the substrate but
not the permanent deformation immediately below the                    FIG. 10. Load– displacement curves for several values of hmax, for a
indenter; the latter is what is controlling the delamination           coating strength of max   1.85 GPa.
radius. However, it should be noted, as will be discussed
in the next section, that the yield stress plays a major
                                                                          For values of hmax less than the coating thickness (t
role in determining whether delamination will take
                                                                       2.5 m), c      max shows a relatively rapid increase,
place at all.
                                                                       Fig. 11(a). This increase is attributed to the increase in
D. Critical value of interfacial strength                              the bending moment in the coating. The bending moment
for delamination                                                       is proportional to the curvature of the coating which in-
                                                                       creases rapidly with the indentation depth until the coat-
    Whether or not delamination takes place depends on
                                                                       ing takes the shape of the indenter. After that point, the
the tensile normal stress that can be generated at the
                                                                       curvature does not change much but the bent region
interface during the unloading process. The ultimate
                                                                       propagates outward, and this corresponds to the slower
value of this stress relative to the interface strength max
                                                                       increase in c     max for higher indentation depths.
depends on almost all parameters involved in the bound-
                                                                       Figure 11(b) shows also an initial rapid increase in
ary value problem in a rather complex way. We have
                                                                       the critical strength with the coating thickness due to the
performed a parameter study involving the coating elas-
                                                                       increase of the bending moment with t3. For thicker coat-
tic modulus, the substrate yield stress, the maximum in-
                                                                       ings, the critical strength decreases due to the decrease in
dentation depth, and the coating thickness. For each
                                                                       the coating curvature because the substrate becomes rela-
parameter combination, delamination is suppressed if the
                                                                       tively softer. Figure 11(c) shows an almost linear in-
interfacial strength is higher than a critical value of c .
                                                        max
                                                                       crease of the critical strength with the coating Young’s
    As an example, Fig. 10 shows load–displacement
                                                                       modulus. The increase of the critical strength with the
curves for different values of maximum indentation
                                                                       substrate yield stress y is shown in Fig. 11(d). This in-
depths. Delamination is seen to occur if hmax is above a
                                                                       crease is caused by the reverse plasticity that takes place
certain critical value, and it is recognized by the hump
                                                                       prior to delamination (Fig. 8). The higher the yield stress,
left on the curve and the negligible residual indentation
                                                                       the higher the stresses which can be reached at the sub-
depth. Lower indentation depths do not create normal
                                                                       strate. Since the normal stress is continuous across the
stresses that exceed the interfacial strength max and,
                                                                       interface, higher tensile normal stress can be reached
therefore, do not lead to delamination.
                                                                       with increasing y, thus making it possible to delaminate
    Figure 11 shows the variation of the critical strength
  c                                                                    stronger interfaces.
  max with (a) the maximum indentation depth, (b) the
coating thickness, (c) the coating Young’s modulus, and
(d) the substrate yield stress. Higher values of the coating           E. Residual stresses and interfacial waviness
Young’s modulus Ec, the coating thickness t 3, or the                     Coated systems generally contain residual stresses.
maximum indentation depth hmax lead to delamination of                 These are due to the deposition process itself, to the
stronger interfaces. These are explained by the fact that              thermal expansion mismatch between the coating and
the driving force for delamination is the unbending of the             the substrate, or a combination of the two. To study the
coating. Despite the limitations of the circular disc model            influence of residual stresses on delamination, we
pointed out before, these trends are roughly consistent                have introduced uniform in-plane stress in the film prior
with Eq. (13) but not when looked at in more detail.                   to indentation. This has been achieved, for numerical

                                               J. Mater. Res., Vol. 16, No. 5, May 2001                                              1405
A. Abdul-Baqi et al.: Delamination of a strong film from a ductile substrate during indentation unloading


                                                                          c
                    FIG. 11. Critical value of the interfacial strength   max   versus (a) hmax, (b) t, (c) Ec, and (d)   y.


convenience, by assigning different thermal expansion                     valleys and crests where the normal stress component has
coefficients to coating and substrate and by subjecting                   a local maximum. Neighboring delaminated areas link up
the system to various temperature changes to generate                     before the delamination front propagates to the next
stresses ranging from −10 GPa (compressive) to 10 GPa                     crest/valley. Even though the precise evolution of de-
(tensile). Subsequently, we perform the indentation cal-                  lamination depends on the waviness of the interface, for
culations as before.
   Compressive stress in the coating is found to delay the
delamination process, or to even prevent delamination,
whereas the opposite happens with tensile stresses. This
is explained by the fact that residual stress will have an
out-of-plane component after the deformation of the
coating. In the case of tensile stress, this component will
tend to enhance the unbending of coating during the un-
loading and, thus, will assist delamination. As a conse-
quence, the critical strength to prevent delamination will
increase with residual tension in the coating. Compres-
sive stress has the opposite effect. For example, a coating
of the default thickness of t     2.5 m with a interfacial
strength of max        1.84 GPa was found earlier to de-
laminate after indentation to h max             5 m [see
Fig. 11(a)], but delamination is prevented under a re-
sidual stress of −10 GPa. The delamination radius rd is
relatively insensitive to the residual stress: over a range
of −7.5 to 10 GPa, rd varies between 14.4 and 16.7 m
compared to rd       15.94 m for the stress-free coating
(cf. Table I).
   Roughness of the interface is commonly simplified by
a sinusoidal wave (e.g., Ref. 19). To study the effect of
                                                                          FIG. 12. Example of normal delamination for a case with a rough
roughness on delamination, a wave of an amplitude up to                   interface, modeled as a sinusoidal wave with an amplitude of 0.12t and
0.2t and a wavelength up to 2t were introduced along the                  a wavelength equal to t. In this case, hmax       5 m and max
interface; see Fig. 12. Delamination is found to start at                 1.85 GPa.

1406                                            J. Mater. Res., Vol. 16, No. 5, May 2001
A. Abdul-Baqi et al.: Delamination of a strong film from a ductile substrate during indentation unloading


all cases considered here we did not find a significant                   The disc model estimate6 has been compared with our
effect on the critical indentation depth at which delami-              numerical findings for a range of parameters. It does
nation starts nor on the final delamination radius.                    capture some of the qualitative aspects of delamination.
                                                                       But, it tends to strongly overestimate the interfacial
                                                                       strength or energy of separation.
V. CONCLUSIONS                                                            Critical values of the interfacial strength were calcu-
   For the purpose of studying interfacial delamination,               lated for several parameter combinations. The general
numerical simulations have been carried out of the in-                 trends of the variation of these critical values with the
dentation process of a coated material by a spherical                  involved parameters are easily interpreted, whereas
indenter. To describe interfacial failure, the interface be-           the details of this variation are governed by the nonlinear
tween the film and the substrate was modeled by means                  nature of the problem.
of a cohesive surface, with a coupled constitutive law for                Compressive residual stress in the film delays delami-
the normal and the tangential response. Failure of the                 nation, and if high enough, it might even prevent
interface by normal or tangential separation, or a combi-              delamination, whereas tensile residual stress has an op-
nation, is embedded in the constitutive model and does                 posite effect. Waviness of the interface was not found to
not require any additional criteria.                                   have a significant effect on delamination. Both conclu-
   Normal delamination occurs during the unloading                     sions, however, are intimately tied to the assumption that
stage of the indentation process. A circular part of the               the coating remains intact during indentation.
coating, directly under the contact area, is lifted off from
the substrate, driven by the bending moment in the coat-
ing. Normal delamination is recognized by the imprint                  REFERENCES
left on the load versus displacement curve and the neg-                 1.   M.D. Kriese and W.W. Gerberich, J. Mater. Res. 14, 3019 (1999).
ligible residual indentation depth. For any given inden-                2.   X. Li and B. Bhushan, Thin Solid Films 315, 214 (1998).
tation depth, the normal stress that can be attained at the             3.   A. Bagchi and A.G. Evans, Interface Sci. 3, 169 (1996).
interface is larger for thicker coatings, for coatings with             4.   B.D. Marshall and A.G. Evans, J. Appl. Phys. 56, 2632 (1984).
                                                                        5.   M.D. Drory and J.W. Hutchinson, Proc. R. Soc. London, Ser. A
a higher Young’s modulus, or for substrates with a higher                    452, 2319 (1996).
yield strength. To prevent delamination of such coatings,               6.   S.V. Hainsworth, M.R. McGurk, and T.F. Page, Surf. Coat. Tech-
stronger interfaces are necessary.                                           nol. 102, 97 (1998).
   It should be noted that shear delamination can occur                 7.   J.M. Sa nchez, S. El-Mansy, B. Sun, T. Scherban, N. Fang,
                                                                                     ´
during indentation, before normal delamination takes                         D. Pantsuo, W. Ford, M.R. Elizalde, J.M. Martınez-Esnaola,
                                                                                                                                ´
                                                                             A. Martın-Meizoso, J. Gil-Sevillano, M. Fuentes, and J. Maiz,
                                                                                      ´
place. Compared to normal delamination, shear delami-                        Acta Mater. 47, 4405 (1999).
nation can occur for relatively low interfacial strength.               8.   A. Abdul-Baqi and E. Van der Giessen, Thin Solid Films 381, 143
Conversely, if the interface strength is high enough to                      (2001).
prevent normal delamination, shear delamination will                    9.   X-P. Xu and A. Needleman, Model. Simul. Mater. Sci. Eng. 1,
also be avoided.                                                             111 (1993).
                                                                       10.   R. Becker, A. Needleman, O. Richmond, and V. Tvergaard,
   The energy consumed by the delamination process has                       J. Mech. Phys. Solids 36, 317 (1988).
been explicitly calculated and separated from the part                 11.   Y. Wei and J.W. Hutchinson, Int. J. Fract. 10, (1999).
dissipated by plastic deformation in the substrate. A                  12.   X-P. Xu and A. Needleman, J. Mech. Phys. Solids 42, 1397
small amount of elastic energy, but still comparable with                    (1994).
the total interfacial energy, is left in the system after              13.   M. Doerner and W. Nix, J. Mater. Res. 4, 601 (1986).
                                                                       14.   A.K. Bhattacharya and W.D. Nix, Int. J. Solids Struct. 24, 1287
unloading. Delamination is driven by the coating energy                      (1988).
as it unflexes to retain its initial configuration. Deduction          15.   H. Gao, C-H. Chiu, and J. Lee, Int. J. Solids Struct. 29, 2471
of quantitative information about the interfacial work of                    (1992).
separation or strength is hindered by the complex inter-               16.   R.B. King, Int. J. Solids Struct. 23, 1657 (1987).
play between the coating elastic energy and the interfa-               17.   Y.Y. Lim, M.M. Chaudhri, and Y. Enomoto, J. Mater. Res. 14,
                                                                             2314 (1999).
cial energy. However, the present model does allow for                 18.   S. Timoshinko and S. Woinowsky-Krieger, Theory of Plates and
an inverse approach by which the work of separation can                      Shells, 2nd ed. (McGraw-Hill, New York, 1959).
be derived iteratively.                                                19.   D.R. Clarke and W. Pompe, Acta Mater. 47, 1749 (1999).


                                               J. Mater. Res., Vol. 16, No. 5, May 2001                                                1407

Mais conteúdo relacionado

Mais procurados

Nanomechanical Characterization of CdSe QD-Polymer Nanocomposites
Nanomechanical Characterization of CdSe QD-Polymer NanocompositesNanomechanical Characterization of CdSe QD-Polymer Nanocomposites
Nanomechanical Characterization of CdSe QD-Polymer Nanocompositescurtistaylor80
 
ASME2011 - Ahmetv8.pptx
ASME2011 - Ahmetv8.pptxASME2011 - Ahmetv8.pptx
ASME2011 - Ahmetv8.pptxAhmet Cecen
 
Verification of dynamic relaxation (dr) method in isotropic, orthotropic and ...
Verification of dynamic relaxation (dr) method in isotropic, orthotropic and ...Verification of dynamic relaxation (dr) method in isotropic, orthotropic and ...
Verification of dynamic relaxation (dr) method in isotropic, orthotropic and ...Osama Mohammed Elmardi Suleiman
 
Dr.R.Narayanasamy - Plastic instability in uniaxial tension
Dr.R.Narayanasamy - Plastic instability in uniaxial tensionDr.R.Narayanasamy - Plastic instability in uniaxial tension
Dr.R.Narayanasamy - Plastic instability in uniaxial tensionDr.Ramaswamy Narayanasamy
 
FRACTURE MECHANICS OF NANO-SILICA PARTICLES IN REINFORCED EPOXIES
FRACTURE MECHANICS OF NANO-SILICA PARTICLES IN REINFORCED EPOXIES  FRACTURE MECHANICS OF NANO-SILICA PARTICLES IN REINFORCED EPOXIES
FRACTURE MECHANICS OF NANO-SILICA PARTICLES IN REINFORCED EPOXIES Jordan Suls
 
Asphalt internal structure characterization with X-Ray computed tomography
Asphalt internal structure characterization with X-Ray computed tomographyAsphalt internal structure characterization with X-Ray computed tomography
Asphalt internal structure characterization with X-Ray computed tomographyVSG - Visualization Sciences Group
 
simulation of fatigue damage in solder joints using cohesive zones
simulation of fatigue damage in solder joints using cohesive zonessimulation of fatigue damage in solder joints using cohesive zones
simulation of fatigue damage in solder joints using cohesive zonesDr. Adnan Judeh (Abdul-Baqi)
 
Standard_Test_Method_for_Microindentatio.pdf
Standard_Test_Method_for_Microindentatio.pdfStandard_Test_Method_for_Microindentatio.pdf
Standard_Test_Method_for_Microindentatio.pdfCharitha Ranwala ,CSWP
 
P57600 Lusas Report
P57600 Lusas ReportP57600 Lusas Report
P57600 Lusas Reportarmada7000
 
Lecture: Mechanical Properties: Macro Viewpoint
Lecture: Mechanical Properties: Macro ViewpointLecture: Mechanical Properties: Macro Viewpoint
Lecture: Mechanical Properties: Macro ViewpointNikolai Priezjev
 
Understanding Permeability of Hydraulic Fracture Networks A Sandbox Analog Mo...
Understanding Permeability of Hydraulic Fracture Networks A Sandbox Analog Mo...Understanding Permeability of Hydraulic Fracture Networks A Sandbox Analog Mo...
Understanding Permeability of Hydraulic Fracture Networks A Sandbox Analog Mo...Renee Heldman
 
AN APPROACH TO OPTIMIZE OF MANUFACTURING OF A VOLTAGE REFERENCE BASED ON HETE...
AN APPROACH TO OPTIMIZE OF MANUFACTURING OF A VOLTAGE REFERENCE BASED ON HETE...AN APPROACH TO OPTIMIZE OF MANUFACTURING OF A VOLTAGE REFERENCE BASED ON HETE...
AN APPROACH TO OPTIMIZE OF MANUFACTURING OF A VOLTAGE REFERENCE BASED ON HETE...JaresJournal
 

Mais procurados (19)

merarils
merarilsmerarils
merarils
 
Nanomechanical Characterization of CdSe QD-Polymer Nanocomposites
Nanomechanical Characterization of CdSe QD-Polymer NanocompositesNanomechanical Characterization of CdSe QD-Polymer Nanocomposites
Nanomechanical Characterization of CdSe QD-Polymer Nanocomposites
 
Fd2610821087
Fd2610821087Fd2610821087
Fd2610821087
 
2
22
2
 
ASME2011 - Ahmetv8.pptx
ASME2011 - Ahmetv8.pptxASME2011 - Ahmetv8.pptx
ASME2011 - Ahmetv8.pptx
 
Verification of dynamic relaxation (dr) method in isotropic, orthotropic and ...
Verification of dynamic relaxation (dr) method in isotropic, orthotropic and ...Verification of dynamic relaxation (dr) method in isotropic, orthotropic and ...
Verification of dynamic relaxation (dr) method in isotropic, orthotropic and ...
 
Dr.R.Narayanasamy - Plastic instability in uniaxial tension
Dr.R.Narayanasamy - Plastic instability in uniaxial tensionDr.R.Narayanasamy - Plastic instability in uniaxial tension
Dr.R.Narayanasamy - Plastic instability in uniaxial tension
 
3.014 Poster
3.014 Poster3.014 Poster
3.014 Poster
 
FRACTURE MECHANICS OF NANO-SILICA PARTICLES IN REINFORCED EPOXIES
FRACTURE MECHANICS OF NANO-SILICA PARTICLES IN REINFORCED EPOXIES  FRACTURE MECHANICS OF NANO-SILICA PARTICLES IN REINFORCED EPOXIES
FRACTURE MECHANICS OF NANO-SILICA PARTICLES IN REINFORCED EPOXIES
 
Asphalt internal structure characterization with X-Ray computed tomography
Asphalt internal structure characterization with X-Ray computed tomographyAsphalt internal structure characterization with X-Ray computed tomography
Asphalt internal structure characterization with X-Ray computed tomography
 
simulation of fatigue damage in solder joints using cohesive zones
simulation of fatigue damage in solder joints using cohesive zonessimulation of fatigue damage in solder joints using cohesive zones
simulation of fatigue damage in solder joints using cohesive zones
 
E04701035045
E04701035045E04701035045
E04701035045
 
2013_TMAG_v49_p3588
2013_TMAG_v49_p35882013_TMAG_v49_p3588
2013_TMAG_v49_p3588
 
Standard_Test_Method_for_Microindentatio.pdf
Standard_Test_Method_for_Microindentatio.pdfStandard_Test_Method_for_Microindentatio.pdf
Standard_Test_Method_for_Microindentatio.pdf
 
Numerical Simulations of the Bond Stress-Slip Effect of Reinforced Concrete o...
Numerical Simulations of the Bond Stress-Slip Effect of Reinforced Concrete o...Numerical Simulations of the Bond Stress-Slip Effect of Reinforced Concrete o...
Numerical Simulations of the Bond Stress-Slip Effect of Reinforced Concrete o...
 
P57600 Lusas Report
P57600 Lusas ReportP57600 Lusas Report
P57600 Lusas Report
 
Lecture: Mechanical Properties: Macro Viewpoint
Lecture: Mechanical Properties: Macro ViewpointLecture: Mechanical Properties: Macro Viewpoint
Lecture: Mechanical Properties: Macro Viewpoint
 
Understanding Permeability of Hydraulic Fracture Networks A Sandbox Analog Mo...
Understanding Permeability of Hydraulic Fracture Networks A Sandbox Analog Mo...Understanding Permeability of Hydraulic Fracture Networks A Sandbox Analog Mo...
Understanding Permeability of Hydraulic Fracture Networks A Sandbox Analog Mo...
 
AN APPROACH TO OPTIMIZE OF MANUFACTURING OF A VOLTAGE REFERENCE BASED ON HETE...
AN APPROACH TO OPTIMIZE OF MANUFACTURING OF A VOLTAGE REFERENCE BASED ON HETE...AN APPROACH TO OPTIMIZE OF MANUFACTURING OF A VOLTAGE REFERENCE BASED ON HETE...
AN APPROACH TO OPTIMIZE OF MANUFACTURING OF A VOLTAGE REFERENCE BASED ON HETE...
 

Destaque

M.Sc. Thesis - Atomic Physics Aspects of Radiation Physics
M.Sc. Thesis - Atomic Physics Aspects of Radiation PhysicsM.Sc. Thesis - Atomic Physics Aspects of Radiation Physics
M.Sc. Thesis - Atomic Physics Aspects of Radiation PhysicsDr. Adnan Judeh (Abdul-Baqi)
 
Environment Quality Authority (EQA) standards and regulations for monitoring ...
Environment Quality Authority (EQA) standards and regulations for monitoring ...Environment Quality Authority (EQA) standards and regulations for monitoring ...
Environment Quality Authority (EQA) standards and regulations for monitoring ...Dr. Adnan Judeh (Abdul-Baqi)
 
Many electrons atoms_2012.12.04 (PDF with links
Many electrons atoms_2012.12.04 (PDF with linksMany electrons atoms_2012.12.04 (PDF with links
Many electrons atoms_2012.12.04 (PDF with linksLadislav Kocbach
 
Radiation emitted from Israeli mobile base-stations
Radiation emitted from Israeli mobile base-stationsRadiation emitted from Israeli mobile base-stations
Radiation emitted from Israeli mobile base-stationsDr. Adnan Judeh (Abdul-Baqi)
 
Radiation emitted from Israeli mobile base-stations (in Arabic with English a...
Radiation emitted from Israeli mobile base-stations (in Arabic with English a...Radiation emitted from Israeli mobile base-stations (in Arabic with English a...
Radiation emitted from Israeli mobile base-stations (in Arabic with English a...Dr. Adnan Judeh (Abdul-Baqi)
 
Ph.D. Thesis - Failure of Brittle Coatings on Ductile Metallic Substrates
Ph.D. Thesis - Failure of Brittle Coatings on Ductile Metallic SubstratesPh.D. Thesis - Failure of Brittle Coatings on Ductile Metallic Substrates
Ph.D. Thesis - Failure of Brittle Coatings on Ductile Metallic SubstratesDr. Adnan Judeh (Abdul-Baqi)
 

Destaque (10)

Delamination of thin strong film - poster
Delamination of thin strong film  - posterDelamination of thin strong film  - poster
Delamination of thin strong film - poster
 
M.Sc. Thesis - Atomic Physics Aspects of Radiation Physics
M.Sc. Thesis - Atomic Physics Aspects of Radiation PhysicsM.Sc. Thesis - Atomic Physics Aspects of Radiation Physics
M.Sc. Thesis - Atomic Physics Aspects of Radiation Physics
 
Environment Quality Authority (EQA) standards and regulations for monitoring ...
Environment Quality Authority (EQA) standards and regulations for monitoring ...Environment Quality Authority (EQA) standards and regulations for monitoring ...
Environment Quality Authority (EQA) standards and regulations for monitoring ...
 
Indentation induced failure - poster
Indentation induced failure - posterIndentation induced failure - poster
Indentation induced failure - poster
 
Fatigue damage - poster
Fatigue damage - posterFatigue damage - poster
Fatigue damage - poster
 
Many electrons atoms_2012.12.04 (PDF with links
Many electrons atoms_2012.12.04 (PDF with linksMany electrons atoms_2012.12.04 (PDF with links
Many electrons atoms_2012.12.04 (PDF with links
 
Guidlines of the ICNIRP on radiowaves
Guidlines of the ICNIRP on radiowavesGuidlines of the ICNIRP on radiowaves
Guidlines of the ICNIRP on radiowaves
 
Radiation emitted from Israeli mobile base-stations
Radiation emitted from Israeli mobile base-stationsRadiation emitted from Israeli mobile base-stations
Radiation emitted from Israeli mobile base-stations
 
Radiation emitted from Israeli mobile base-stations (in Arabic with English a...
Radiation emitted from Israeli mobile base-stations (in Arabic with English a...Radiation emitted from Israeli mobile base-stations (in Arabic with English a...
Radiation emitted from Israeli mobile base-stations (in Arabic with English a...
 
Ph.D. Thesis - Failure of Brittle Coatings on Ductile Metallic Substrates
Ph.D. Thesis - Failure of Brittle Coatings on Ductile Metallic SubstratesPh.D. Thesis - Failure of Brittle Coatings on Ductile Metallic Substrates
Ph.D. Thesis - Failure of Brittle Coatings on Ductile Metallic Substrates
 

Semelhante a delamination of a strong film from a ductile substrate during indentation unloading

numerical analysis of indentation-induced cracking of brittle coatings on duc...
numerical analysis of indentation-induced cracking of brittle coatings on duc...numerical analysis of indentation-induced cracking of brittle coatings on duc...
numerical analysis of indentation-induced cracking of brittle coatings on duc...Dr. Adnan Judeh (Abdul-Baqi)
 
Adhesion in fabrication and operation
Adhesion in fabrication and operationAdhesion in fabrication and operation
Adhesion in fabrication and operationAntoine Galand
 
Iwashita - Laminated conductor structure for rf in normal conducting case
Iwashita - Laminated conductor structure for rf in normal conducting caseIwashita - Laminated conductor structure for rf in normal conducting case
Iwashita - Laminated conductor structure for rf in normal conducting casethinfilmsworkshop
 
TRANSIENT ANALYSIS OF PIEZOLAMINATED COMPOSITE PLATES USING HSDT
TRANSIENT ANALYSIS OF PIEZOLAMINATED COMPOSITE PLATES USING HSDTTRANSIENT ANALYSIS OF PIEZOLAMINATED COMPOSITE PLATES USING HSDT
TRANSIENT ANALYSIS OF PIEZOLAMINATED COMPOSITE PLATES USING HSDTP singh
 
Magnetic Properties and Interactions of Nanostructured CoCrTa Thin Films
Magnetic Properties and Interactions of Nanostructured CoCrTa Thin FilmsMagnetic Properties and Interactions of Nanostructured CoCrTa Thin Films
Magnetic Properties and Interactions of Nanostructured CoCrTa Thin FilmsIOSR Journals
 
Fracture_Toughness_For _Print
Fracture_Toughness_For _PrintFracture_Toughness_For _Print
Fracture_Toughness_For _PrintArun Agrawal
 
Effects of-lamination-packs-in-induction-heating-work-coil-design-by-the-supe...
Effects of-lamination-packs-in-induction-heating-work-coil-design-by-the-supe...Effects of-lamination-packs-in-induction-heating-work-coil-design-by-the-supe...
Effects of-lamination-packs-in-induction-heating-work-coil-design-by-the-supe...Clerk Lolo
 
Tests of Graphite Polyimide Sandwich Panels Camarda
Tests of Graphite Polyimide Sandwich Panels CamardaTests of Graphite Polyimide Sandwich Panels Camarda
Tests of Graphite Polyimide Sandwich Panels CamardaCharles Camarda
 
ThomasPorkka_ResearchReport_RETREAT
ThomasPorkka_ResearchReport_RETREATThomasPorkka_ResearchReport_RETREAT
ThomasPorkka_ResearchReport_RETREATThomas Porkka
 
RESULTS OF FINITE ELEMENT ANALYSIS FOR INTERLAMINAR FRACTURE REINFORCED THERM...
RESULTS OF FINITE ELEMENT ANALYSIS FOR INTERLAMINAR FRACTURE REINFORCED THERM...RESULTS OF FINITE ELEMENT ANALYSIS FOR INTERLAMINAR FRACTURE REINFORCED THERM...
RESULTS OF FINITE ELEMENT ANALYSIS FOR INTERLAMINAR FRACTURE REINFORCED THERM...msejjournal
 
RESULTS OF FINITE ELEMENT ANALYSIS FOR INTERLAMINAR FRACTURE REINFORCED THERM...
RESULTS OF FINITE ELEMENT ANALYSIS FOR INTERLAMINAR FRACTURE REINFORCED THERM...RESULTS OF FINITE ELEMENT ANALYSIS FOR INTERLAMINAR FRACTURE REINFORCED THERM...
RESULTS OF FINITE ELEMENT ANALYSIS FOR INTERLAMINAR FRACTURE REINFORCED THERM...MSEJjournal1
 
RESULTS OF FINITE ELEMENT ANALYSIS FOR INTERLAMINAR FRACTURE REINFORCED THERM...
RESULTS OF FINITE ELEMENT ANALYSIS FOR INTERLAMINAR FRACTURE REINFORCED THERM...RESULTS OF FINITE ELEMENT ANALYSIS FOR INTERLAMINAR FRACTURE REINFORCED THERM...
RESULTS OF FINITE ELEMENT ANALYSIS FOR INTERLAMINAR FRACTURE REINFORCED THERM...msejjournal
 
RESULTS OF FINITE ELEMENT ANALYSIS FOR INTERLAMINAR FRACTURE REINFORCED THERM...
RESULTS OF FINITE ELEMENT ANALYSIS FOR INTERLAMINAR FRACTURE REINFORCED THERM...RESULTS OF FINITE ELEMENT ANALYSIS FOR INTERLAMINAR FRACTURE REINFORCED THERM...
RESULTS OF FINITE ELEMENT ANALYSIS FOR INTERLAMINAR FRACTURE REINFORCED THERM...msejjournal
 
Generalised_formulation_of_laminate_theory_using_beam_fe_for_delaminated_comp...
Generalised_formulation_of_laminate_theory_using_beam_fe_for_delaminated_comp...Generalised_formulation_of_laminate_theory_using_beam_fe_for_delaminated_comp...
Generalised_formulation_of_laminate_theory_using_beam_fe_for_delaminated_comp...Shree Bineet Kumar Kavi
 
INTERFACIAL STRESS ANALYSIS OF EXTERNALLY PLATED RC BEAMS
INTERFACIAL STRESS ANALYSIS OF EXTERNALLY PLATED RC BEAMSINTERFACIAL STRESS ANALYSIS OF EXTERNALLY PLATED RC BEAMS
INTERFACIAL STRESS ANALYSIS OF EXTERNALLY PLATED RC BEAMSIjripublishers Ijri
 

Semelhante a delamination of a strong film from a ductile substrate during indentation unloading (20)

numerical analysis of indentation-induced cracking of brittle coatings on duc...
numerical analysis of indentation-induced cracking of brittle coatings on duc...numerical analysis of indentation-induced cracking of brittle coatings on duc...
numerical analysis of indentation-induced cracking of brittle coatings on duc...
 
906882
906882906882
906882
 
Adhesion in fabrication and operation
Adhesion in fabrication and operationAdhesion in fabrication and operation
Adhesion in fabrication and operation
 
Iwashita - Laminated conductor structure for rf in normal conducting case
Iwashita - Laminated conductor structure for rf in normal conducting caseIwashita - Laminated conductor structure for rf in normal conducting case
Iwashita - Laminated conductor structure for rf in normal conducting case
 
Sia.6888
Sia.6888Sia.6888
Sia.6888
 
TRANSIENT ANALYSIS OF PIEZOLAMINATED COMPOSITE PLATES USING HSDT
TRANSIENT ANALYSIS OF PIEZOLAMINATED COMPOSITE PLATES USING HSDTTRANSIENT ANALYSIS OF PIEZOLAMINATED COMPOSITE PLATES USING HSDT
TRANSIENT ANALYSIS OF PIEZOLAMINATED COMPOSITE PLATES USING HSDT
 
Magnetic Properties and Interactions of Nanostructured CoCrTa Thin Films
Magnetic Properties and Interactions of Nanostructured CoCrTa Thin FilmsMagnetic Properties and Interactions of Nanostructured CoCrTa Thin Films
Magnetic Properties and Interactions of Nanostructured CoCrTa Thin Films
 
EVALUATING THICKNESS REQUIREMENTS OF FRACTURE SPECIMEN IN PREDICTING CHARACTE...
EVALUATING THICKNESS REQUIREMENTS OF FRACTURE SPECIMEN IN PREDICTING CHARACTE...EVALUATING THICKNESS REQUIREMENTS OF FRACTURE SPECIMEN IN PREDICTING CHARACTE...
EVALUATING THICKNESS REQUIREMENTS OF FRACTURE SPECIMEN IN PREDICTING CHARACTE...
 
G80IA030EN-A
G80IA030EN-AG80IA030EN-A
G80IA030EN-A
 
Fracture_Toughness_For _Print
Fracture_Toughness_For _PrintFracture_Toughness_For _Print
Fracture_Toughness_For _Print
 
Effects of-lamination-packs-in-induction-heating-work-coil-design-by-the-supe...
Effects of-lamination-packs-in-induction-heating-work-coil-design-by-the-supe...Effects of-lamination-packs-in-induction-heating-work-coil-design-by-the-supe...
Effects of-lamination-packs-in-induction-heating-work-coil-design-by-the-supe...
 
Tests of Graphite Polyimide Sandwich Panels Camarda
Tests of Graphite Polyimide Sandwich Panels CamardaTests of Graphite Polyimide Sandwich Panels Camarda
Tests of Graphite Polyimide Sandwich Panels Camarda
 
ThomasPorkka_ResearchReport_RETREAT
ThomasPorkka_ResearchReport_RETREATThomasPorkka_ResearchReport_RETREAT
ThomasPorkka_ResearchReport_RETREAT
 
RESULTS OF FINITE ELEMENT ANALYSIS FOR INTERLAMINAR FRACTURE REINFORCED THERM...
RESULTS OF FINITE ELEMENT ANALYSIS FOR INTERLAMINAR FRACTURE REINFORCED THERM...RESULTS OF FINITE ELEMENT ANALYSIS FOR INTERLAMINAR FRACTURE REINFORCED THERM...
RESULTS OF FINITE ELEMENT ANALYSIS FOR INTERLAMINAR FRACTURE REINFORCED THERM...
 
RESULTS OF FINITE ELEMENT ANALYSIS FOR INTERLAMINAR FRACTURE REINFORCED THERM...
RESULTS OF FINITE ELEMENT ANALYSIS FOR INTERLAMINAR FRACTURE REINFORCED THERM...RESULTS OF FINITE ELEMENT ANALYSIS FOR INTERLAMINAR FRACTURE REINFORCED THERM...
RESULTS OF FINITE ELEMENT ANALYSIS FOR INTERLAMINAR FRACTURE REINFORCED THERM...
 
Generalised_formulation_of_laminate_theory_using_beam_fe_for_delaminated_comp...
Generalised_formulation_of_laminate_theory_using_beam_fe_for_delaminated_comp...Generalised_formulation_of_laminate_theory_using_beam_fe_for_delaminated_comp...
Generalised_formulation_of_laminate_theory_using_beam_fe_for_delaminated_comp...
 
INTERFACIAL STRESS ANALYSIS OF EXTERNALLY PLATED RC BEAMS
INTERFACIAL STRESS ANALYSIS OF EXTERNALLY PLATED RC BEAMSINTERFACIAL STRESS ANALYSIS OF EXTERNALLY PLATED RC BEAMS
INTERFACIAL STRESS ANALYSIS OF EXTERNALLY PLATED RC BEAMS
 

Mais de Dr. Adnan Judeh (Abdul-Baqi)

Lecture on radiation emitted from mobile base-stations at Tulkarim 19-2-2014
Lecture on radiation emitted from mobile base-stations at Tulkarim 19-2-2014Lecture on radiation emitted from mobile base-stations at Tulkarim 19-2-2014
Lecture on radiation emitted from mobile base-stations at Tulkarim 19-2-2014Dr. Adnan Judeh (Abdul-Baqi)
 
Radiation emitted from mobile base-stations (presentation in Arabic)
Radiation emitted from mobile base-stations (presentation in Arabic)Radiation emitted from mobile base-stations (presentation in Arabic)
Radiation emitted from mobile base-stations (presentation in Arabic)Dr. Adnan Judeh (Abdul-Baqi)
 
Fatigue damage in solder joint interconnects - presentation
Fatigue damage in solder joint interconnects - presentationFatigue damage in solder joint interconnects - presentation
Fatigue damage in solder joint interconnects - presentationDr. Adnan Judeh (Abdul-Baqi)
 
radiation emitted from mobile base-stations (article in Arabic)
radiation emitted from mobile base-stations (article in Arabic)radiation emitted from mobile base-stations (article in Arabic)
radiation emitted from mobile base-stations (article in Arabic)Dr. Adnan Judeh (Abdul-Baqi)
 
study of environmental radioactivity in Palestine by in situ gamma-ray spectr...
study of environmental radioactivity in Palestine by in situ gamma-ray spectr...study of environmental radioactivity in Palestine by in situ gamma-ray spectr...
study of environmental radioactivity in Palestine by in situ gamma-ray spectr...Dr. Adnan Judeh (Abdul-Baqi)
 
fatigue damage modeling in solder interconnects using a cohesive zone approach
fatigue damage modeling in solder interconnects using a cohesive zone approachfatigue damage modeling in solder interconnects using a cohesive zone approach
fatigue damage modeling in solder interconnects using a cohesive zone approachDr. Adnan Judeh (Abdul-Baqi)
 

Mais de Dr. Adnan Judeh (Abdul-Baqi) (7)

Lecture on radiation emitted from mobile base-stations at Tulkarim 19-2-2014
Lecture on radiation emitted from mobile base-stations at Tulkarim 19-2-2014Lecture on radiation emitted from mobile base-stations at Tulkarim 19-2-2014
Lecture on radiation emitted from mobile base-stations at Tulkarim 19-2-2014
 
Radiation emitted from mobile base-stations (presentation in Arabic)
Radiation emitted from mobile base-stations (presentation in Arabic)Radiation emitted from mobile base-stations (presentation in Arabic)
Radiation emitted from mobile base-stations (presentation in Arabic)
 
Fatigue damage in solder joint interconnects - presentation
Fatigue damage in solder joint interconnects - presentationFatigue damage in solder joint interconnects - presentation
Fatigue damage in solder joint interconnects - presentation
 
CV - Adnan
CV - AdnanCV - Adnan
CV - Adnan
 
radiation emitted from mobile base-stations (article in Arabic)
radiation emitted from mobile base-stations (article in Arabic)radiation emitted from mobile base-stations (article in Arabic)
radiation emitted from mobile base-stations (article in Arabic)
 
study of environmental radioactivity in Palestine by in situ gamma-ray spectr...
study of environmental radioactivity in Palestine by in situ gamma-ray spectr...study of environmental radioactivity in Palestine by in situ gamma-ray spectr...
study of environmental radioactivity in Palestine by in situ gamma-ray spectr...
 
fatigue damage modeling in solder interconnects using a cohesive zone approach
fatigue damage modeling in solder interconnects using a cohesive zone approachfatigue damage modeling in solder interconnects using a cohesive zone approach
fatigue damage modeling in solder interconnects using a cohesive zone approach
 

delamination of a strong film from a ductile substrate during indentation unloading

  • 1. Delamination of a strong film from a ductile substrate during indentation unloading A. Abdul-Baqi and E. Van der Giessen Delft University of Technology, Koiter Institute Delft, Mekelweg 2, 2628 CD Delft, The Netherlands (Received 23 October 2000; accepted 23 February 2001) In this work, a finite element method was performed to simulate the spherical indentation of a ductile substrate coated by a strong thin film. Our objective was to study indentation-induced delamination of the film from the substrate. The film was assumed to be linear elastic, the substrate was elastic–perfectly plastic, and the indenter was rigid. The interface was modeled by means of a cohesive surface. The constitutive law of the cohesive surface included a coupled description of normal and tagential failure. Cracking of the coating itself was not included. During loading, it was found that delamination occurs in a tangential mode rather than a normal one and was initiated at two to three times the contact radius. Normal delamination occurred during the unloading stage, where a circular part of the coating, directly under the contact area was lifted off from the substrate. Normal delamination was imprinted on the load versus displacement curve as a hump. There was critical value of the interfacial strength above which delamination was prevented for a given material system and a given indentation depth. The energy consumption by the delamination process was calculated and separated from the part dissipated by the substrate. The effect of residual stress in the film and waviness of the interface on delamination was discussed. I. INTRODUCTION displacement curves show a reduction in the stiffness or Industrial application of thin hard-film-coated systems even a sudden discontinuity which is usually attributed to continuously progresses. Coatings are commonly used to the coating cracking. Delamination without any accom- enhance reliability, such as chemical resistance, wear re- panying through-thickness cracks has been observed by sistance, corrosion resistance, and thermal barriers. Ad- Li and Bhushan2 in their nanoindentation experiments on hesion between the film and the substrate determines, to single and multilayer coatings. There is no evidence in a great deal, the durability of that system. The enhance- the literature, to the authors’ knowledge, whether delami- ment gained by the coating may be accompanied by the nation can give rise to any characteristic fingerprint on risk of poor adhesion between the coating and the sub- the load versus displacement curve. strate. Failure of the interface between the coating and Bagchi and Evans3 have reviewed the mechanics of the substrate may lead to premature failure of otherwise thin film decohesion motivated by residual stress. The long lasting systems. Indentation is one of the traditional emphasis in their work is on the role of the interface methods to quantify the mechanical properties of mate- debond energy and the methods of its quantitative meas- rials, and during the last decades it has also been advo- urement. They argue that most thin film adhesion tests do cated as a tool to characterize the properties of thin films not measure the interface debond energy because the or coatings. At the same time, for example for hard wear- strain energy release rate cannot be deconvoluted from resistant coatings, indentation can be viewed as an el- the work done by the external load. Viable procedures to ementary step of concentrated loading. For these reasons, extract the interfacial energy from indentation experi- many experimental as well as theoretical studies have ments will depend strongly on the precise mechanisms been devoted to indentation of coated systems during involved. The relative contribution of each mechanism to recent years. the overall observed behavior and failure mode depends Interfacial delamination is commonly observed in on the material properties and loading conditions in a indentation experiments to be accompanied by other complex manner. In the case of ductile films on a failure phenomena, such as coating cracking and subse- hard substrate, coating delamination is coupled to plas- quent spalling. 1,2 The corresponding load versus tic expansion of the film with the driving force for 1396 J. Mater. Res., Vol. 16, No. 5, May 2001 © 2001 Materials Research Society
  • 2. A. Abdul-Baqi et al.: Delamination of a strong film from a ductile substrate during indentation unloading delamination being delivered via buckling of the film II. PROBLEM FORMULATION (see also Ref. 4). On the other hand, coatings on rela- The interface between the coating and the substrate is tively ductile substrates often fail during indentation by modeled by means of a cohesive surface, where a small radial and in some cases circumferential cracks through displacement jump between the film and substrate is al- the film. The mechanics of delamination in such systems lowed, with normal and tangential components n and has been analyzed by Drory and Hutchinson5 for deep t, respectively. The interfacial behavior is specified in indentation with depths that are 2 to 3 orders of magni- terms of a constitutive equation for the corresponding tude larger than the coating thickness. They have also traction components Tn and Tt at the same location. reviewed briefly the commonly used test methods for The constitutive law we adopt in this study is an elastic evaluating adhesion. one, so that any energy dissipation associated with sepa- Hainsworth et al.6 have suggested a simple model for ration is ignored. Thus, it can be specified through a estimating the work of interfacial debonding from the potential, i.e., maximum indentation depth and the final delamination radius. In this model, the elastic energy of the indented coating is approximated by the elastic energy of a cen- T =− = n, t . (1) trally loaded disc. The idea has also been used in cross- sectional indentation by Sa nchez et al. 7 as a new ´ technique to characterize interfacial adhesion. The pro- The potential reflects the physics of the adhesion be- portionality between the delamination area and the film tween coating and substrate. Here, we use the potential lateral deflection predicted by the model was confirmed that was given by Xu and Needleman9 by the experimental results. The objective of the present paper is to offer an im- n n 1−q proved understanding of indentation-induced delamina- = + exp − 1−r+ n n n n r−1 tion and to test the validity of the above-mentioned simple estimates. For this purpose, we perform a numeri- r−q n t 2 − q+ exp − . (2) cal simulation of the process of indentation of thin elastic r−1 n t 2 film on a relatively soft substrate with a small spherical indenter. The complete cycle of the indentation process, with n and t the normal and tangential works of both loading and unloading, is simulated. The indenter is separation (q t/ n) and n and t two characteris- assumed to be rigid, the film is elastic and strong, and the tics lengths. The parameter r governs the coupling substrate is elastic–perfectly plastic. The interface is between normal and tangential responses. As shown in modeled by a cohesive surface, which allows one to Fig. 2, both tractions are highly nonlinear functions study initiation and propagation of delamination during of separation with a distinct maximum of the nor- the indentation process. Separate criteria for delamina- mal (tangential) traction of max ( max) which occurs at tion growth are not needed in this way. The aim of this a separation of n n ( t t/√2). The normal study is to investigate the possibility and the phenom- enology of interfacial delamination with emphasis on the unloading part of the indentation process and the asso- ciated normal delamination. The interfacial failure during the loading part has been studied by the authors in a previous work.8 Delamination was found to occur in a tangential mode driven by the shear stress at the inter- face. It is initiated at a radial distance which is two or three times the contact radius resulting in a ring-shaped delaminated area and imprinted on the load– displacement curve as a kind.8 In this paper we will study the characteristics of normal delamination, conditions for the occurrence/suppression this mode of failure, and its fingerprint on the load–displacement curve and pro- vide some quantitative measures about the interfacial strength. The effect of residual stress in the film and waviness of the interface on delamination will also be investigated. It is emphasized that the calculations as- sume that other failure events, mainly through-thickness coating cracks, do not occur. FIG. 1. Geometry of the analyzed problem. J. Mater. Res., Vol. 16, No. 5, May 2001 1397
  • 3. A. Abdul-Baqi et al.: Delamination of a strong film from a ductile substrate during indentation unloading The coating is assumed to be a strong, perfectly elastic material with Young’s modulus Ec and Poisson’s ration c (subscript c for coating). The substrate is supposed to be a standard isotropic elastoplastic material with plastic flow being controlled by the von Mises stress. For numerical convenience, however, we adopt a rate-sensitive version of this model, expressed by 3 sij . p n . .p . e ij p = = y , (5) 2 e y . . .e for the plastic part of the strain rate, p ij ij ij. Here, sij are the deviator components of the Piola– . Kirchhoff stress ij and ij are the dual Lagran- gean strain-rate components. Furthermore, e √(3/2)sijsij is the von Mises stress, n is the rate sensitivity . exponent, and y is a reference strain rate. In the limit of n → , this constitutive model reduces to the rate- independent von Mises plasticity with yield stress y. Values of n on the order of 100 are frequently used for metals (see e.g., Ref. 10), so that the value of e at yield is within a few percent of y for the strain rates that are encountered in our analysis. The elastic part of the strain . rate, e , is given in terms of the Jaumann stress rate as ij ij .e Rijkl kl , (6) with the elastic modulus tensor Rijkl being determined by Young’s modulus Es and Poisson’s ration s (subscript s for substrate). The problem actually solved is illustrated in Fig. 1. FIG. 2. Normal and tangential responses according to the interfacial The indenter is assumed rigid and to have a spherical tip potential [Eq. (1)]: (a) normal response Tn( n ); (b) tangential response characterized by its radius R. The film is characterized by Tt( t). Both are normalized by their respective peak values max and its thickness t and is bonded to a half-infinite substrate max. by an interface specified above. Assuming both coating and substrate to be isotropic, the problem is axisymmet- (tangential) work of separation, n ( t ), can now be ex- ric, with radial coordinate r and axial coordinate z in the pressed in terms of the corresponding strengths max indentation direction. The actual calculation is carried ( max) as out for a substrate of height L − t and radius L, but L is taken large enough so that the solution is independent of 1 L and thus approaches the half-infinite substrate solution. n = exp 1 max n t = exp 1 max t . (3) The analysis is carried out numerically using a finite 2 strain, finite element method. It uses a total Lagrangian Using these along with the definition q = t / n, we can formulation in which equilibrium is expressed in terms of relate the normal and shear strengths through the principle of virtual work as 1 dv + dS = (7) t max = max . (4) ij ij T ti ui ds . v Si v q 2 exp 1 n The coupling parameters r and q are chosen such that the Here, v is the total L × L region analyzed and v is its shear peak traction decreases with positive n and in- boundary, both in the undeformed configuration. With creases with negative n [Fig. 2(b)]. More details are xi (r, z, ) the coordinates in the undeformed configu- given in Ref. 8. ration, ui and ti are the components of displacement and 1398 J. Mater. Res., Vol. 16, No. 5, May 2001
  • 4. A. Abdul-Baqi et al.: Delamination of a strong film from a ductile substrate during indentation unloading traction vector, respectively. The virtual strains ij cor- The substrate is simply supported at the bottom, so respond to the virtual displacement field ui via the strain that the remaining boundary conditions read definition, uz r, L = 0 for 0 r L 1 ur 0, z = 0 for 0 z L . (12) ij = ui, j + uj,i + uk,iuk, j (8) 2 However the size L will be chosen large enough that where a comma denotes (covariant) differentiation with the solution is independent from the precise remote respect to xi. The second term in the left-hand side of conditions. Eq. (7) is the contribution of the interface, which is here measured in the deformed configuration (Si {r|z = t}). III. MODEL PARAMETERS The (true) traction transmitted across the interface has components T , while the displacement jump is , with There are various material parameters that enter the being either the local normal direction ( n) or the problem, but the main ones are the interfacial normal tangential direction ( t) in the (r, z)-plane. Here, and strength max, the coating thickness t, the coating in the remainder, the axisymmetry of the problem is ex- Young’s modulus Ec, the maximum indentation depth ploited, so that u t i 0. hmax, and the substrate yield strength y. In the results to i The precise boundary conditions are also illustrated in be presented subsequently we focus mainly on the effect Fig. 1. The indentation process is performed incremen- of the interfacial normal strength max, keeping the same . value of y 1.0 GPa (with a reference strain rate of tally with a constant indentation rate h . Outside the con- . tact area with radius a in the reference configuration, the y 0.1 s−1 and n 100). The elastic properties are film surface is traction free, taken to be Ec 500 GPa, c 0.33, Es 200 GPa, and s 0.33. tr(r, 0) t z(r, 0) 0 for a r L . (9) For the cohesive surface we have chosen the same Inside the contact area we assume perfect sliding condi- values for n and t, namely 0.1 m. As in the previous tions. The boundary conditions are specified with respect study,8 the coupling parameters r and q are both taken to a rotated local frame of reference ( , , ) as shown in equal to 0.5 which give rise to qualitatively realistic cou- . pling between normal and tangential responses of the Fig. 1. In the normal direction, the displacement rate u is controlled by the motion of the indenter, while in the interface. The values of max that have been investigated tangential direction the traction t is set to zero; i.e., vary approximately between 0.5 and 2.0 GPa. These cor- respond to interfacial energies for normal failure ranging u (r, z) ˙ ˙ hcos , t (r, z) 0 for 0 r a . (10) from 150 to 600 J/m2, which are realistic values for the interface toughnesses of well-adhering deposited films.11 Numerical experiments using perfect sticking conditions Note that a constant value of q implies that the shear instead have shown that the precise boundary condi- strength max always scales with the normal strength tions only have a significant effect very close to the max according to Eq. (4). contact area and do not alter the results for delamination We have used an indenter of radius R 25 m and to be presented later. During the loading part, contact most of the results are for a film thickness t 2.5 m. nodes are identified by their spatial location with respect Indentation as well as retraction are performed at a con- to the indenter; simply, at a certain indentation depth h . stant rate h ±1 mm/s. The size L of the system ana- and displacement increment h, the node is considered to lyzed (Fig. 1) is taken to be 50t. This proved to be large be in contact if the vertical distance between the node and enough that the results are independent of L and therefore the indenter is not greater than h. During the unloading identical to those for a coated half-infinite medium. The part, a node is released from contact on the basis of both mesh is an arrangement of 12,000 quadrilateral elements its spatial location and the force it exerts on the indenter; and 12,342 nodes. The elements are built up of four lin- if the normal component of the nodal force is smaller ear strain triangles in a cross arrangement to minimize than a critical value, and the vertical distance between the numerical problems due to plastic incompressibility. To node and the indenter is positive, the node is released resolve properly the high stress gradients under the from contact. The critical value for the nodal force is indenter and for an accurate detection of the contact taken to be 1% of the average current nodal force. It nodes, the mesh is made very fine locally near the con- should be noted that using a value 1 order of magnitude tact area with an element size of t/10. smaller did not significantly affect the results. The in- Consistent with the type of elements in the coating dentation force F is computed from the tractions in the and the substrate, linear two-noded elements are used contact region, along the interface. Integration of the cohesive surface a contribution in Eq. (7) is carried out using two-point F= t z r, 0 2 r dr . (11) 0 Gauss integration. Failure, or delamination, of the J. Mater. Res., Vol. 16, No. 5, May 2001 1399
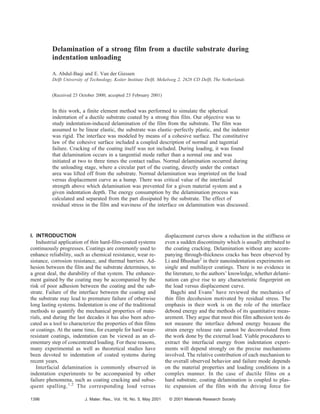
  • 5. A. Abdul-Baqi et al.: Delamination of a strong film from a ductile substrate during indentation unloading interface at any location develops when exceeds . A is a result of the resistance of the substrate to the film practical definition of when a complete crack has formed bending in this region. It was demonstrated by the au- is 2 .12 thors8 that the normal displacement induced by this stress The maximum indentation depth applied in all calcu- will reduce the interfacial shear strength [Fig. 2(b)], lations is hmax 2t. Further indentation can be done but which in turn may lead to shear delamination. was not considered relevant since real coatings will have As the indenter is withdrawn, at the same rate as dur- cracked by then and the present model is no longer ing loading, the elastically bent coating tends to seek its applicable. original flat shape. For the material parameters here this peeling tendency induces reverse plastic flow in the sub- strate under the indenter. As this proceeds, the initially IV. RESULTS AND DISCUSSION compressive stress evolves into a tensile stress in the A. Perfect interface interface directly under the initial contact region (Fig. 3). For the purpose of reference, we first consider a sys- The figure also shows that the tensile area increases tem with a perfect interface; i.e., its strength is suffi- slowly in size during the process of unloading, and its ciently higher than the stresses induced by the particular final size is roughly the same as the maximum contact loading. This can be achieved by rigidly connecting the radius amax. coating to the substrate, which corresponds to taking To study the evolution of the tensile normal stress at the interface, its maximum value max is recorded to- max/ y → . Of particular relevance here, is the devel- n opment of the stress distribution along the interface dur- gether with its position r along the interface, as shown in ing the unloading stage and, in particular, the component Fig. 4. In the initial stages of unloading, tension is found normal to the interface n. From this, we can already get only in the ring outside the contact area (Fig. 3). Upon qualitative insight into when and where delamination continued unloading, the peeling effect causes interfacial may occur. tension to develop rapidly, Fig. 4(a), with the location of Figure 3 shows the normal stress at the interface at the maximum closely following the instantaneous con- different instants between maximum indentation depth tact radius a [Fig. 4(b)]. The largest value of max n and complete retraction of the indenter, as specified 2.7 GPa obtained in this particular case is reached at the through the load F relative to the maximum indenter end of the unloading and located at the symmetry axis. load. At the maximum indentation depth, the interface On the basis of these results, interfacial failure leading stress is of course compressive and almost uniform over to normal delamination may be expected during the un- the current contact area due to plastic flow in the sub- loading stage when the interfacial strength max is lower strate. The compressive stress attains a peak value of than the maximum tensile stress max reached at any n approximately 4 GPa just outside the contact region moment. In the present case, normal delamination is of radius amax. Relatively low tensile normal stresses are avoided on the other hand if the interfacial strength max found beyond the compressive region, at r ≈ 3amax. This exceeds 2.7 GPa. Figure 5, curve (e), shows the indentation load versus displacement curve for this case of a perfect interface. Such a curve is one of the most common outputs of indentation experiments. Its importance stems from the fact that it is a signature of the indented material system. Several techniques have been reported in the literature to extract the mechanical properties of both homogeneous and composite or coated materials from indentation ex- periments (e.g., Refs. 13–17). In the forthcoming section, we will therefore study the interfacial failure process in more detail and provide some qualitative measures of the interfacial strength. B. Finite-strength interface In this section, and throughout the rest of this paper, we will study interfaces with finite strengths to allow for interfacial delamination to develop. To demonstrate the FIG. 3. Normal stress variations along a perfect interface at the be- effect of the interfacial failure on the load–displacement ginning of unloading (F = Fmax) until complete retrieval of the in- data, Fig. 5 shows the predicted curves for different val- denter (F 0). ues of interfacial strength max. The rest of the material 1400 J. Mater. Res., Vol. 16, No. 5, May 2001
  • 6. A. Abdul-Baqi et al.: Delamination of a strong film from a ductile substrate during indentation unloading FIG. 5. Load versus displacement curves for several values of inter- facial strength max: (a) 0.55; ( b) 1.1; (c) 1.5; (d) 2.2 GPa. Curve (e) is for a perfect interface. reduction is due to shear delamination at that stage, as discussed in detail in Ref. 8. In all other cases shown, the interface strength was large enough to prevent shear de- lamination but not normal delamination. The interfacial strength above which delamination is prevented is found to be max 2.21 GPa (curve d in Fig. 5). From the results discussed above for a perfect interface, however, we expected delamination at even higher strengths, up to 2.7 GPa. The difference must be attributed to the fact that the cohesive surface description for the finite-strength interface provides additional com- pliance to the system even before failure. This additional FIG. 4. (a) Evolution of the maximum normal stress max with inden- compliance results from the limited normal opening at n tation depth during unloading. (b) Corresponding location at the in- the interface ( n < n), whereas a perfect interface, by terface at which the stress is maximum. definition, does not allow such opening. Although the energy consumed at the interface in this state is ex- tremely small, the extra compliance does give rise to a and geometrical parameters are the same as before. In- small redistribution of the normal stress over the inter- terfacial delamination during unloading was found in all face and a reduction of the maximum normal stress max. n cases shown in Fig. 5 (except case e). Compared to the Figure 6(a) shows a contour plot of the von Mises perfect interface case (curve e), the initiation of delami- effective stress at the end of the loading stage (F = Fmax) nation is seen to result in a rather sudden reduction of the for the case (c) in Fig. 5 with max 1.5 GPa. The size unloading stiffness at sufficiently small F. For higher of the plastic zone at this depth of h 2t is about 5 times interfacial strengths, delamination is imprinted on the the maximum contact radius. To illustrate the delamina- load versus displacement curve as a hump where tion process, Fig. 6(b) shows a contour plot of the verti- the stiffness becomes negative. This phenomena will be cal stress component zz at the end of the unloading explained in more detail later in this section. Another process (F 0). The first thing to observe is that the characteristic of delamination that can be observed in the radius of the delaminated zone, rd, is about 50% larger load–displacement curve is the negligible residual inden- than the maximum contact radius amax reached during tation depth at the end of the unloading. In the absence of indentation. Second, we observe a region with compres- delamination (case e), the residual indentation depth is sive normal stress in front of the delamination tip. This more than half the maximum indentation depth. Curve a, region is the remainder of the compressive region gen- which corresponds to the lowest max, shows a little de- erated during the loading stage, which has apparently crease in the stiffness at the end of the loading stage. This hardly changed during unloading. It thus seemed that J. Mater. Res., Vol. 16, No. 5, May 2001 1401
  • 7. A. Abdul-Baqi et al.: Delamination of a strong film from a ductile substrate during indentation unloading FIG. 7. Evolution of the delamination radius during unloading for hmax 5 m and several values of max (or equivalently n). at a relatively high initial propagation velocity compared . to the indentation rate h and then reaches a lower ve- . locity on the order of h . The crack is stopped when it reaches the region with sufficiently high compressive stress (Fig. 6). The final delamination radius is about 1.5 times the maximum contact area for all values of max. It is clear in the figure that for lower interfacial strengths, delamination starts earlier in the unloading process. On the other hand, the lower the interfacial strength, the lower the residual indentation depth hr (per- manent indentation depth left at the end of the unload- ing). Figure 7 reveals that residual indentation depth hr for several values of max 0.55 GPa. Lower interfacial strengths even lead to small negative residual indentation depths, where the coating bulges upwards at the end of the unloading. The observations indicate that delamination is the out- come of a complex interaction between various mecha- FIG. 6. (a) Contour plot of the von Mises stress at the end of loading nisms. To get further insight into this competition, (F = Fmax). (b) Contour plot of the stress component zz at the end of the unloading (F 0) for max 1.5 GPa (curve c in Fig. 5). The plot Fig. 8(a) shows the decomposition of the total energy of also shows the delaminated region. the system into interfacial energy Uin, elastic energy Uel (in the film and substrate), and dissipated, plastic energy delamination was initiated under the retrieving indenter, Upl for the case of max 1.5 GPa (curve c in Fig. 5). expanded in the radial direction and was arrested in this Other values of interfacial strength show the same quali- compressive interfacial stress region. tative behavior. In this particular case, delamination ini- The progressive development of delamination with tiated at h 1.5t 3.75 m. It is clear in the figure that continued unloading is shown in Fig. 7 for several values the plastic energy is constant at the initial stage of the of max. It should be noted that, except for max unloading, i.e., the initial stage for the unloading is al- 2.2 GPa, delamination starts at a distance from the sym- most purely elastic. This is in agreement with what is metry axis. For these cases rd represents the location of commonly observed in indentation experiments Ref. 13. the delamination tip which is traveling away from the Limited reverse plasticity is seen to have contributed to a symmetry axis. Since the other tip reaches the symmetry little increase (less than 10%) in the plastic energy. At the axis almost immediately, rd can be considered to a good onset of delamination, the plastic energy reaches a con- approximation as the radius of the delaminated circular stant value. The contribution of the film and the substrate area. In all cases shown in Fig. 7 delamination starts to the elastic energy is demonstrated in Fig. 8(b). The 1402 J. Mater. Res., Vol. 16, No. 5, May 2001
  • 8. A. Abdul-Baqi et al.: Delamination of a strong film from a ductile substrate during indentation unloading stiffness, shown in Fig. 7, is now readily attributed to the spontaneous opening of the interface at the initial stage of delamination (Fig. 7). As explained in the previous para- graph and shown in Fig. 8, the processes that control the system during delamination are the unflexing of the coat- ing and the interfacial delamination. The coating evi- dently provides a positive contribution to the overall stiffness, whereas the energy release from the interface gives a negative contribution. This can be seen in Fig. 8, where the stiffness provided by each energy source is the curvature of the corresponding curve. For relatively strong interfaces, the energy release from the interface dominates during the first stage of delamination when the . rate of propagation, relative to the indentation rate h , is high. During the second stage, the process is governed by the unflexing of the coating, thus giving rise to a positive overall stiffness (note that the coating response is con- strained by the indenter which is withdrawn at a given rate). It is this complex interplay between these two terms which shapes the overall behavior of the system, including the load–displacement curve. C. Comparison with a simple estimate Deduction of quantitative information about the inter- facial strength from indentation experiments, in particu- lar from load–displacement curves and delamination areas, is hindered by the rather complicated interplay between the film elastic energy and the interfacial en- ergy. A simple estimate for the work of interfacial debonding from final delamination results has been given by Hainsworth et al.6 This estimate is based on an energy balance involving the interfacial energy and the elastic FIG. 8. (a) Decomposition of total energy into interfacial energy (Uin), energy in the coating (the elastic energy in the substrate elastic energy (Uel), and plastic energy (Upl ). (b) Contribution of the film and substrate to the elastic energy. In (a) and (b) max 1.5 GPa, is neglected). The latter is approximated by the elastic the normalization constant is Umax ∫hmaxF dh, and the vertical dashed 0 energy of a centrally loaded disc of radius rd with lines identify the initiation of delamination. clamped edges. On the basis of this model, the interfacial work of separation is estimated by elastic energy of the substrate is seen to decrease more rapidly compared to the elastic energy of the film at the 2Ect 3 hmax2 − hr2 initial stage of the unloading. This is in agreement with est n = 2 , (13) 31 c rd4 what is reported in the literature that the initial stiffness of the unloading is predominantly controlled by the sub- in terms of directly measurable quantities. strate for indentation depths larger than the film thick- As the model shows a strong dependence on the coat- ness.13–17 At the onset of delamination, the substrate ing thickness t and the maximum indentation depth hmax, elastic energy reaches a constant value, whereas the we have chosen to vary these two parameters over a film elastic energy decreases as the film unbends. This certain range and compare the model predictions with indicates that the main contribution to the energy release, our FEM findings. A set of calculations using a conical and hence the advance of delamination, come from the indenter with a 68° semiangle is also performed to ex- film. It is also interesting to notice that, at the end of amine the model’s sensitivity to the indenter’s geometry the unloading, there still exists some elastic energy in the which is not captured by Eq. (13). system. This energy is small compared to the dissipated Despite its very approximate nature, Eq. (13) does energy (plastic energy), but when compared with the in- capture some of the qualitative trends, as shown in Fig. 9. terfacial energy, Uin, it seems to have a significant value. For instance, one expects from (13) that rd2 hmax for a On the basis of the above observations, the unstable given interfacial strength (or energy) and coating prop- part of the load–displacement curves, with negative erties (and neglecting the residual indentation depth). J. Mater. Res., Vol. 16, No. 5, May 2001 1403
  • 9. A. Abdul-Baqi et al.: Delamination of a strong film from a ductile substrate during indentation unloading The results of a series computations for two different The more serious limitation of Eq. (13) is that the in- strengths are summarized in Fig. 9(a) and are seen to be terfacial energy estimated from the numerical results do consistent with this scaling. The conical indenter results not agree quantitatively with the actual energies. As dem- presented in the figure show the same trend. Sanchez ´ onstrated in Tables I–III, the interfacial energies are se- et al.7 have used Eq. (13) and a modified version of it on verely overestimated. In Table I we notice that the higher their cross-sectional indentation data, and they have also the maximum indentation depth, the better the estimate. confirmed the linear relation between the delamination This can be understood by recalling that the model is area and the maximum deflection of the coating. Second, based on the expression for the deflection of a clamped according to (13), rd4/3 is proportional to t, with all other disc loaded at the center,18 where the deformation is quantities being the same. Our results, shown in Fig. 9(b) assumed to be pure bending. The contribution of the are consistent with this as well. Finally, over the range of stretching is ignored; this is reasonable when the radius Ec 350–600 GPa, the proportionality between rd4 of the disc is large compared to its thickness. In the and Ec is also found to be consistent with the prediction case of indentation, this condition is analogous to contact of Eq. (13). radius (or maximum indentation depth) being larger than However, not all trends are correct. For example, the film thickness. This explains the better estimation at Eq. (13) predicts a lower slope for the delamination area larger maximum indentation depths. This trend is also versus h max curve for higher values of interfacial observed for the conical indenter in Table II, but the strength, whereas the FEM results presented in Fig.9(a) quality of the estimate here is even worse. The reason is show the opposite tendency. that the cone produces more stretching of the film than the sphere, resulting in less accuracy of the model. In Table III, the smaller the coating thickness, the better the estimate according to Eq. (13). The same explanation TABLE I. Estimates for n from Eq. (13) on the basis of the com- puted values hr and rd for t 2.5 m and several values of hmax. The actual value is n 500 J/m2. est hmax ( m) hr ( m) rd ( m) n / n 2.5 0.79 8.14 15.02 3.0 0.67 10.62 7.86 3.5 0.64 12.25 6.15 4.0 0.64 13.61 5.32 4.5 0.63 14.82 4.82 5.0 0.63 15.94 4.46 TABLE II. Same as in Table I but for a conical indenter. est hmax ( m) hr ( m) rd ( m) n / n 2.5 0.43 4.75 139.34 3.0 0.42 6.49 58.24 3.5 0.43 7.81 37.92 4.0 0.45 9.03 27.84 4.5 0.47 10.24 21.32 5.0 0.49 11.45 16.86 TABLE III. Estimates for n from E8. (13) on the basis of the com- puted values of hr and rd for hmax 5 m and several values of t. The actual value is n 500 J/m2. est t ( m) hr ( m) rd ( m) n / n 2.5 0.63 15.94 4.46 3.0 0.58 16.59 6.58 3.5 0.56 17.23 9.00 4.0 0.54 17.84 11.69 4.5 0.54 18.43 14.62 FIG. 9. (a) Delamination area rd2 versus the maximum indentation 5.0 0.54 19.00 17.75 depth hmax. (b) rd4/3 versus coating thickness t. 1404 J. Mater. Res., Vol. 16, No. 5, May 2001
  • 10. A. Abdul-Baqi et al.: Delamination of a strong film from a ductile substrate during indentation unloading holds here too. Evidently, the assumption that the disc is clamped at its boundary in questionable. If it is assumed that the disc is simply supported, the expression for est n in Eq. 13 must be multiplied by (1 + c)/(3 + c). This will give better estimates, but large errors are still possible. Note that Eq. 13 does not incorporate the influence of the substrate. To see the accuracy of this approximation, we have investigated the dependence of the delamination radius rd on the substrate properties Es and y. Varying the substrate Young’s modulus Es from 100 to 500 GPa, the resulting delamination radius increases with Es by 25%. On the other hand, an increase of the yield stress y from 0.72 to 2.0 GPa gives values of rd that decrease by only 6%. The reason for this is that the yield stress de- termines the size of the plastic zone in the substrate but not the permanent deformation immediately below the FIG. 10. Load– displacement curves for several values of hmax, for a indenter; the latter is what is controlling the delamination coating strength of max 1.85 GPa. radius. However, it should be noted, as will be discussed in the next section, that the yield stress plays a major For values of hmax less than the coating thickness (t role in determining whether delamination will take 2.5 m), c max shows a relatively rapid increase, place at all. Fig. 11(a). This increase is attributed to the increase in D. Critical value of interfacial strength the bending moment in the coating. The bending moment for delamination is proportional to the curvature of the coating which in- creases rapidly with the indentation depth until the coat- Whether or not delamination takes place depends on ing takes the shape of the indenter. After that point, the the tensile normal stress that can be generated at the curvature does not change much but the bent region interface during the unloading process. The ultimate propagates outward, and this corresponds to the slower value of this stress relative to the interface strength max increase in c max for higher indentation depths. depends on almost all parameters involved in the bound- Figure 11(b) shows also an initial rapid increase in ary value problem in a rather complex way. We have the critical strength with the coating thickness due to the performed a parameter study involving the coating elas- increase of the bending moment with t3. For thicker coat- tic modulus, the substrate yield stress, the maximum in- ings, the critical strength decreases due to the decrease in dentation depth, and the coating thickness. For each the coating curvature because the substrate becomes rela- parameter combination, delamination is suppressed if the tively softer. Figure 11(c) shows an almost linear in- interfacial strength is higher than a critical value of c . max crease of the critical strength with the coating Young’s As an example, Fig. 10 shows load–displacement modulus. The increase of the critical strength with the curves for different values of maximum indentation substrate yield stress y is shown in Fig. 11(d). This in- depths. Delamination is seen to occur if hmax is above a crease is caused by the reverse plasticity that takes place certain critical value, and it is recognized by the hump prior to delamination (Fig. 8). The higher the yield stress, left on the curve and the negligible residual indentation the higher the stresses which can be reached at the sub- depth. Lower indentation depths do not create normal strate. Since the normal stress is continuous across the stresses that exceed the interfacial strength max and, interface, higher tensile normal stress can be reached therefore, do not lead to delamination. with increasing y, thus making it possible to delaminate Figure 11 shows the variation of the critical strength c stronger interfaces. max with (a) the maximum indentation depth, (b) the coating thickness, (c) the coating Young’s modulus, and (d) the substrate yield stress. Higher values of the coating E. Residual stresses and interfacial waviness Young’s modulus Ec, the coating thickness t 3, or the Coated systems generally contain residual stresses. maximum indentation depth hmax lead to delamination of These are due to the deposition process itself, to the stronger interfaces. These are explained by the fact that thermal expansion mismatch between the coating and the driving force for delamination is the unbending of the the substrate, or a combination of the two. To study the coating. Despite the limitations of the circular disc model influence of residual stresses on delamination, we pointed out before, these trends are roughly consistent have introduced uniform in-plane stress in the film prior with Eq. (13) but not when looked at in more detail. to indentation. This has been achieved, for numerical J. Mater. Res., Vol. 16, No. 5, May 2001 1405
  • 11. A. Abdul-Baqi et al.: Delamination of a strong film from a ductile substrate during indentation unloading c FIG. 11. Critical value of the interfacial strength max versus (a) hmax, (b) t, (c) Ec, and (d) y. convenience, by assigning different thermal expansion valleys and crests where the normal stress component has coefficients to coating and substrate and by subjecting a local maximum. Neighboring delaminated areas link up the system to various temperature changes to generate before the delamination front propagates to the next stresses ranging from −10 GPa (compressive) to 10 GPa crest/valley. Even though the precise evolution of de- (tensile). Subsequently, we perform the indentation cal- lamination depends on the waviness of the interface, for culations as before. Compressive stress in the coating is found to delay the delamination process, or to even prevent delamination, whereas the opposite happens with tensile stresses. This is explained by the fact that residual stress will have an out-of-plane component after the deformation of the coating. In the case of tensile stress, this component will tend to enhance the unbending of coating during the un- loading and, thus, will assist delamination. As a conse- quence, the critical strength to prevent delamination will increase with residual tension in the coating. Compres- sive stress has the opposite effect. For example, a coating of the default thickness of t 2.5 m with a interfacial strength of max 1.84 GPa was found earlier to de- laminate after indentation to h max 5 m [see Fig. 11(a)], but delamination is prevented under a re- sidual stress of −10 GPa. The delamination radius rd is relatively insensitive to the residual stress: over a range of −7.5 to 10 GPa, rd varies between 14.4 and 16.7 m compared to rd 15.94 m for the stress-free coating (cf. Table I). Roughness of the interface is commonly simplified by a sinusoidal wave (e.g., Ref. 19). To study the effect of FIG. 12. Example of normal delamination for a case with a rough roughness on delamination, a wave of an amplitude up to interface, modeled as a sinusoidal wave with an amplitude of 0.12t and 0.2t and a wavelength up to 2t were introduced along the a wavelength equal to t. In this case, hmax 5 m and max interface; see Fig. 12. Delamination is found to start at 1.85 GPa. 1406 J. Mater. Res., Vol. 16, No. 5, May 2001
  • 12. A. Abdul-Baqi et al.: Delamination of a strong film from a ductile substrate during indentation unloading all cases considered here we did not find a significant The disc model estimate6 has been compared with our effect on the critical indentation depth at which delami- numerical findings for a range of parameters. It does nation starts nor on the final delamination radius. capture some of the qualitative aspects of delamination. But, it tends to strongly overestimate the interfacial strength or energy of separation. V. CONCLUSIONS Critical values of the interfacial strength were calcu- For the purpose of studying interfacial delamination, lated for several parameter combinations. The general numerical simulations have been carried out of the in- trends of the variation of these critical values with the dentation process of a coated material by a spherical involved parameters are easily interpreted, whereas indenter. To describe interfacial failure, the interface be- the details of this variation are governed by the nonlinear tween the film and the substrate was modeled by means nature of the problem. of a cohesive surface, with a coupled constitutive law for Compressive residual stress in the film delays delami- the normal and the tangential response. Failure of the nation, and if high enough, it might even prevent interface by normal or tangential separation, or a combi- delamination, whereas tensile residual stress has an op- nation, is embedded in the constitutive model and does posite effect. Waviness of the interface was not found to not require any additional criteria. have a significant effect on delamination. Both conclu- Normal delamination occurs during the unloading sions, however, are intimately tied to the assumption that stage of the indentation process. A circular part of the the coating remains intact during indentation. coating, directly under the contact area, is lifted off from the substrate, driven by the bending moment in the coat- ing. Normal delamination is recognized by the imprint REFERENCES left on the load versus displacement curve and the neg- 1. M.D. Kriese and W.W. Gerberich, J. Mater. Res. 14, 3019 (1999). ligible residual indentation depth. For any given inden- 2. X. Li and B. Bhushan, Thin Solid Films 315, 214 (1998). tation depth, the normal stress that can be attained at the 3. A. Bagchi and A.G. Evans, Interface Sci. 3, 169 (1996). interface is larger for thicker coatings, for coatings with 4. B.D. Marshall and A.G. Evans, J. Appl. Phys. 56, 2632 (1984). 5. M.D. Drory and J.W. Hutchinson, Proc. R. Soc. London, Ser. A a higher Young’s modulus, or for substrates with a higher 452, 2319 (1996). yield strength. To prevent delamination of such coatings, 6. S.V. Hainsworth, M.R. McGurk, and T.F. Page, Surf. Coat. Tech- stronger interfaces are necessary. nol. 102, 97 (1998). It should be noted that shear delamination can occur 7. J.M. Sa nchez, S. El-Mansy, B. Sun, T. Scherban, N. Fang, ´ during indentation, before normal delamination takes D. Pantsuo, W. Ford, M.R. Elizalde, J.M. Martınez-Esnaola, ´ A. Martın-Meizoso, J. Gil-Sevillano, M. Fuentes, and J. Maiz, ´ place. Compared to normal delamination, shear delami- Acta Mater. 47, 4405 (1999). nation can occur for relatively low interfacial strength. 8. A. Abdul-Baqi and E. Van der Giessen, Thin Solid Films 381, 143 Conversely, if the interface strength is high enough to (2001). prevent normal delamination, shear delamination will 9. X-P. Xu and A. Needleman, Model. Simul. Mater. Sci. Eng. 1, also be avoided. 111 (1993). 10. R. Becker, A. Needleman, O. Richmond, and V. Tvergaard, The energy consumed by the delamination process has J. Mech. Phys. Solids 36, 317 (1988). been explicitly calculated and separated from the part 11. Y. Wei and J.W. Hutchinson, Int. J. Fract. 10, (1999). dissipated by plastic deformation in the substrate. A 12. X-P. Xu and A. Needleman, J. Mech. Phys. Solids 42, 1397 small amount of elastic energy, but still comparable with (1994). the total interfacial energy, is left in the system after 13. M. Doerner and W. Nix, J. Mater. Res. 4, 601 (1986). 14. A.K. Bhattacharya and W.D. Nix, Int. J. Solids Struct. 24, 1287 unloading. Delamination is driven by the coating energy (1988). as it unflexes to retain its initial configuration. Deduction 15. H. Gao, C-H. Chiu, and J. Lee, Int. J. Solids Struct. 29, 2471 of quantitative information about the interfacial work of (1992). separation or strength is hindered by the complex inter- 16. R.B. King, Int. J. Solids Struct. 23, 1657 (1987). play between the coating elastic energy and the interfa- 17. Y.Y. Lim, M.M. Chaudhri, and Y. Enomoto, J. Mater. Res. 14, 2314 (1999). cial energy. However, the present model does allow for 18. S. Timoshinko and S. Woinowsky-Krieger, Theory of Plates and an inverse approach by which the work of separation can Shells, 2nd ed. (McGraw-Hill, New York, 1959). be derived iteratively. 19. D.R. Clarke and W. Pompe, Acta Mater. 47, 1749 (1999). J. Mater. Res., Vol. 16, No. 5, May 2001 1407