SlideShare uma empresa Scribd logo
1 de 8
Baixar para ler offline
The Fifth International Symposium on Computational Wind Engineering (CWE2010)
                                      Chapel Hill, North Carolina, USA May 23-27, 2010


      On the effects of complex urban geometries in mesocale
                            modelling
                     Adil Rasheeda, Darren Robinsona, Djamel Lakehal b
                a
                    EPFL ENAC, Lausanne, Switzerland (adil.rasheed@gmail.com)
                     b
                       ASCOMP GmbH, Zurich, Switzerland (lakehal@ascomp.ch)


ABSTRACT:
   Urban parameterizations that are developed can be applied to only those urban geometries
which can be represented by a regular array of cubes. However, in a real city we tend to encoun-
ter complex geometries which do not obviously match such simplified ones. Yet all of the urban
parameterizations thus far developed share the assumption that a city is made up either of a regu-
lar array of cubes or of infinitely long canopies. The inputs to these models which include street
width, building width, building density and a statistical representation of the building heights, are
generally obtained through quantitative field surveys or qualitative estimates. But in performing
this geometric abstraction there is no way to ensure that the total built surfaces and volumes of
the simplified geometry match those of the actual city, or more importantly that the energy and
momentum exchanges are equivalent. We aim here to test the hypothesis that cities can be accu-
rately represented by a regular array of cubes or canopies. For this we investigate, for a particular
scenario, the effects of urban complexity on the spatially averaged drag forces and shortwave rad-
iation exchange. We propose a new approach for fitting an array of cubes to any realistic geome-
try, so that new or existing urban parameterization schemes can be used with confidence.


1 INTRODUCTION

   Climate has a direct impact on cities’ energy flows due to the space conditioning (heating,
cooling) needs of the buildings accommodated. This impact may be reinforced due to climate
change and to the (so-called) urban heat island (UHI) effect. The corresponding changes in ener-
gy demands alter greenhouse gas emissions so that there is a feedback loop. To be able to simu-
late cities’ metabolism with reasonable accuracy it is thus important to have good models of the
urban climate. But this is complicated by the diverse scales involved. The climate in a city, for
example, will be affected not only by the buildings within the urban canopy (the size of a few
meters) but also by large topographical features such as nearby water bodies or mountains (the
size of a few kilometers). Unfortunately, it is not possible to satisfactorily resolve all of these
scales in a computationally tractable way using a single model. It is because of this that we use a
mesoscale model having a resolution of say 1 km and a domain having a size of up to a few hun-
dred of kilometers. The impact of bigger scales is then forced through the boundary conditions
using results from a Global model while the subgrid scales are parameterized. Such parameteriza-
tions are generally comprised of an Urban Canopy Model and a Building Energy Model.

  It is well established that urban structures can modify the local climate: they present drag
forces and generate turbulent wake diffusion and decrease wind speed Roth (2000). Furthermore
buildings produce an intense shear layer at the top of an urban canopy, where mean kinetic ener-
gy is transformed into turbulent kinetic energy. The thermo-physical and hygroscopic properties
of urban structures are such that these tend to be rather dry, so that evaporation-transpiration is
The Fifth International Symposium on Computational Wind Engineering (CWE2010)
                                     Chapel Hill, North Carolina, USA May 23-27, 2010


relatively weak. Radiation-absorption in street canyons and heat storage in buildings may also
modify the radiative and energy budget, causing a city to be on average warmer than the sur-
rounding areas. Due to differences in heat capacity urban and rural temperature differences tend
to reach maxima during the night and minima during the day. Many parameterizations have been
developed to account for these effects. However these assume a city to be comprised of a regular
array of parallelepipeds. In this paper we try to investigate the importance of this assumption and
we suggest a procedure for fitting real complex urban geometries to simplified equivalents to im-
prove the predictive accuracy of urban climate models, the details of which can be found in Ra-
sheed et al., (2010).


2 MODELLING BACKGROUND

   To accurately model the physics of the urban canopy, new concepts in surface modeling have
been developed. These models aim to solve the surface energy balance (SEB) for a realistic 3D
urban canopy. They share in common the following characteristics in their construction: (i) 3D
building shapes that offer drag to air flow, (ii) separate treatment of roof, wall and street surfaces
from energetic point of view, and (iii) radiative interactions between streets and walls. These
models consist of horizontal and vertical representations of the urban structures. The vertical sur-
faces represent building walls and the horizontal surfaces represent streets and roofs. Since, a
clear distinction between these surfaces is made it is very convenient to assign different values of
thermo-physical parameters to these surfaces and to model them differently. Such simple models
use a highly simplified approach to compute complex radiation exchanges like in the work of
Noiah (2000) which is based on view factors between the different surfaces or facets comprising
the surfaces. Solar reflections and occlusions to sun and the (normally isotropic) sky are also ex-
plicitly resolved. Surface temperatures, energy exchanges with the surrounding and energy sto-
rage in the built material is computed via solving a set of one dimensional conduction equation
for different types of surfaces. These models are broadly classified into two major categories:
Single Layer Urban Canopy Models like the Town Energy Balance (TEB) model of Masson
(2000) and Multilayer Urban Canopy Model like that of Martilli et. al (2002). Almost all multi-
layer urban canopy models (e.g. Kondo, 2005; Martilli, 2002) are mathematically represented by:
∂u ∂      ∂u 
  =  k zm     + Qu
∂t ∂x     ∂z 
∂v ∂      ∂v 
  =  k zm  + Qv                                                                                    (1)
∂t ∂x     ∂z 
∂θ ∂      ∂θ 
  =  k zθ     + Qθ
∂t ∂x     ∂z 
where u and v are the horizontal velocity components and θ is the potential temperature and t is
time. The basic assumption here is that a city is represented by a regular array of cubes (Figure
1), and the terms k zm , k zθ , Qu , Qv , Qθ represent the effects of drag, shear and other sources which
are parameterized in terms of the parameters B1, B2, W1, W2 and street orientation. The term
Qθ represents the energy exchange with the buildings, which depends on the surface tempera-
tures of the wall, ground and roof. The thermo-physical properties of the materials are generally
quite different and hence a differential heating of these surfaces may lead to very different source
terms. This differential heating can be caused due to the different amount of radiation incident on
these different surfaces and the canopy velocity which in turn will be affected by the drag force.
The Fifth International Symposium on Computational Wind Engineering (CWE2010)
                                      Chapel Hill, North Carolina, USA May 23-27, 2010


3 TESTING THE HYPOTHESIS

   All canopy models need as inputs: street width & orientation, building width, building density
and a statistical representation of building heights which are generally obtained through quantita-
tive field survey (which are very slow and time consuming to perform) or qualitative estimates.
But in performing this geometric abstraction there is no way to ensure that the total built surfaces
and volumes of the simplified geometry match those of the actual city or more importantly that
the energy and momentum exchanges are equivalent. In this section we aim to test the central hy-
pothesis that cities can be accurately represented by a regular array of parallelepipeds. For the
purpose we investigate, for a particular scenario, the effects of complexity in urban geometry on
the spatially averaged drag forces and short wave radiation exchanges with different surfaces
(roofs, ground, and walls). For radiation exchange we use a Simplified Radiosity Algorithm
(SRA) (Robinson and Stone 2004), while for drag computation we employ the Immersed Surface
Technique (IST) (Labois et al., 2010).

                  Table 1: Geometric characteristics of built surfaces in the domain of interest
   Horizontal built area (Roofs)                              144,000m2
   Vertical built area (Walls)                                432,000m2
   Horizontal built area (Ground)                             606,000m2
   Building Height                                            15m
   Total Built Volume                                         2,160,000m3

                           Table 2: Building plan area fraction and wall area fraction
                         Ar (m2)         At (m2)              Aw (m2)              Lp                 Lw
   Long Canopies         150,000         750,000              159,000              0.200              0.21
   Simple cuboid 1       144,000         750,000              432,000              0.192              0.57
   Simple cuboid 2       144,180         750,000              450,360              0.192              0.60
   Real morphology       144,000         750,000              432,000              0.192              0.57


3.1 Test set-up


Figure 1: Computational domain.

   We chose a part of the city of Basel (Switzerland), which has a dimension of 1000m by 750m.
A good approximation of the real geometry is sketched and it is assumed that all the buildings
have a uniform height of 15m. Many of the buildings in this part of Basel have been constructed
to this maximum height, although they do not necessarily all have flat roofs. However, our objec-
The Fifth International Symposium on Computational Wind Engineering (CWE2010)
                                        Chapel Hill, North Carolina, USA May 23-27, 2010


tive here is not to attempt to reproduce reality. Rather it is to test whether a simplified abstract re-
presentation of urban geometry can be used to reproduce similar energy and momentum ex-
change to its real (complex) counterpart. For this, a simplification of the third dimension of the
geometry should not undermine the relevance of our study. The total built vertical and horizontal
surface areas are presented in Table 1. Three simplified representations are also considered.
These we refer to as long canopies, simple cuboids 1, and simple cuboids 2. The long canopies
representation of the city consists of ten rows of terraced buildings each of dimension 500m ×
30m, with an interspacing of 67m, as shown in Figure 2. Simple cuboids 1 consists of 20 × 18,
cuboids each of dimension 20m × 20m × 15m and aligned in a regular array with a spacing of
30m in the stream wise direction and 20m in the span wise direction (Figure 2). Similarly, the
simple cuboids 2 representation consists of 20×18 cuboids of size 26.7m × 15m × 15m aligned in
a regular array with a spacing of 23.3m in the x direction and 25m in the y direction (Figure 2).


Figure 2: Surface tesselization of geometries.

   For clarity we present in Table 2 some associated geometric quantities; the building plan area
fraction and the building wall area fraction. It should be noted that the building plan area fraction
for all the representations under consideration are similar, at about 0.2. However, the wall area
fraction for the long canopy is different compared to other representations. The intention here is
to show that even when the built volume and roof area are kept equal, the vertical wall area can
differ and have a severe impact on radiation exchange and air flow. In reality even basic quanti-
ties like the built volume are hardly conserved. Thus by ensuring the equivalence of these quanti-
ties we focus on testing the underlying hypothesis that real geometries can be modeled with rea-
sonable accuracy by simplified, rather than on errors in geometric (survey) abstraction.
The Fifth International Symposium on Computational Wind Engineering (CWE2010)
                                       Chapel Hill, North Carolina, USA May 23-27, 2010


                          Table 3: Space averaged drag (Fx, Fy) and shear forces (Sx,Sy)
   -                      Fx (N)         Fy (N)          Sx (N)         Sy (N)            Fx+Sx (N)    Fy+Sy (N)
   Complex                8207           157             985            2.5               9194         160
   Long Canopies          14093          38.52           1424           1.95              15507        40.5
   Simple cuboids 1       4931           -46             754            1.3               5658         -45
   Simple cuboids 2       2911           -35             665            -3                3577         -38


3.2 Radiation modeling


Figure 3: Comparison of the amount of shortwave radiation incident on roof (left) and wall (right) surfaces every
hour for the four cases

   The magnitude of incident irradiation varies with the type of surfaces (wall, roof and ground;
due to differences in surface tilt, orientation and occlusion). This tends to result in different sur-
face temperatures, which in turn affects the quantity of energy exchanged with the surroundings.
To better understand this problem we investigate in this section the differences in incident irrad-
iation for our simplified geometries of equivalent volume. For radiation computation, the surfaces
in each of the representations are tessellated into smaller surfaces (Figure 2). This simulation was
conducted for the 7th of January. All domains of the same size will have the same quantity of so-
lar radiation entering them. For mesoscale modeling the correct calculation of the distribution of
the radiation amongst the wall, roof and ground surfaces is very important, as this determines the
total absorption of radiation within our domain and the corresponding energy that is transferred to
the adjacent air. Variations in the spatial distribution of absorbed solar energy may also modify
momentum transfers. From Figure 3 we reach the following observations:

  •    Roofs: Since the horizontal roof surface areas in all the representations are the same and all
       the buildings are of the same height we observe that the amount of radiation absorbed dur-
       ing the whole day is similar, as expected.
  •    Ground: In the particular case of long canopies the ground receives more solar radiation
       than either of the cuboids layouts, as views to the sun and sky are relatively unobstructed.
       In the complex representation these views are relatively obstructed so that the radiation in-
       cident on the ground decreases. In the case of the two cuboids representations views are
       even further obstructed, so that even less solar radiation is incident on the ground.
  •    For walls: The two simplified cuboids representations receive more shortwave radiation
       than the complex and long canopy representations. This is due to an increased reflected
       contribution and an increased south facing surface area. Thus, for this particular day, the
       walls in the simplified representation will be warmer than in the complex one. The opposite
       will be true for the ground surfaces. This will result in different surface temperatures for
       the walls and ground with a corresponding influence on surface energy exchanges.
The Fifth International Symposium on Computational Wind Engineering (CWE2010)
                                        Chapel Hill, North Carolina, USA May 23-27, 2010


Figure 4: Velocity field at 5.6m above the ground level


4 COMPUTATIONAL FLUID DYNAMICS

   For the CFD simulations the geometrical representation is the same as for the radiation calcula-
tions. However, the domain has been extended at all four boundaries by an additional 200m, to
allow the inflow to develop before encountering urban structures. The domain is discretized into
175 × 175 × 40 cells. For the complex geometry two more simulations were conducted using
150x150x40 and 225x225x60 cells for grid independence; for subsequent simulations a grid of
175 × 175 × 40 was used. An inlet boundary condition with a 1m/s velocity in the flow direction
is imposed. Wall boundary conditions were specified where required. The turbulence model used
is the standard k − ε model; with a 2nd-order convection scheme used velocities. A precondi-
tioned (multigrid) GMRES pressure scheme is used for the pressure field. The flow is converged
in steady state with convergence criteria of E-5 for velocities and kinetic energy and E-3 for dis-
sipation. All the simulations presented in this section are for a neutral atmosphere. In Figure 4 we
present the velocity field for all four geometric representations at a height of 5.6m above the
ground plane. The more complex representation is characterized by the formation of large vortic-
es in the inter-building spaces. There is also a tendency for the flow to be deflected in the span-
wise direction, due to the irregular orientation of the buildings. Long canopies strongly retard the
flow, which tends to stagnate within the canopies. Within the other simplified representations,
vortices are formed on the leeward side of the cuboids, which are small and well isolated from
each other. Also, because these obstructions are non-continuous the fluid motion remains essen-
tially unidirectional in the streamwise direction. These observations are also evident from the
magnitude of the spatially averaged drag forces presented in Table 4.
The Fifth International Symposium on Computational Wind Engineering (CWE2010)
                                          Chapel Hill, North Carolina, USA May 23-27, 2010


5 CONCEPT OF EQUIVALENT CITY


Figure 5: Complex geometry reduced to its equivalent simplified form

   From the previous section it appears to be clear that the form and layout of buildings of similar
total volume has important implications for the imposed drag forces and the distribution of ab-
sorbed radiant energy, which might lead to differential heating of surfaces and hence to differ-
ences in the total energy exchange with the surrounding air. It is thus important to identify an ar-
rangement of a simplified geometry (as used in urban parameterization scheme) for which these
two quantities (drag and shortwave radiation absorption) are roughly equivalent to those expe-
rienced by the corresponding real geometry. For this purpose we introduce a new technique for
fitting such an equivalent simplified geometry. In this we define an equivalent geometry as “that
geometry which has the same built volume, horizontal and vertical built area, offers the same
drag and absorbs the same shortwave radiation on vertical and horizontal surfaces as the com-
plex/real representation”. To find the equivalent geometry a digitalized 3-D representation is
sketched and parsed to the solver, which then identifies the corresponding equivalent geometry.
The constraints are that the total built surface area and volume of the geometries are equivalent:
Scomplex = S simplified ; and Vcomplex = Vsimplified                                                      (2)
where S stands for vertical or horizontal surface area and V stands for total built volume. The ob-
jective functions to be minimized are:
               wall               wall                                ground             ground
 f1 = Radiationcomplex − Radiationsimplified ;         f 2 = Radiationcomplex − Radiationsimplified
                                                                                                          (3)
 f 3 = Drag complex − Drag simplified


Figure 6: Shortwave radiation incident on different surfaces for ground and wall surfaces
The Fifth International Symposium on Computational Wind Engineering (CWE2010)
                                        Chapel Hill, North Carolina, USA May 23-27, 2010


  After several iterations we have identified a geometry which satisfies our definition of ”equiva-
lent geometry” (Figure 5) for our case study of Basel. We can see from Table 5 that the drag
forces for both geometric models are comparable. Although the forces in the spanwise direction
do differ, their magnitudes compared to the streamwise forces are negligible. Furthermore, from
Figure 6 we see that the profiles of radiation incident on the ground and wall surfaces for the
complex and equivalent representations are now precisely superimposed. The radiation incident
on the roof surfaces is not presented: it is proportional to the horizontal roof surface areas, which
are identical for both representations. Each cube in the equivalent representation has a dimension
of 26.7m×15m×15m. The West-East street width is 23.3m and it is aligned at an angle of 30 de-
grees to the east, while the South-North street width is 25m and is aligned o the other street.
                                          Table 4: Drag, shear and total forces
    -               Fx (N)           Fy (N)            Sx (N)            Sy (N)            Fx+Sx (N)    Fy+Sy (N)
    Complex         8207             157               985               2.5               9194         160
    Equivalent      7731             -346              894               5.8               8625         -340


6 CONCLUSION

A new algorithm has been developed and tested for fitting equivalent urban canopy geometry to
any real complex geometry, based on minimizing the error in drag force and absorbed radiation.
This new method may be used to calibrate the geometric inputs to any urban canopy model in a
rigorous way. It should be noted that in this work we have sketched the geometry of the complex
city using Google earth images and then extruded them to a particular height based on field mea-
surement. However, the algorithm which is explained in this paper can handle non-uniformity in
building height so that with 3-D laser scanned geometries becoming more and more accessible
could in principle further improve the accuracy of our equivalent representation. We have fo-
cused on these two for reasons of parsimony, but further work would be warranted to confirm or
otherwise this hypothesis and in the latter case to select alternative or additional parameters. Fi-
nally, a process of manual trial and error has thus far been employed in fitting our simplified
geometries by minimizing differences in drag and radiation predictions. Subject to computational
constraints the use of evolutionary algorithms would be more appropriate, enabling the available
parameter space to be further explored.


7 REFERENCES

Kondo H, Genchi Y, Kikegawa Y, Ohashi Y, Yoshikado H. and Komiyama H. 2005. Development of a multi-layer
   urban canopy model for the analysis of energy consumption in a big city. BLM 116:395-421
Labois M., C., Narayanan and D. Lakehal, 2010. A New CFD approach for urban flow and pollution dispersion si-
   mulation. In Proc. CWE10, Chapel Hill, NC, USA, May 23-27 (this volume).
Martilli A, Clappier, A. and Rotach M., 2002. An urban surface exchange parameterization for mesoscale models.
   Boundary Layer Meteorology 104:261-304
Masson, V., 2000. A physically-based scheme for the urban energy budget in atmospheric models. BLM 94:357-397
Noihan, J., 1981. A model for the net total radiation flux at the surfaces of a building. Building & Env. 16, 259-266
Rasheed, A., Robinson, D., A, Clappier, C. Narayanan and Lakehal, D., 2010. Representing Complex Geometries in
   Mesoscale Modeling. (in press) J. of Climatology.
Robinson, D. and Stone, A., 2005. Solar radiation modeling in the urban context. Solar Energy, 77(3):295-309
Rotach, M (2001), Urban scale dispersion modelling using a Lagrangian Particle dispersion model, BLM 99:379-410
Roth, M., 2000. Review of atmospheric turbulence over cities. Quart J Roy Meteor Soc 126: 941-990

Mais conteúdo relacionado

Mais procurados

An Experimental Study on Vehicular Emission Dispersion through Single Storied...
An Experimental Study on Vehicular Emission Dispersion through Single Storied...An Experimental Study on Vehicular Emission Dispersion through Single Storied...
An Experimental Study on Vehicular Emission Dispersion through Single Storied...inventionjournals
 
Modelling of 3D gelogical structures
Modelling of 3D gelogical structuresModelling of 3D gelogical structures
Modelling of 3D gelogical structuresZawar Khan
 
Porosity prediction from seismic using geostatistic
Porosity prediction from seismic using geostatisticPorosity prediction from seismic using geostatistic
Porosity prediction from seismic using geostatisticMelani Khairunisa
 
Subsalt Steep Dip Imaging Study with 3D Acoustic Modeling
Subsalt Steep Dip Imaging Study  with 3D Acoustic  ModelingSubsalt Steep Dip Imaging Study  with 3D Acoustic  Modeling
Subsalt Steep Dip Imaging Study with 3D Acoustic Modelingleizhuo
 
Comparative Study of Various Seismic Analysis Methods for Rc Structure
Comparative Study of Various Seismic Analysis Methods for Rc StructureComparative Study of Various Seismic Analysis Methods for Rc Structure
Comparative Study of Various Seismic Analysis Methods for Rc StructureIJERA Editor
 
Effect of Wind Direction through Single Storied Building Model Configurations...
Effect of Wind Direction through Single Storied Building Model Configurations...Effect of Wind Direction through Single Storied Building Model Configurations...
Effect of Wind Direction through Single Storied Building Model Configurations...inventionjournals
 
10 simple mathematical approach for granular fill
10  simple mathematical approach for granular fill 10  simple mathematical approach for granular fill
10 simple mathematical approach for granular fill Ahmed Ebid
 
Effect of Wind Direction through Double Storied Building Model Configurations...
Effect of Wind Direction through Double Storied Building Model Configurations...Effect of Wind Direction through Double Storied Building Model Configurations...
Effect of Wind Direction through Double Storied Building Model Configurations...inventionjournals
 
Robust 3D Geological Models: Hard Data is Key
Robust 3D Geological Models: Hard Data is KeyRobust 3D Geological Models: Hard Data is Key
Robust 3D Geological Models: Hard Data is KeyFF Explore 3D
 
SEISMIC RESPONSE MODEL INCLUDING SSI OF RC BUILDINGS ON ISOLATED AND RAFT FOU...
SEISMIC RESPONSE MODEL INCLUDING SSI OF RC BUILDINGS ON ISOLATED AND RAFT FOU...SEISMIC RESPONSE MODEL INCLUDING SSI OF RC BUILDINGS ON ISOLATED AND RAFT FOU...
SEISMIC RESPONSE MODEL INCLUDING SSI OF RC BUILDINGS ON ISOLATED AND RAFT FOU...IAEME Publication
 
Usage of N2 Method for the Performance Evaluation of Plan Asymmetric Structures
Usage of N2 Method for the Performance Evaluation of Plan Asymmetric StructuresUsage of N2 Method for the Performance Evaluation of Plan Asymmetric Structures
Usage of N2 Method for the Performance Evaluation of Plan Asymmetric StructuresIRJET Journal
 
Development of Methodology for Determining Earth Work Volume Using Combined S...
Development of Methodology for Determining Earth Work Volume Using Combined S...Development of Methodology for Determining Earth Work Volume Using Combined S...
Development of Methodology for Determining Earth Work Volume Using Combined S...IJMER
 
Monte Carlo simulation for seismic analysis of a long span suspension bridge
Monte Carlo simulation for seismic analysis of a long span suspension bridgeMonte Carlo simulation for seismic analysis of a long span suspension bridge
Monte Carlo simulation for seismic analysis of a long span suspension bridgeFranco Bontempi
 
Structural morphology optimization by evolutionary procedures
Structural morphology optimization by evolutionary proceduresStructural morphology optimization by evolutionary procedures
Structural morphology optimization by evolutionary proceduresStroNGER2012
 
Dynamic behaviour of double and triple adjacent 2D hills using boundary eleme...
Dynamic behaviour of double and triple adjacent 2D hills using boundary eleme...Dynamic behaviour of double and triple adjacent 2D hills using boundary eleme...
Dynamic behaviour of double and triple adjacent 2D hills using boundary eleme...Mehran Naghizadeh
 

Mais procurados (20)

An Experimental Study on Vehicular Emission Dispersion through Single Storied...
An Experimental Study on Vehicular Emission Dispersion through Single Storied...An Experimental Study on Vehicular Emission Dispersion through Single Storied...
An Experimental Study on Vehicular Emission Dispersion through Single Storied...
 
Modelling of 3D gelogical structures
Modelling of 3D gelogical structuresModelling of 3D gelogical structures
Modelling of 3D gelogical structures
 
Major Project (2)
Major Project (2)Major Project (2)
Major Project (2)
 
Porosity prediction from seismic using geostatistic
Porosity prediction from seismic using geostatisticPorosity prediction from seismic using geostatistic
Porosity prediction from seismic using geostatistic
 
Subsalt Steep Dip Imaging Study with 3D Acoustic Modeling
Subsalt Steep Dip Imaging Study  with 3D Acoustic  ModelingSubsalt Steep Dip Imaging Study  with 3D Acoustic  Modeling
Subsalt Steep Dip Imaging Study with 3D Acoustic Modeling
 
Comparative Study of Various Seismic Analysis Methods for Rc Structure
Comparative Study of Various Seismic Analysis Methods for Rc StructureComparative Study of Various Seismic Analysis Methods for Rc Structure
Comparative Study of Various Seismic Analysis Methods for Rc Structure
 
A250108
A250108A250108
A250108
 
Effect of Wind Direction through Single Storied Building Model Configurations...
Effect of Wind Direction through Single Storied Building Model Configurations...Effect of Wind Direction through Single Storied Building Model Configurations...
Effect of Wind Direction through Single Storied Building Model Configurations...
 
IJET-V3I1P5
IJET-V3I1P5IJET-V3I1P5
IJET-V3I1P5
 
10 simple mathematical approach for granular fill
10  simple mathematical approach for granular fill 10  simple mathematical approach for granular fill
10 simple mathematical approach for granular fill
 
Effect of Wind Direction through Double Storied Building Model Configurations...
Effect of Wind Direction through Double Storied Building Model Configurations...Effect of Wind Direction through Double Storied Building Model Configurations...
Effect of Wind Direction through Double Storied Building Model Configurations...
 
Q01222110120
Q01222110120Q01222110120
Q01222110120
 
Robust 3D Geological Models: Hard Data is Key
Robust 3D Geological Models: Hard Data is KeyRobust 3D Geological Models: Hard Data is Key
Robust 3D Geological Models: Hard Data is Key
 
SEISMIC RESPONSE MODEL INCLUDING SSI OF RC BUILDINGS ON ISOLATED AND RAFT FOU...
SEISMIC RESPONSE MODEL INCLUDING SSI OF RC BUILDINGS ON ISOLATED AND RAFT FOU...SEISMIC RESPONSE MODEL INCLUDING SSI OF RC BUILDINGS ON ISOLATED AND RAFT FOU...
SEISMIC RESPONSE MODEL INCLUDING SSI OF RC BUILDINGS ON ISOLATED AND RAFT FOU...
 
Usage of N2 Method for the Performance Evaluation of Plan Asymmetric Structures
Usage of N2 Method for the Performance Evaluation of Plan Asymmetric StructuresUsage of N2 Method for the Performance Evaluation of Plan Asymmetric Structures
Usage of N2 Method for the Performance Evaluation of Plan Asymmetric Structures
 
Th P3 09
Th P3 09Th P3 09
Th P3 09
 
Development of Methodology for Determining Earth Work Volume Using Combined S...
Development of Methodology for Determining Earth Work Volume Using Combined S...Development of Methodology for Determining Earth Work Volume Using Combined S...
Development of Methodology for Determining Earth Work Volume Using Combined S...
 
Monte Carlo simulation for seismic analysis of a long span suspension bridge
Monte Carlo simulation for seismic analysis of a long span suspension bridgeMonte Carlo simulation for seismic analysis of a long span suspension bridge
Monte Carlo simulation for seismic analysis of a long span suspension bridge
 
Structural morphology optimization by evolutionary procedures
Structural morphology optimization by evolutionary proceduresStructural morphology optimization by evolutionary procedures
Structural morphology optimization by evolutionary procedures
 
Dynamic behaviour of double and triple adjacent 2D hills using boundary eleme...
Dynamic behaviour of double and triple adjacent 2D hills using boundary eleme...Dynamic behaviour of double and triple adjacent 2D hills using boundary eleme...
Dynamic behaviour of double and triple adjacent 2D hills using boundary eleme...
 

Destaque

名古屋Ruby会議01 - Rubyでライフハッキング10連発♪
名古屋Ruby会議01 - Rubyでライフハッキング10連発♪名古屋Ruby会議01 - Rubyでライフハッキング10連発♪
名古屋Ruby会議01 - Rubyでライフハッキング10連発♪Shoya Tsukada
 
MULTISCALE MODELLING OF URBAN CLIMATE
MULTISCALE MODELLING OF URBAN CLIMATE MULTISCALE MODELLING OF URBAN CLIMATE
MULTISCALE MODELLING OF URBAN CLIMATE epfl
 
Dtv, survey paper
Dtv, survey paperDtv, survey paper
Dtv, survey paperJose Ortiz
 
2080 1 yoga-rev1_2002_portugues
2080 1 yoga-rev1_2002_portugues2080 1 yoga-rev1_2002_portugues
2080 1 yoga-rev1_2002_portuguesSara
 
Catalogo Daisy´s Miniatures
Catalogo Daisy´s MiniaturesCatalogo Daisy´s Miniatures
Catalogo Daisy´s Miniaturesdaisyminiatures
 
OSCNagoya 2011「App inventor入門」
OSCNagoya 2011「App inventor入門」OSCNagoya 2011「App inventor入門」
OSCNagoya 2011「App inventor入門」Shoya Tsukada
 

Destaque (7)

名古屋Ruby会議01 - Rubyでライフハッキング10連発♪
名古屋Ruby会議01 - Rubyでライフハッキング10連発♪名古屋Ruby会議01 - Rubyでライフハッキング10連発♪
名古屋Ruby会議01 - Rubyでライフハッキング10連発♪
 
MULTISCALE MODELLING OF URBAN CLIMATE
MULTISCALE MODELLING OF URBAN CLIMATE MULTISCALE MODELLING OF URBAN CLIMATE
MULTISCALE MODELLING OF URBAN CLIMATE
 
Airbus a380 details 9939393
Airbus a380 details 9939393Airbus a380 details 9939393
Airbus a380 details 9939393
 
Dtv, survey paper
Dtv, survey paperDtv, survey paper
Dtv, survey paper
 
2080 1 yoga-rev1_2002_portugues
2080 1 yoga-rev1_2002_portugues2080 1 yoga-rev1_2002_portugues
2080 1 yoga-rev1_2002_portugues
 
Catalogo Daisy´s Miniatures
Catalogo Daisy´s MiniaturesCatalogo Daisy´s Miniatures
Catalogo Daisy´s Miniatures
 
OSCNagoya 2011「App inventor入門」
OSCNagoya 2011「App inventor入門」OSCNagoya 2011「App inventor入門」
OSCNagoya 2011「App inventor入門」
 

Semelhante a Cwe2010 paper 172

Citysim
CitysimCitysim
Citysimepfl
 
Icuc1
Icuc1Icuc1
Icuc1epfl
 
Calculation of Fluid Dynamic for Wind Flow around Reinforced Concrete Walls
Calculation of Fluid Dynamic for Wind Flow around Reinforced Concrete WallsCalculation of Fluid Dynamic for Wind Flow around Reinforced Concrete Walls
Calculation of Fluid Dynamic for Wind Flow around Reinforced Concrete WallsIJERA Editor
 
CFD Class Final Paper
CFD Class Final PaperCFD Class Final Paper
CFD Class Final PaperNathan Butt
 
45 investigation paper id 0008 edit septian
45 investigation paper id 0008 edit septian45 investigation paper id 0008 edit septian
45 investigation paper id 0008 edit septianIAESIJEECS
 
The Illustration of Mechanism and development of Atmospheric dynamic peripher...
The Illustration of Mechanism and development of Atmospheric dynamic peripher...The Illustration of Mechanism and development of Atmospheric dynamic peripher...
The Illustration of Mechanism and development of Atmospheric dynamic peripher...iosrjce
 
CFD simulation of Lid driven cavity flow
CFD simulation of Lid driven cavity flowCFD simulation of Lid driven cavity flow
CFD simulation of Lid driven cavity flowIJSRD
 
Modeling of soil erosion by water
Modeling of soil erosion by waterModeling of soil erosion by water
Modeling of soil erosion by waterIAEME Publication
 
Numerical and experimental demonstration of a coordinate transformation-based...
Numerical and experimental demonstration of a coordinate transformation-based...Numerical and experimental demonstration of a coordinate transformation-based...
Numerical and experimental demonstration of a coordinate transformation-based...Xinying Wu
 
03302--ICWE14-2015-Experimental and Numerical Evaluation of Micrositing in Co...
03302--ICWE14-2015-Experimental and Numerical Evaluation of Micrositing in Co...03302--ICWE14-2015-Experimental and Numerical Evaluation of Micrositing in Co...
03302--ICWE14-2015-Experimental and Numerical Evaluation of Micrositing in Co...Jussara M. Leite Mattuella
 
Extradosed Bridges – Assessment of seismic damage using Ground Acceleration a...
Extradosed Bridges – Assessment of seismic damage using Ground Acceleration a...Extradosed Bridges – Assessment of seismic damage using Ground Acceleration a...
Extradosed Bridges – Assessment of seismic damage using Ground Acceleration a...irjes
 
Elastic Plastic Foundation
Elastic Plastic FoundationElastic Plastic Foundation
Elastic Plastic FoundationMiguelito Manya
 
Tesis iisee Elasto Plastic Foundation
Tesis iisee Elasto Plastic Foundation Tesis iisee Elasto Plastic Foundation
Tesis iisee Elasto Plastic Foundation Miguelito Manya
 
Study of Soil Structure Interaction Effects on Multi-risers by applying soil ...
Study of Soil Structure Interaction Effects on Multi-risers by applying soil ...Study of Soil Structure Interaction Effects on Multi-risers by applying soil ...
Study of Soil Structure Interaction Effects on Multi-risers by applying soil ...Roshni Ramakrishnan
 
REVIEW OF THE URBAN HEAT ISLAND PHENOMENON ANALYSIS AS AN ADAPTATION TO CLIMA...
REVIEW OF THE URBAN HEAT ISLAND PHENOMENON ANALYSIS AS AN ADAPTATION TO CLIMA...REVIEW OF THE URBAN HEAT ISLAND PHENOMENON ANALYSIS AS AN ADAPTATION TO CLIMA...
REVIEW OF THE URBAN HEAT ISLAND PHENOMENON ANALYSIS AS AN ADAPTATION TO CLIMA...civej
 

Semelhante a Cwe2010 paper 172 (20)

Citysim
CitysimCitysim
Citysim
 
Icuc1
Icuc1Icuc1
Icuc1
 
Calculation of Fluid Dynamic for Wind Flow around Reinforced Concrete Walls
Calculation of Fluid Dynamic for Wind Flow around Reinforced Concrete WallsCalculation of Fluid Dynamic for Wind Flow around Reinforced Concrete Walls
Calculation of Fluid Dynamic for Wind Flow around Reinforced Concrete Walls
 
CFD Class Final Paper
CFD Class Final PaperCFD Class Final Paper
CFD Class Final Paper
 
45 investigation paper id 0008 edit septian
45 investigation paper id 0008 edit septian45 investigation paper id 0008 edit septian
45 investigation paper id 0008 edit septian
 
The Illustration of Mechanism and development of Atmospheric dynamic peripher...
The Illustration of Mechanism and development of Atmospheric dynamic peripher...The Illustration of Mechanism and development of Atmospheric dynamic peripher...
The Illustration of Mechanism and development of Atmospheric dynamic peripher...
 
F03313338
F03313338F03313338
F03313338
 
Af03101880194
Af03101880194Af03101880194
Af03101880194
 
240708
240708240708
240708
 
CFD simulation of Lid driven cavity flow
CFD simulation of Lid driven cavity flowCFD simulation of Lid driven cavity flow
CFD simulation of Lid driven cavity flow
 
Modeling of soil erosion by water
Modeling of soil erosion by waterModeling of soil erosion by water
Modeling of soil erosion by water
 
response spectra
response spectraresponse spectra
response spectra
 
Numerical and experimental demonstration of a coordinate transformation-based...
Numerical and experimental demonstration of a coordinate transformation-based...Numerical and experimental demonstration of a coordinate transformation-based...
Numerical and experimental demonstration of a coordinate transformation-based...
 
03302--ICWE14-2015-Experimental and Numerical Evaluation of Micrositing in Co...
03302--ICWE14-2015-Experimental and Numerical Evaluation of Micrositing in Co...03302--ICWE14-2015-Experimental and Numerical Evaluation of Micrositing in Co...
03302--ICWE14-2015-Experimental and Numerical Evaluation of Micrositing in Co...
 
Extradosed Bridges – Assessment of seismic damage using Ground Acceleration a...
Extradosed Bridges – Assessment of seismic damage using Ground Acceleration a...Extradosed Bridges – Assessment of seismic damage using Ground Acceleration a...
Extradosed Bridges – Assessment of seismic damage using Ground Acceleration a...
 
Elastic Plastic Foundation
Elastic Plastic FoundationElastic Plastic Foundation
Elastic Plastic Foundation
 
Tesis iisee Elasto Plastic Foundation
Tesis iisee Elasto Plastic Foundation Tesis iisee Elasto Plastic Foundation
Tesis iisee Elasto Plastic Foundation
 
report
reportreport
report
 
Study of Soil Structure Interaction Effects on Multi-risers by applying soil ...
Study of Soil Structure Interaction Effects on Multi-risers by applying soil ...Study of Soil Structure Interaction Effects on Multi-risers by applying soil ...
Study of Soil Structure Interaction Effects on Multi-risers by applying soil ...
 
REVIEW OF THE URBAN HEAT ISLAND PHENOMENON ANALYSIS AS AN ADAPTATION TO CLIMA...
REVIEW OF THE URBAN HEAT ISLAND PHENOMENON ANALYSIS AS AN ADAPTATION TO CLIMA...REVIEW OF THE URBAN HEAT ISLAND PHENOMENON ANALYSIS AS AN ADAPTATION TO CLIMA...
REVIEW OF THE URBAN HEAT ISLAND PHENOMENON ANALYSIS AS AN ADAPTATION TO CLIMA...
 

Último

SOCIAL AND HISTORICAL CONTEXT - LFTVD.pptx
SOCIAL AND HISTORICAL CONTEXT - LFTVD.pptxSOCIAL AND HISTORICAL CONTEXT - LFTVD.pptx
SOCIAL AND HISTORICAL CONTEXT - LFTVD.pptxiammrhaywood
 
Q4-W6-Restating Informational Text Grade 3
Q4-W6-Restating Informational Text Grade 3Q4-W6-Restating Informational Text Grade 3
Q4-W6-Restating Informational Text Grade 3JemimahLaneBuaron
 
1029 - Danh muc Sach Giao Khoa 10 . pdf
1029 -  Danh muc Sach Giao Khoa 10 . pdf1029 -  Danh muc Sach Giao Khoa 10 . pdf
1029 - Danh muc Sach Giao Khoa 10 . pdfQucHHunhnh
 
IGNOU MSCCFT and PGDCFT Exam Question Pattern: MCFT003 Counselling and Family...
IGNOU MSCCFT and PGDCFT Exam Question Pattern: MCFT003 Counselling and Family...IGNOU MSCCFT and PGDCFT Exam Question Pattern: MCFT003 Counselling and Family...
IGNOU MSCCFT and PGDCFT Exam Question Pattern: MCFT003 Counselling and Family...PsychoTech Services
 
Holdier Curriculum Vitae (April 2024).pdf
Holdier Curriculum Vitae (April 2024).pdfHoldier Curriculum Vitae (April 2024).pdf
Holdier Curriculum Vitae (April 2024).pdfagholdier
 
Z Score,T Score, Percential Rank and Box Plot Graph
Z Score,T Score, Percential Rank and Box Plot GraphZ Score,T Score, Percential Rank and Box Plot Graph
Z Score,T Score, Percential Rank and Box Plot GraphThiyagu K
 
Call Girls in Dwarka Mor Delhi Contact Us 9654467111
Call Girls in Dwarka Mor Delhi Contact Us 9654467111Call Girls in Dwarka Mor Delhi Contact Us 9654467111
Call Girls in Dwarka Mor Delhi Contact Us 9654467111Sapana Sha
 
Accessible design: Minimum effort, maximum impact
Accessible design: Minimum effort, maximum impactAccessible design: Minimum effort, maximum impact
Accessible design: Minimum effort, maximum impactdawncurless
 
9548086042 for call girls in Indira Nagar with room service
9548086042  for call girls in Indira Nagar  with room service9548086042  for call girls in Indira Nagar  with room service
9548086042 for call girls in Indira Nagar with room servicediscovermytutordmt
 
Measures of Central Tendency: Mean, Median and Mode
Measures of Central Tendency: Mean, Median and ModeMeasures of Central Tendency: Mean, Median and Mode
Measures of Central Tendency: Mean, Median and ModeThiyagu K
 
Key note speaker Neum_Admir Softic_ENG.pdf
Key note speaker Neum_Admir Softic_ENG.pdfKey note speaker Neum_Admir Softic_ENG.pdf
Key note speaker Neum_Admir Softic_ENG.pdfAdmir Softic
 
Kisan Call Centre - To harness potential of ICT in Agriculture by answer farm...
Kisan Call Centre - To harness potential of ICT in Agriculture by answer farm...Kisan Call Centre - To harness potential of ICT in Agriculture by answer farm...
Kisan Call Centre - To harness potential of ICT in Agriculture by answer farm...Krashi Coaching
 
1029-Danh muc Sach Giao Khoa khoi 6.pdf
1029-Danh muc Sach Giao Khoa khoi  6.pdf1029-Danh muc Sach Giao Khoa khoi  6.pdf
1029-Danh muc Sach Giao Khoa khoi 6.pdfQucHHunhnh
 
Advanced Views - Calendar View in Odoo 17
Advanced Views - Calendar View in Odoo 17Advanced Views - Calendar View in Odoo 17
Advanced Views - Calendar View in Odoo 17Celine George
 
Disha NEET Physics Guide for classes 11 and 12.pdf
Disha NEET Physics Guide for classes 11 and 12.pdfDisha NEET Physics Guide for classes 11 and 12.pdf
Disha NEET Physics Guide for classes 11 and 12.pdfchloefrazer622
 
microwave assisted reaction. General introduction
microwave assisted reaction. General introductionmicrowave assisted reaction. General introduction
microwave assisted reaction. General introductionMaksud Ahmed
 
Beyond the EU: DORA and NIS 2 Directive's Global Impact
Beyond the EU: DORA and NIS 2 Directive's Global ImpactBeyond the EU: DORA and NIS 2 Directive's Global Impact
Beyond the EU: DORA and NIS 2 Directive's Global ImpactPECB
 
General AI for Medical Educators April 2024
General AI for Medical Educators April 2024General AI for Medical Educators April 2024
General AI for Medical Educators April 2024Janet Corral
 

Último (20)

SOCIAL AND HISTORICAL CONTEXT - LFTVD.pptx
SOCIAL AND HISTORICAL CONTEXT - LFTVD.pptxSOCIAL AND HISTORICAL CONTEXT - LFTVD.pptx
SOCIAL AND HISTORICAL CONTEXT - LFTVD.pptx
 
Q4-W6-Restating Informational Text Grade 3
Q4-W6-Restating Informational Text Grade 3Q4-W6-Restating Informational Text Grade 3
Q4-W6-Restating Informational Text Grade 3
 
1029 - Danh muc Sach Giao Khoa 10 . pdf
1029 -  Danh muc Sach Giao Khoa 10 . pdf1029 -  Danh muc Sach Giao Khoa 10 . pdf
1029 - Danh muc Sach Giao Khoa 10 . pdf
 
IGNOU MSCCFT and PGDCFT Exam Question Pattern: MCFT003 Counselling and Family...
IGNOU MSCCFT and PGDCFT Exam Question Pattern: MCFT003 Counselling and Family...IGNOU MSCCFT and PGDCFT Exam Question Pattern: MCFT003 Counselling and Family...
IGNOU MSCCFT and PGDCFT Exam Question Pattern: MCFT003 Counselling and Family...
 
Holdier Curriculum Vitae (April 2024).pdf
Holdier Curriculum Vitae (April 2024).pdfHoldier Curriculum Vitae (April 2024).pdf
Holdier Curriculum Vitae (April 2024).pdf
 
Z Score,T Score, Percential Rank and Box Plot Graph
Z Score,T Score, Percential Rank and Box Plot GraphZ Score,T Score, Percential Rank and Box Plot Graph
Z Score,T Score, Percential Rank and Box Plot Graph
 
Call Girls in Dwarka Mor Delhi Contact Us 9654467111
Call Girls in Dwarka Mor Delhi Contact Us 9654467111Call Girls in Dwarka Mor Delhi Contact Us 9654467111
Call Girls in Dwarka Mor Delhi Contact Us 9654467111
 
Accessible design: Minimum effort, maximum impact
Accessible design: Minimum effort, maximum impactAccessible design: Minimum effort, maximum impact
Accessible design: Minimum effort, maximum impact
 
9548086042 for call girls in Indira Nagar with room service
9548086042  for call girls in Indira Nagar  with room service9548086042  for call girls in Indira Nagar  with room service
9548086042 for call girls in Indira Nagar with room service
 
Measures of Central Tendency: Mean, Median and Mode
Measures of Central Tendency: Mean, Median and ModeMeasures of Central Tendency: Mean, Median and Mode
Measures of Central Tendency: Mean, Median and Mode
 
Key note speaker Neum_Admir Softic_ENG.pdf
Key note speaker Neum_Admir Softic_ENG.pdfKey note speaker Neum_Admir Softic_ENG.pdf
Key note speaker Neum_Admir Softic_ENG.pdf
 
Kisan Call Centre - To harness potential of ICT in Agriculture by answer farm...
Kisan Call Centre - To harness potential of ICT in Agriculture by answer farm...Kisan Call Centre - To harness potential of ICT in Agriculture by answer farm...
Kisan Call Centre - To harness potential of ICT in Agriculture by answer farm...
 
1029-Danh muc Sach Giao Khoa khoi 6.pdf
1029-Danh muc Sach Giao Khoa khoi  6.pdf1029-Danh muc Sach Giao Khoa khoi  6.pdf
1029-Danh muc Sach Giao Khoa khoi 6.pdf
 
Advanced Views - Calendar View in Odoo 17
Advanced Views - Calendar View in Odoo 17Advanced Views - Calendar View in Odoo 17
Advanced Views - Calendar View in Odoo 17
 
Disha NEET Physics Guide for classes 11 and 12.pdf
Disha NEET Physics Guide for classes 11 and 12.pdfDisha NEET Physics Guide for classes 11 and 12.pdf
Disha NEET Physics Guide for classes 11 and 12.pdf
 
Advance Mobile Application Development class 07
Advance Mobile Application Development class 07Advance Mobile Application Development class 07
Advance Mobile Application Development class 07
 
microwave assisted reaction. General introduction
microwave assisted reaction. General introductionmicrowave assisted reaction. General introduction
microwave assisted reaction. General introduction
 
Beyond the EU: DORA and NIS 2 Directive's Global Impact
Beyond the EU: DORA and NIS 2 Directive's Global ImpactBeyond the EU: DORA and NIS 2 Directive's Global Impact
Beyond the EU: DORA and NIS 2 Directive's Global Impact
 
INDIA QUIZ 2024 RLAC DELHI UNIVERSITY.pptx
INDIA QUIZ 2024 RLAC DELHI UNIVERSITY.pptxINDIA QUIZ 2024 RLAC DELHI UNIVERSITY.pptx
INDIA QUIZ 2024 RLAC DELHI UNIVERSITY.pptx
 
General AI for Medical Educators April 2024
General AI for Medical Educators April 2024General AI for Medical Educators April 2024
General AI for Medical Educators April 2024
 

Cwe2010 paper 172

  • 1. The Fifth International Symposium on Computational Wind Engineering (CWE2010) Chapel Hill, North Carolina, USA May 23-27, 2010 On the effects of complex urban geometries in mesocale modelling Adil Rasheeda, Darren Robinsona, Djamel Lakehal b a EPFL ENAC, Lausanne, Switzerland (adil.rasheed@gmail.com) b ASCOMP GmbH, Zurich, Switzerland (lakehal@ascomp.ch) ABSTRACT: Urban parameterizations that are developed can be applied to only those urban geometries which can be represented by a regular array of cubes. However, in a real city we tend to encoun- ter complex geometries which do not obviously match such simplified ones. Yet all of the urban parameterizations thus far developed share the assumption that a city is made up either of a regu- lar array of cubes or of infinitely long canopies. The inputs to these models which include street width, building width, building density and a statistical representation of the building heights, are generally obtained through quantitative field surveys or qualitative estimates. But in performing this geometric abstraction there is no way to ensure that the total built surfaces and volumes of the simplified geometry match those of the actual city, or more importantly that the energy and momentum exchanges are equivalent. We aim here to test the hypothesis that cities can be accu- rately represented by a regular array of cubes or canopies. For this we investigate, for a particular scenario, the effects of urban complexity on the spatially averaged drag forces and shortwave rad- iation exchange. We propose a new approach for fitting an array of cubes to any realistic geome- try, so that new or existing urban parameterization schemes can be used with confidence. 1 INTRODUCTION Climate has a direct impact on cities’ energy flows due to the space conditioning (heating, cooling) needs of the buildings accommodated. This impact may be reinforced due to climate change and to the (so-called) urban heat island (UHI) effect. The corresponding changes in ener- gy demands alter greenhouse gas emissions so that there is a feedback loop. To be able to simu- late cities’ metabolism with reasonable accuracy it is thus important to have good models of the urban climate. But this is complicated by the diverse scales involved. The climate in a city, for example, will be affected not only by the buildings within the urban canopy (the size of a few meters) but also by large topographical features such as nearby water bodies or mountains (the size of a few kilometers). Unfortunately, it is not possible to satisfactorily resolve all of these scales in a computationally tractable way using a single model. It is because of this that we use a mesoscale model having a resolution of say 1 km and a domain having a size of up to a few hun- dred of kilometers. The impact of bigger scales is then forced through the boundary conditions using results from a Global model while the subgrid scales are parameterized. Such parameteriza- tions are generally comprised of an Urban Canopy Model and a Building Energy Model. It is well established that urban structures can modify the local climate: they present drag forces and generate turbulent wake diffusion and decrease wind speed Roth (2000). Furthermore buildings produce an intense shear layer at the top of an urban canopy, where mean kinetic ener- gy is transformed into turbulent kinetic energy. The thermo-physical and hygroscopic properties of urban structures are such that these tend to be rather dry, so that evaporation-transpiration is
  • 2. The Fifth International Symposium on Computational Wind Engineering (CWE2010) Chapel Hill, North Carolina, USA May 23-27, 2010 relatively weak. Radiation-absorption in street canyons and heat storage in buildings may also modify the radiative and energy budget, causing a city to be on average warmer than the sur- rounding areas. Due to differences in heat capacity urban and rural temperature differences tend to reach maxima during the night and minima during the day. Many parameterizations have been developed to account for these effects. However these assume a city to be comprised of a regular array of parallelepipeds. In this paper we try to investigate the importance of this assumption and we suggest a procedure for fitting real complex urban geometries to simplified equivalents to im- prove the predictive accuracy of urban climate models, the details of which can be found in Ra- sheed et al., (2010). 2 MODELLING BACKGROUND To accurately model the physics of the urban canopy, new concepts in surface modeling have been developed. These models aim to solve the surface energy balance (SEB) for a realistic 3D urban canopy. They share in common the following characteristics in their construction: (i) 3D building shapes that offer drag to air flow, (ii) separate treatment of roof, wall and street surfaces from energetic point of view, and (iii) radiative interactions between streets and walls. These models consist of horizontal and vertical representations of the urban structures. The vertical sur- faces represent building walls and the horizontal surfaces represent streets and roofs. Since, a clear distinction between these surfaces is made it is very convenient to assign different values of thermo-physical parameters to these surfaces and to model them differently. Such simple models use a highly simplified approach to compute complex radiation exchanges like in the work of Noiah (2000) which is based on view factors between the different surfaces or facets comprising the surfaces. Solar reflections and occlusions to sun and the (normally isotropic) sky are also ex- plicitly resolved. Surface temperatures, energy exchanges with the surrounding and energy sto- rage in the built material is computed via solving a set of one dimensional conduction equation for different types of surfaces. These models are broadly classified into two major categories: Single Layer Urban Canopy Models like the Town Energy Balance (TEB) model of Masson (2000) and Multilayer Urban Canopy Model like that of Martilli et. al (2002). Almost all multi- layer urban canopy models (e.g. Kondo, 2005; Martilli, 2002) are mathematically represented by: ∂u ∂  ∂u  =  k zm  + Qu ∂t ∂x  ∂z  ∂v ∂  ∂v  =  k zm  + Qv (1) ∂t ∂x  ∂z  ∂θ ∂  ∂θ  =  k zθ  + Qθ ∂t ∂x  ∂z  where u and v are the horizontal velocity components and θ is the potential temperature and t is time. The basic assumption here is that a city is represented by a regular array of cubes (Figure 1), and the terms k zm , k zθ , Qu , Qv , Qθ represent the effects of drag, shear and other sources which are parameterized in terms of the parameters B1, B2, W1, W2 and street orientation. The term Qθ represents the energy exchange with the buildings, which depends on the surface tempera- tures of the wall, ground and roof. The thermo-physical properties of the materials are generally quite different and hence a differential heating of these surfaces may lead to very different source terms. This differential heating can be caused due to the different amount of radiation incident on these different surfaces and the canopy velocity which in turn will be affected by the drag force.
  • 3. The Fifth International Symposium on Computational Wind Engineering (CWE2010) Chapel Hill, North Carolina, USA May 23-27, 2010 3 TESTING THE HYPOTHESIS All canopy models need as inputs: street width & orientation, building width, building density and a statistical representation of building heights which are generally obtained through quantita- tive field survey (which are very slow and time consuming to perform) or qualitative estimates. But in performing this geometric abstraction there is no way to ensure that the total built surfaces and volumes of the simplified geometry match those of the actual city or more importantly that the energy and momentum exchanges are equivalent. In this section we aim to test the central hy- pothesis that cities can be accurately represented by a regular array of parallelepipeds. For the purpose we investigate, for a particular scenario, the effects of complexity in urban geometry on the spatially averaged drag forces and short wave radiation exchanges with different surfaces (roofs, ground, and walls). For radiation exchange we use a Simplified Radiosity Algorithm (SRA) (Robinson and Stone 2004), while for drag computation we employ the Immersed Surface Technique (IST) (Labois et al., 2010). Table 1: Geometric characteristics of built surfaces in the domain of interest Horizontal built area (Roofs) 144,000m2 Vertical built area (Walls) 432,000m2 Horizontal built area (Ground) 606,000m2 Building Height 15m Total Built Volume 2,160,000m3 Table 2: Building plan area fraction and wall area fraction Ar (m2) At (m2) Aw (m2) Lp Lw Long Canopies 150,000 750,000 159,000 0.200 0.21 Simple cuboid 1 144,000 750,000 432,000 0.192 0.57 Simple cuboid 2 144,180 750,000 450,360 0.192 0.60 Real morphology 144,000 750,000 432,000 0.192 0.57 3.1 Test set-up Figure 1: Computational domain. We chose a part of the city of Basel (Switzerland), which has a dimension of 1000m by 750m. A good approximation of the real geometry is sketched and it is assumed that all the buildings have a uniform height of 15m. Many of the buildings in this part of Basel have been constructed to this maximum height, although they do not necessarily all have flat roofs. However, our objec-
  • 4. The Fifth International Symposium on Computational Wind Engineering (CWE2010) Chapel Hill, North Carolina, USA May 23-27, 2010 tive here is not to attempt to reproduce reality. Rather it is to test whether a simplified abstract re- presentation of urban geometry can be used to reproduce similar energy and momentum ex- change to its real (complex) counterpart. For this, a simplification of the third dimension of the geometry should not undermine the relevance of our study. The total built vertical and horizontal surface areas are presented in Table 1. Three simplified representations are also considered. These we refer to as long canopies, simple cuboids 1, and simple cuboids 2. The long canopies representation of the city consists of ten rows of terraced buildings each of dimension 500m × 30m, with an interspacing of 67m, as shown in Figure 2. Simple cuboids 1 consists of 20 × 18, cuboids each of dimension 20m × 20m × 15m and aligned in a regular array with a spacing of 30m in the stream wise direction and 20m in the span wise direction (Figure 2). Similarly, the simple cuboids 2 representation consists of 20×18 cuboids of size 26.7m × 15m × 15m aligned in a regular array with a spacing of 23.3m in the x direction and 25m in the y direction (Figure 2). Figure 2: Surface tesselization of geometries. For clarity we present in Table 2 some associated geometric quantities; the building plan area fraction and the building wall area fraction. It should be noted that the building plan area fraction for all the representations under consideration are similar, at about 0.2. However, the wall area fraction for the long canopy is different compared to other representations. The intention here is to show that even when the built volume and roof area are kept equal, the vertical wall area can differ and have a severe impact on radiation exchange and air flow. In reality even basic quanti- ties like the built volume are hardly conserved. Thus by ensuring the equivalence of these quanti- ties we focus on testing the underlying hypothesis that real geometries can be modeled with rea- sonable accuracy by simplified, rather than on errors in geometric (survey) abstraction.
  • 5. The Fifth International Symposium on Computational Wind Engineering (CWE2010) Chapel Hill, North Carolina, USA May 23-27, 2010 Table 3: Space averaged drag (Fx, Fy) and shear forces (Sx,Sy) - Fx (N) Fy (N) Sx (N) Sy (N) Fx+Sx (N) Fy+Sy (N) Complex 8207 157 985 2.5 9194 160 Long Canopies 14093 38.52 1424 1.95 15507 40.5 Simple cuboids 1 4931 -46 754 1.3 5658 -45 Simple cuboids 2 2911 -35 665 -3 3577 -38 3.2 Radiation modeling Figure 3: Comparison of the amount of shortwave radiation incident on roof (left) and wall (right) surfaces every hour for the four cases The magnitude of incident irradiation varies with the type of surfaces (wall, roof and ground; due to differences in surface tilt, orientation and occlusion). This tends to result in different sur- face temperatures, which in turn affects the quantity of energy exchanged with the surroundings. To better understand this problem we investigate in this section the differences in incident irrad- iation for our simplified geometries of equivalent volume. For radiation computation, the surfaces in each of the representations are tessellated into smaller surfaces (Figure 2). This simulation was conducted for the 7th of January. All domains of the same size will have the same quantity of so- lar radiation entering them. For mesoscale modeling the correct calculation of the distribution of the radiation amongst the wall, roof and ground surfaces is very important, as this determines the total absorption of radiation within our domain and the corresponding energy that is transferred to the adjacent air. Variations in the spatial distribution of absorbed solar energy may also modify momentum transfers. From Figure 3 we reach the following observations: • Roofs: Since the horizontal roof surface areas in all the representations are the same and all the buildings are of the same height we observe that the amount of radiation absorbed dur- ing the whole day is similar, as expected. • Ground: In the particular case of long canopies the ground receives more solar radiation than either of the cuboids layouts, as views to the sun and sky are relatively unobstructed. In the complex representation these views are relatively obstructed so that the radiation in- cident on the ground decreases. In the case of the two cuboids representations views are even further obstructed, so that even less solar radiation is incident on the ground. • For walls: The two simplified cuboids representations receive more shortwave radiation than the complex and long canopy representations. This is due to an increased reflected contribution and an increased south facing surface area. Thus, for this particular day, the walls in the simplified representation will be warmer than in the complex one. The opposite will be true for the ground surfaces. This will result in different surface temperatures for the walls and ground with a corresponding influence on surface energy exchanges.
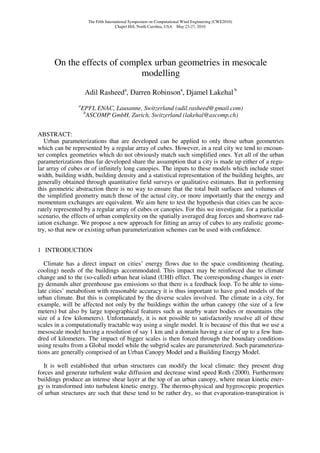
  • 6. The Fifth International Symposium on Computational Wind Engineering (CWE2010) Chapel Hill, North Carolina, USA May 23-27, 2010 Figure 4: Velocity field at 5.6m above the ground level 4 COMPUTATIONAL FLUID DYNAMICS For the CFD simulations the geometrical representation is the same as for the radiation calcula- tions. However, the domain has been extended at all four boundaries by an additional 200m, to allow the inflow to develop before encountering urban structures. The domain is discretized into 175 × 175 × 40 cells. For the complex geometry two more simulations were conducted using 150x150x40 and 225x225x60 cells for grid independence; for subsequent simulations a grid of 175 × 175 × 40 was used. An inlet boundary condition with a 1m/s velocity in the flow direction is imposed. Wall boundary conditions were specified where required. The turbulence model used is the standard k − ε model; with a 2nd-order convection scheme used velocities. A precondi- tioned (multigrid) GMRES pressure scheme is used for the pressure field. The flow is converged in steady state with convergence criteria of E-5 for velocities and kinetic energy and E-3 for dis- sipation. All the simulations presented in this section are for a neutral atmosphere. In Figure 4 we present the velocity field for all four geometric representations at a height of 5.6m above the ground plane. The more complex representation is characterized by the formation of large vortic- es in the inter-building spaces. There is also a tendency for the flow to be deflected in the span- wise direction, due to the irregular orientation of the buildings. Long canopies strongly retard the flow, which tends to stagnate within the canopies. Within the other simplified representations, vortices are formed on the leeward side of the cuboids, which are small and well isolated from each other. Also, because these obstructions are non-continuous the fluid motion remains essen- tially unidirectional in the streamwise direction. These observations are also evident from the magnitude of the spatially averaged drag forces presented in Table 4.
  • 7. The Fifth International Symposium on Computational Wind Engineering (CWE2010) Chapel Hill, North Carolina, USA May 23-27, 2010 5 CONCEPT OF EQUIVALENT CITY Figure 5: Complex geometry reduced to its equivalent simplified form From the previous section it appears to be clear that the form and layout of buildings of similar total volume has important implications for the imposed drag forces and the distribution of ab- sorbed radiant energy, which might lead to differential heating of surfaces and hence to differ- ences in the total energy exchange with the surrounding air. It is thus important to identify an ar- rangement of a simplified geometry (as used in urban parameterization scheme) for which these two quantities (drag and shortwave radiation absorption) are roughly equivalent to those expe- rienced by the corresponding real geometry. For this purpose we introduce a new technique for fitting such an equivalent simplified geometry. In this we define an equivalent geometry as “that geometry which has the same built volume, horizontal and vertical built area, offers the same drag and absorbs the same shortwave radiation on vertical and horizontal surfaces as the com- plex/real representation”. To find the equivalent geometry a digitalized 3-D representation is sketched and parsed to the solver, which then identifies the corresponding equivalent geometry. The constraints are that the total built surface area and volume of the geometries are equivalent: Scomplex = S simplified ; and Vcomplex = Vsimplified (2) where S stands for vertical or horizontal surface area and V stands for total built volume. The ob- jective functions to be minimized are: wall wall ground ground f1 = Radiationcomplex − Radiationsimplified ; f 2 = Radiationcomplex − Radiationsimplified (3) f 3 = Drag complex − Drag simplified Figure 6: Shortwave radiation incident on different surfaces for ground and wall surfaces
  • 8. The Fifth International Symposium on Computational Wind Engineering (CWE2010) Chapel Hill, North Carolina, USA May 23-27, 2010 After several iterations we have identified a geometry which satisfies our definition of ”equiva- lent geometry” (Figure 5) for our case study of Basel. We can see from Table 5 that the drag forces for both geometric models are comparable. Although the forces in the spanwise direction do differ, their magnitudes compared to the streamwise forces are negligible. Furthermore, from Figure 6 we see that the profiles of radiation incident on the ground and wall surfaces for the complex and equivalent representations are now precisely superimposed. The radiation incident on the roof surfaces is not presented: it is proportional to the horizontal roof surface areas, which are identical for both representations. Each cube in the equivalent representation has a dimension of 26.7m×15m×15m. The West-East street width is 23.3m and it is aligned at an angle of 30 de- grees to the east, while the South-North street width is 25m and is aligned o the other street. Table 4: Drag, shear and total forces - Fx (N) Fy (N) Sx (N) Sy (N) Fx+Sx (N) Fy+Sy (N) Complex 8207 157 985 2.5 9194 160 Equivalent 7731 -346 894 5.8 8625 -340 6 CONCLUSION A new algorithm has been developed and tested for fitting equivalent urban canopy geometry to any real complex geometry, based on minimizing the error in drag force and absorbed radiation. This new method may be used to calibrate the geometric inputs to any urban canopy model in a rigorous way. It should be noted that in this work we have sketched the geometry of the complex city using Google earth images and then extruded them to a particular height based on field mea- surement. However, the algorithm which is explained in this paper can handle non-uniformity in building height so that with 3-D laser scanned geometries becoming more and more accessible could in principle further improve the accuracy of our equivalent representation. We have fo- cused on these two for reasons of parsimony, but further work would be warranted to confirm or otherwise this hypothesis and in the latter case to select alternative or additional parameters. Fi- nally, a process of manual trial and error has thus far been employed in fitting our simplified geometries by minimizing differences in drag and radiation predictions. Subject to computational constraints the use of evolutionary algorithms would be more appropriate, enabling the available parameter space to be further explored. 7 REFERENCES Kondo H, Genchi Y, Kikegawa Y, Ohashi Y, Yoshikado H. and Komiyama H. 2005. Development of a multi-layer urban canopy model for the analysis of energy consumption in a big city. BLM 116:395-421 Labois M., C., Narayanan and D. Lakehal, 2010. A New CFD approach for urban flow and pollution dispersion si- mulation. In Proc. CWE10, Chapel Hill, NC, USA, May 23-27 (this volume). Martilli A, Clappier, A. and Rotach M., 2002. An urban surface exchange parameterization for mesoscale models. Boundary Layer Meteorology 104:261-304 Masson, V., 2000. A physically-based scheme for the urban energy budget in atmospheric models. BLM 94:357-397 Noihan, J., 1981. A model for the net total radiation flux at the surfaces of a building. Building & Env. 16, 259-266 Rasheed, A., Robinson, D., A, Clappier, C. Narayanan and Lakehal, D., 2010. Representing Complex Geometries in Mesoscale Modeling. (in press) J. of Climatology. Robinson, D. and Stone, A., 2005. Solar radiation modeling in the urban context. Solar Energy, 77(3):295-309 Rotach, M (2001), Urban scale dispersion modelling using a Lagrangian Particle dispersion model, BLM 99:379-410 Roth, M., 2000. Review of atmospheric turbulence over cities. Quart J Roy Meteor Soc 126: 941-990