Mandatory reading
•
1 gostou•355 visualizações

Ellsberg and heise – who-path, “assessing the validity of survey results” pp.194-200

Recomendados
Mais conteúdo relacionado
Mais de Víctor Barragán
Mais de Víctor Barragán (20)
Último
Último (20)
Mandatory reading
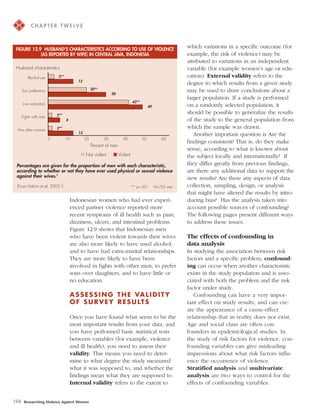
- 1. Y C H A P T E R T W E LV E FIGURE 12.9 HUSBAND’S CHARACTERISTICS ACCORDING TO USE OF VIOLENCE which variations in a specific outcome (for (AS REPORTED BY WIFE) IN CENTRAL JAVA, INDONESIA example, the risk of violence) may be attributed to variations in an independent Husband characteristics variable (for example women’s age or edu- Alcohol use 3** cation). External validity refers to the 13 degree to which results from a given study Son preference 20** may be used to draw conclusions about a 30 larger population. If a study is performed 42** Low education on a randomly selected population, it 49 2** should be possible to generalize the results Fights with men 6 of the study to the general population from Has other women 2** which the sample was drawn. 13 Another important question is Are the 0 10 20 30 40 50 60 findings consistent? That is, do they make Percent of men sense, according to what is known about I Not violent I Violent the subject locally and internationally? If Percentages are given for the proportion of men with each characteristic, they differ greatly from previous findings, according to whether or not they have ever used physical or sexual violence are there any additional data to support the against their wives.5 new results? Are there any aspects of data (From Hakimi et al, 2002.5) ** p<.001 N=765 men collection, sampling, design, or analysis that might have altered the results by intro- Indonesian women who had ever experi- ducing bias? Has the analysis taken into enced partner violence reported more account possible sources of confounding? recent symptoms of ill health such as pain, The following pages present different ways dizziness, ulcers, and intestinal problems. to address these issues. Figure 12.9 shows that Indonesian men who have been violent towards their wives The effects of confounding in are also more likely to have used alcohol, data analysis and to have had extra-marital relationships. In studying the association between risk They are more likely to have been factors and a specific problem, confound- involved in fights with other men, to prefer ing can occur when another characteristic sons over daughters, and to have little or exists in the study population and is asso- no education. ciated with both the problem and the risk factor under study. A S S E S S I N G T H E VA L I D I T Y Confounding can have a very impor- O F S U R V E Y R E S U LT S tant effect on study results, and can cre- ate the appearance of a cause-effect Once you have found what seem to be the relationship that in reality does not exist. most important results from your data, and Age and social class are often con- you have performed basic statistical tests founders in epidemiological studies. In between variables (for example, violence the study of risk factors for violence, con- and ill health), you need to assess their founding variables can give misleading validity. This means you need to deter- impressions about what risk factors influ- mine to what degree the study measured ence the occurrence of violence. what it was supposed to, and whether the Stratified analysis and multivariate findings mean what they are supposed to. analysis are two ways to control for the Internal validity refers to the extent to effects of confounding variables. 194 Researching Violence Against Women
- 2. A N A L Y Z I N G Q U A N T I TAT I V E D ATA Y Stratification involves analyzing data TABLE 12.3 PREVALENCE OF EMOTIONAL DISTRESS ACCORDING TO separately using defined categories of the MARITAL STATUS AMONG NICARAGUAN WOMEN confounding factor, such as age groups. Selection of women Percentage of emotional distress For example, some studies using bivari- All women 15–49 (n=488) 17% ate analysis (analysis using only two Ever-married women (n=360) 20% variables) have found that pregnant Never-married women (n=128) 10% women were more likely to be abused than non-pregnant women. However, (From Ellsberg et al, 1999.6) after analyzing the same data stratified by age groups, it turned out that this associa- TABLE 12.4 PREVALENCE OF EMOTIONAL DISTRESS AMONG EVER-MARRIED tion was confounded by age. It turned NICARAGUAN WOMEN ACCORDING TO EXPERIENCES OF WIFE ABUSE out that being young was the real risk Experience of wife abuse Prevalence of emotional distress factor for violence rather than pregnancy. Never abused (n=172) 7% It just happened that younger women Ever abused (n=188) 31% were more likely to be pregnant than older women. This explained the (From Ellsberg et al, 1999.6) increased prevalence of violence among pregnant women. FIGURE 12.10 THE CONFOUNDING EFFECT OF VIOLENCE ON THE Violence can also be analyzed as a con- ASSOCIATION BETWEEN MARRIAGE AND MENTAL DISTRESS founding variable for other risk factors, as shown in the following example of a study Marriage on mental distress. Preliminary results found that women who had been married at least once in their lives had twice as Violence much emotional distress as women who had never been married (Table 12.3). This would imply that marriage is an important risk factor for mental distress. Mental Distress However, when the prevalence of mental distress among ever-married women was analyzed separately according to whether women had experienced wife abuse, a abuse and not marriage itself that accounts large difference was found between the for the increase in mental distress among two groups. Thirty-one percent of abused married women. women suffered mental distress, compared This analysis is further strengthened by to only seven percent of women who had comparing women’s current mental dis- never been abused, which is even less than tress according to the severity of violence the prevalence of distress among never- they experienced and when it took place, married women (Table 12.4). as shown in Figure 12.11. Breaking down Since wife abuse is associated with mar- the analysis this way demonstrates that riage (by definition only ever-partnered women who were severely abused in the women can experience wife abuse) and it last 12 months were over ten times more is also associated with mental distress, it likely to be distressed than women who has a confounding effect on the association had never been abused. Further, it between marriage and mental distress revealed that the severity of abuse (Figure 12.10). Therefore, after stratified was more important than when it took analysis it becomes evident that it is wife place, since women experiencing severe A Practical Guide for Researchers and Activists 195
- 3. Y C H A P T E R T W E LV E FIGURE 12.11 PREVALENCE OF EMOTIONAL DISTRESS ACCORDING TO EXPERIENCES OF VIOLENCE AMONG NICARAGUAN WOMEN Emotional Distress % 10 20 30 40 50 Crude Odds Ratios 95% Confidence Interval Experiences of Violence No violence 7% 1.0 Former moderate 15% 2.3 .7–7.8 21% 1.0 –12.0 Current moderate 3.6 Former severe 27% 4.8 2.2–10.8 Current severe 44% 10.3 4.9–21.6 Percentages are given for the proportion of ever-married women who experienced emotional distress in the four weeks prior to the survey, according to whether they had experienced physical partner violence. Violence was classified by severity and by whether it took place within the 12 months previous to the study, or earlier. In the right hand columns, crude (unadjusted) odds ratios and their corresponding confi- dence intervals are given. Intervals where the lower and upper figures do not include 1.0 are considered statistically significant. (In this case, all types of violence except for former moderate violence are signifi- cantly associated with emotional distress.) violence formerly were still more likely to that urban women and women with many be currently distressed than women who children are found to have greater levels had suffered only minor abuse, even of violence, simply because they are more though it took place more recently. likely to be poor? How can we unravel the complex relationships between these The use of multivariate analysis to variables? adjust for confounding factors Multivariate analysis techniques, such When it appears that there are several as logistic regression modeling, are variables confounding an association, then useful for examining the relationships it is no longer practical to use stratified between several explanatory factors and a analysis, as it would be excessively com- specific outcome variable. Logistic plex to perform. For example, in Figure regression helps to uncover the degree 12.7, we saw that in the León study there to which several explanatory variables are were several variables, such as poverty, related and to control for confounding living in the urban area, and number of variables. In Table 12.5 (next page), the children, which were associated with the same relationships presented in Figure risk of violence. It was further shown that 12.7 are examined using crude or unad- these three variables are associated with justed odds ratios as well as multivariate each other as well as with women’s level or adjusted odds ratios. The 95 percent of education. Could it be that poverty is confidence intervals are used to assess the true underlying factor influencing the statistical significance of the associa- women’s risk of violence, and therefore tion by indicating that there is a 95 196 Researching Violence Against Women
- 4. A N A L Y Z I N G Q U A N T I TAT I V E D ATA Y percent probability that the true figure TABLE 12.5 ASSOCIATIONS BETWEEN BACKGROUND FACTORS lies between this range. If the range AND PREVALENCE OF VIOLENCE AMONG 360 EVER-MARRIED NICARAGUAN WOMEN AGES 15–49 between the lower and upper figure in the confidence interval does not include Crude Adjusted one, then it can be said that there is a 95 Variable Categories OR (95% CI) OR (95% CI) Poverty Nonpoor 1.0 1.0 percent probability that the association is Poor 1.91 (1.12-–3.23) 1.82 (1.03–3.23) not due to chance. Zone Rural 1.0 1.0 When comparing the crude and multi- Urban 1.62 (.94-–2.78) 2.07 (1.12–3.82) variate odds ratios for each variable, one Number of 0–1 1.0 1.0 can see that they do not vary much in children 2–3 1.40 (.82-–2.39) 1.34 (.74–-2.43) most of the cases. The association 4 or more 2.77 (1.59-–4.82) 2.23 (1.21–-4.15) between violence and poverty, having Family No history history in wife’s family 1.0 1.0 more than four children, and a history of of abuse Wife’s mother family violence in the husband’s family abused 1.8 (1.24-–2.90) 1.28 (.79-–2.09) are all maintained. Living in the urban No history in area, which had a confidence interval husband’s family 1.0 1.0 slightly below one in the crude analysis, Husband’s mother abused 3.13 (2.00-–4.96) 2.98 (1.86–4.73) becomes significant in the multivariate model, while a history of family violence Crude and adjusted odds ratios are given (together with 95 percent confi- in the wife’s family becomes insignificant. dence intervals) for having experienced violence at least once in their lives. After performing the multivariate analy- (From Ellsberg et al, 1999.4) sis, it is possible to say that although poverty, urban/rural residence, and high Using advanced statistical parity are all related, their effect on analysis creatively women’s risk of violence is independent In earlier sections of this chapter, we pre- and should not be interpreted as the sented the most commonly used tech- result of confounding. niques for statistical analysis of survey data FIGURE 12.12 TIME FROM THE START OF A RELATIONSHIP TO THE ONSET OF VIOLENCE Percentage of women 100– 80– 60– 40– 20– 0– 0 2 4 6 8 10 12 14 16 18 20 22 Number of years from start of marriage to onset of violence The figure shows the cumulative incidence of domestic violence over time among 188 women who reported having experienced marital violence at least once in their lives, using Kaplan Meier Life Table Analysis.8 (From Ellsberg et al, 2000.8) A Practical Guide for Researchers and Activists 197
- 5. Y C H A P T E R T W E LV E FIGURE 12.13 THE PROBABILITY OF LEAVING AN ABUSIVE RELATIONSHIP OVER TIME, BASED ON A WOMAN’S CURRENT AGE GROUP Percentage of women leaving 100– 90– 80– 70– 60– 50– 40– 30– 20– 10– 0– 0 2 4 6 8 10 12 14 16 18 20 22 24 26 Number of years from onset of violence to leaving 15–24 25–34 35–49 p<.01 This figure shows that 50% of young women (ages 15–25) leave a relationship within four years of violence starting, whereas 20 years was the median time of older women. (From Ellsberg, 2000.10) on violence. However, additional insight implies that high parity, instead of being may be revealed by the creative use of a risk factor for abuse, is more likely to more advanced statistical techniques. be a result of violence, because battered For example, life table or survival women are less likely to be able to con- analysis was used to gain a deeper trol the timing of sex or the use of birth understanding of the relationship between control. violence and high parity in Nicaragua. The same techniques were applied to Many international studies have found a the likelihood of a woman leaving an similar association.7 One interpretation for abusive relationship, and it was found this is that having many children places that 70 percent of women eventually did additional stress on a marriage and leave their abusers, although some increases a woman’s likelihood of being women stayed as long as 25 years or beaten by her husband. more before separating. Stratifying this However, using life table analysis, a analysis according to age groups shows statistical technique which measures the that younger women are more likely to probability of events occurring over time, have left an abusive relationship within it was possible to determine that violence four years, compared to women began early on in relationships, in many between 35-49 years (Figure 12.13). This cases well before women had started indicates that younger women are less bearing children. Figure 12.12 shows that likely to tolerate abuse than older 50 percent of violence begins within two women. In order to use survival analysis years of marriage, while 80 percent of techniques, it is necessary to collect abuse starts within four years. This detailed data regarding each of a 198 Researching Violence Against Women
- 6. A N A L Y Z I N G Q U A N T I TAT I V E D ATA Y woman’s relationships: when did it start, BOX 12.2 SUGGESTED GUIDELINES FOR WRITING A SCIENTIFIC PAPER how long did it last, was there violence, and if so, when did the first and last Abstract incidents of violence take place. These Approximately 100 words. types of analyses are somewhat compli- Background cated to perform and interpret, so it is Literature, national context, objectives. important to consult with an experi- enced statistician. Methods Describe the study population, how the sample was selected, what instruments were used, how the fieldwork was conducted, how data were analyzed, how ethical INTERPRETING clearance was obtained, and any special measures, such as safety procedures. T H E R E S U LT S Results This section should describe all the major results of data analysis, including relevant The process of data analysis will often tables and figures, and measures of statistical significance. take longer than you initially expect. However, you can plan data analysis in Discussion stages, so that initial findings, such as The purpose of this section is to interpret the meaning of data, assessing the validity and generalizability, possible sources of bias, how the findings relate to interna- prevalence and descriptive characteristics, tional and national studies on the same subject, and possible explanations for the can be made available as soon as possible most important findings. to the communities and local institutions that have been supporting the research, Conclusions These are sometimes included in the discussion section. How might these findings and that will be anxiously awaiting results. be used for improving interventions and policy? What are areas that might benefit Further analysis can be performed over a from future research? longer period to explore some of the more interesting findings in greater depth. Box References Make sure to include citations from the most relevant literature in the field of study. 12.2 presents guidelines for writing up research results for publication in scientific (From Persson and Wall, 2003.1) journals. Chapter 14 will discuss in detail how research results may be tailored to fit the needs of different groups. two variables, but unless you have When interpreting and writing up the good information about when different results of data analysis, it is important to conditions or events occurred it is diffi- be cautious. Each research design yields cult to know with certainty what came different kinds of data, with their respec- first. A good example of how causal tive limitations. Be careful not to draw relationships can be misinterpreted is conclusions that are not supported by the the relationship between parity and vio- data, as overstating your results can seri- lence presented in the last section. It is ously undermine the credibility of the a good idea when presenting results research. People are more likely to listen from cross-sectional surveys to talk to your findings when you are open about “associations” rather than causes. about whatever limitations the study had The discussion section can assess in terms of design, data collection, or which variables are most likely to be analysis. Some examples of common pit- causes or outcomes, based on your falls are the following: conceptual framework and other stud- ies on the subject. I Inferring causal relationships from cross-sectional data. Cross-sectional sur- I Inferring causal relationships from bi- veys can highlight associations between variate analysis. As we showed in the A Practical Guide for Researchers and Activists 199
- 7. Y C H A P T E R T W E LV E example on marriage and emotional 1. Persson LÅ, Wall S. Epidemiology for Public distress, other variables may confound Health. Umeå, Sweden: Umeå International School of Public Health; 2003. a relationship between two variables. If 2. Yoshihama M, Sorenson SB. Physical, sexual, and you have not performed stratified or emotional abuse by male intimates: Experiences multivariate analysis, it is wise to be of women in Japan. Violence and Victims. cautious in interpreting your results. 1994;9(1):63-77. 3. Rosales J, Loaiza E, Primante D, et al. Encuesta I Generalizing conclusions for different Nicaraguense de Demografia y Salud, 1998. Managua, Nicaragua: Instituto Nacional de populations than the study population. Estadisticas y Censos, INEC; 1999. Results that are representative for one 4. Ellsberg MC, Peña R, Herrera A, Liljestrand J, region are not necessarily true for Winkvist A. Wife abuse among women of child- other regions in the country, or for the bearing age in Nicaragua. American Journal of country as a whole. This does not Public Health. 1999;89(2):241-244. mean that regional studies cannot pro- 5. Hakimi M, Nur Hayati E, Ellsberg M, Winkvist A. Silence for the Sake of Harmony: Domestic vide important insights that are rele- Violence and Health in Central Java, Indonesia. vant for a much broader context. There Yogyakarta, Indonesia: Gadjah Mada University; are many examples of regional studies 2002. that made critical contributions for 6. Ellsberg M, Caldera T, Herrera A, Winkvist A, guiding national policies and programs. Kullgren G. Domestic violence and emotional However, it is still important to be distress among Nicaraguan women: Results from a population-based study. American Psychologist. careful in stating clearly what the limi- 1999;54(1):30-36. tations of the sample are, both in terms 7. Kishor S, Johnson K. Domestic Violence in Nine of its power to capture important asso- Developing Countries: A Comparative Study. ciations and its generalizability. Calverton, MD: Macro International; 2004. 8. Ellsberg M, Peña R, Herrera A, Liljestrand J, Winkvist A. Candies in hell: Women's experiences of violence in Nicaragua. Social Science and Medicine. 2000;51(11):1595-1610. 9. Ellsberg MC, Winkvist A, Peña R, Stenlund H. Women's strategic responses to violence in Nicaragua. Journal of Epidemiology and Community Health. 2001;55(8):547-555. 10.Ellsberg M. Candies in Hell: Research and Action on Domestic Violence in Nicaragua [Doctoral Dissertation]. Umeå, Sweden: Umeå University; 2000. 200 Researching Violence Against Women