SlideShare uma empresa Scribd logo
1 de 43
The Global Picture
                                         Per region

                                             2012
  298m Asia-Pacific
   gamers
                                                                               North America 169m
          $22.2bn                                                                    $21.8bn gamers
          +13% CAGR                                                                +1% CAGR
                                              Total
                                           $68bn
 47m Middle-East                          +7% CAGR
gamers & Africa
                                              880m
       $1.0bn                                  gamers
       +21% CAGR                                                               Latin America 89m
                                                                                      $3.8bn gamers
         274m Europe                                                             +14% CAGR
          gamers $18.8bn
                 +3% CAGR    Source: Newzoo 2012 Games Market Revenue Report


                 GAMES REPRESENT 25% OF THE GLOBAL SOFTWARE MARKET.
           THE GLOBAL GAMES INDUSTRY BOASTS HIGHER REVENUES THAN THE TOTAL
                  MUSIC INDUSTRY AND 2X THAT OF THE MOVIES BOX OFFICE.
                                            © 2013 Newzoo
The Global Picture
                         Per Market Segment

                                                                Casual Websites
PC/Mac Download                                                          $4.2bn
$7.6bn                                                                -1% CAGR
+2% CAGR                                                                    Social Networks
                                                                                     $3.9bn
                                                                                  +5% CAGR
PC/Mac Boxed                         Total
$8.0bn                                                                        Mobile
                                 $68bn                                        Devices
-11% CAGR                        +7% CAGR                                       9.0bn
                                                                           +32% CAGR
        Consoles
           $21.2                                                           MMOs
       -2% CAGR                                                           $13.6bn
                     Source: Newzoo 2012 Games Market Revenue Report
                                                                       +21% CAGR


                                     © 2013 Newzoo
Microsoft is Already a Leader
But Dramatic Market Changes Spark Opportunities for All Business Units


                               © 2013 Newzoo
Kings of Free-to-Play
New companies set up to manage games-as-a-service
          ALL GAMES ARE MULTIPLAYER AND CONTINUOSLY RUN AND
          CONNECTED THROUGH THE CLOUD.

          FREE-TO-PLAY | PLATFORM/SCREEN: PC
          PUBLISHER: RIOTGAMES (US) OWNED BY TENCENT (CHINA)
          LAUNCH: OCTOBER 2009
          MONTHLY ACTIVE PLAYERS: +/- 35,000,000
          MONTHLY REVENUES: +/- $40,000,000


          FREE-TO-PLAY | PLATFORM/SCREEN: PC
          PUBLISHER: WARGAMING.NET (RUSSIA)
          LAUNCH: APRIL 2008
          MONTHLY ACTIVE PLAYERS: +/- 13,000,000
          MONTHLY REVENUES: +/- $55,000,000
           ESTIMATED PROFIT/MONTH: $25,000,000
           ESTIMATED CLOUD COSTS/MONTH: $1.5-2M, $3-4M incl hardware


           FREE-TO-PLAY | PLATFORM/SCREEN: SMARTPHONE, TABLET
           PUBLISHER: SUPERCELL (FINLAND)
           LAUNCH: AUGUST 2012
           MONTHLY DOWNLOADS: +/- 4,000,000
           MONTHLY REVENUES: +/- $15,000,000


                          © 2013 Newzoo
Time is Money
eSports and Spectator Mode double time spent and load on the cloud

                                              Prize money season 2: $5,000,000
                                              Video


                    Watch live games of gamers that are (slightly) better than you.
                              © 2013 Newzoo
Mobile Games Market
                    tablet and smartphone games (global, 2012)

$9bn +32% >500M
CONSUMER SPEND      ANNUAL GROWTH                   MOBILE PLAYERS
                                                                                     >175M
                                                                                       PAYING PLAYERS


33%  OF ALL*
                                                                                      66%  OF ALL*
DOWNLOADS                                                                                 MONEY


                                                                                          $
 TO SMARTPHONES                                                                     SPENT ON SMARTPHONES
 AND TABLETS WERE                                                                  AND TABLETS WAS SPENT ON
    GAMES               *BASED ON iOS APP STORE DATA IN 44 COUNTRIES & PLAYSTORE          GAMES
                                          DATA OF 17 COUNTRIES

                                       © 2013 Distimo/Newzoo
UK Market Overview
Quarter 3 2012 - selected results
                                    Ukie Event: 24 Jan
                                        Ian Bramley
WHAT IS GAMETRACK?


                    APPS            ONLINE        PACKAGED
                    FREE APPS          SOCIAL      DISC/CART
                    PAID APPS     FREE DOWNLOAD       NEW
                   PAID EXTRAS    PAID DOWNLOAD   PRE OWNED
                                    PAID EXTRAS     RENTAL
                                    MULTIPLAYER
                                     BROWSER


           TIME SPENT            ACQUISITION               VALUE
HOW DO WE DO IT?
MONTHLY FIELDWORK PER MARKET


1,000 Nat Rep       1,000 Online
 Face to Face           Rep
     SAMPLES COMBINED AND
    WEIGHTED TO BE NATIONALLY
     REPRESENTATIVE AGED 6+           REPORTING QUARTERLY PER
                                    MARKET ON 6,000+ INTERVIEWS
                                   24,000 INTERVIEWS PER QUARTER
                                            ACROSS EUROPE


                                   from Q3 2012    from Q1 2013    9
HOW MANY PEOPLE
GAME?

                  10
WHAT ARE THE MAIN FORMS OF GAMING?
Base: all 6+ population


   % Play...                            Q3 2012                      Q4 ‘11
                 Any video gaming                 20m people   35%    38%

                      ANY Packaged                       22%          26%

                           ANY Apps               14%                 12%

                          ANY Online                    19%           18%

                          Downloads         8%                        8%

                               Social       8%                        8%

                          Multiplayer       8%                        8%

               Browser game sites           8%                        6%
                                                                              11
HOW DIFFERENT IS
GAMING BY AGE?


                   12
% PLAY ANY PACKAGED GAMES
Base: all 6+ population
100%
             % Play...                                            % Q3 2012

75%
                                                                  % Q4 2011
                                     PACKAGED


50%


25%


  0%
        6 to 10           11 to 14   15 to 24   25 to 34   35 to 44   45+
% point
          -1%               +5%        -5%        -7%        -9%      -2%
Change                                                                        13
% PLAY ANY APP GAMES
Base: all 6+ population
100%
             % Play...                                            % Q3 2012

75%
                                                                  % Q4 2011
                                        APPS


50%


25%


  0%
        6 to 10           11 to 14   15 to 24   25 to 34   35 to 44   45+
% point +9%                +11%        +1%        +2%        +2%      +2%
Change                                                                        14
% PLAY ANY ONLINE GAMES
Base: all 6+ population
100%
             % Play...                                            % Q3 2012

75%
                                                                  % Q4 2011
                                      ONLINE


50%


25%


  0%
        6 to 10           11 to 14   15 to 24   25 to 34   35 to 44   45+
% point
         +6%                +4%        +2%        +1%        -2%      +1%
change                                                                        15
WHAT DEVICES ARE BEING
USED TO GAME ON?


                         16
WHAT DEVICES ARE BEING USED
TO GAME ON?
Base: all 6+ population

% Play devices...                     Q3 2012                      Q4 ‘2011

                 Play any device   20m people                35%     38%


             CONSOLES                                  24%           27%


           COMPUTERS                                   24%           26%


  SMARTPHONE / iPODs                             18%                 17%


            PORTABLES                      11%                       12%


               TABLETS                7%                             4%
                                                                              17
WHAT IS DRIVING MARKET
VALUE, VOLUME, AND TIME


                          18
% SHARE OF TOTAL MARKET: VALUE
Base: 11+ in the UK,

                       % SHARE OF
                       TOTAL VALUE

                               £972m   £292m   £235m   £321m

              ONLINE


              APPS


              PACKAGED


                              Q4 2011 Q1 2012 Q2 2012 Q3 2012
                                                                19
% SHARE OF TOTAL MARKET: VOLUME
Base: 11+ in the UK,

             % SHARE OF
             VOLUME

                            93m     49m     40m    51m


              ONLINE


              APPS


              PACKAGED


                          Q4 2011 Q1 2012 Q2 2012 Q3 2012
                                                            20
% SHARE OF TOTAL MARKET: GAMING TIME
Base: 11+ in the UK,

              % SHARE TOTAL GAMING TIME IN TYPICAL WEEK

                           154m         155m        160m     156m
                          hrs/wk       hrs/wk      hrs/wk   hrs/wk


              ONLINE


              APPS


              PACKAGED


                         Q4 2011 Q1 2012 Q2 2012 Q3 2012
                                                                     21
WHAT IS DRIVING THE SHARE OF TIME IN THE
GAMES MARKET?
            % SHARE TOTAL
            GAMING TIME
                                          Q3 2012
                                                    Portable   5%    Console
                                                                     PS3          11%
                        Downloads 7%                           34%
            Paid Free                               Console          Xbox 360     X%
  Console   X%   X% Game sites 5%                                    Wii          X%
    PC      X%   X%                                  PC/Mac          Other
                        Social 11%                             12%                X%
  Other     X%   X%
   Total    X%   X%
                                            156m
                        Multiplayer 11%    hrs/wk
                            Other
                                                     Other
                                                    Android    4%    Paid Free
                                                                     X%      X%

                                                        iOS    10%   Paid Free
                                                                     X%      X%

                                                                                        22
WHAT IS THE MACRO VIEW
OF THE MARKET NOW?


                         23
WHERE IS THE MARKET NOW?
Base: all 11+ population

                                            Size of the bubble is the share total value of market
                                                                                                    Q3 2012
  PLAY REACH - % PLAY IN POPULATION


                                                                                                    Q2 2012


                                                                                                    Q1 2012


                                                                                                    Q4 2011


                                      TIME SPENT – % SHARE OF TOTAL GAMER HOURS
                                                                                                              24
D2, B3
IN SUMMARY


             25
IN SUMMARY

Gaming is an increasingly complex and currently fragmented market


Kids embrace multiple gaming formats, indicating where the market is heading


What drives market VALUE is not the same as what drives VOLUME and TIME


Market dynamics shifting: low revenue formats take significant share of time


HOW WILL THESE DYNAMICS TREND OVER TIME AND WHAT ARE THE LONG
TERM IMPACTS?
                                                                               26
February 2013


  Thriving in the Mobile First Economy


  Richard Firminger, GM, EMEA
Topics

   Flurry Background and Services

   App Consumption Trends WW

   Freemium, Virtual Goods, Advertising & ARPDAU

   Loyalty Matrix by Games Genre
Flurry Track Record

   Number 1 Mobile Reach
   Monthly Unique Users     850M


   Number 1 Analytics
   Application Developers    95K
   Applications             290K

   Monthly Unique
                             74B
   Sessions


   Number 2 Ad Network
   Monthly Clips            130M
Flurry Two-Sided Advertising Platform


            • Publishers: Direct, Indirect, desk-traded ad monetization
            • Advertisers: Ad effectiveness, measurement and ROI analysis
            • Built-in network effects
Unstoppable Market Growth
Worldwide in-application events measured by Flurry (billions)
    1,200

    1,100

    1,000

     900

     800

     700

     600

     500

     400

     300

     200

     100

       -
            May Jul Sep Nov Jan Mar May Jul Sep Nov Jan Mar May Jul Sep Nov Jan Mar May Jul Sep Nov Jan Mar May Jul Sep Nov
            08 08 08 08 09 09 09 09 09 09 10 10 10 10 10 10 11 11 11 11 11 11 12 12 12 12 12 12

                                                                          Source: Flurry Analytics, May 2008 – November 2012, Billions
Competition for Consumers Continues to Increase
Over 1.4 million available apps on iOS and Android

        GOOGLE PLAY                iTUNES APP STORE                                                                    700
                                                                                                                 675
                                                                                                         650
                                                                                           600     600

                                                                            500
                                                                                     460
                                                                425
                                                    400
                                                                      350

                                      250                 250
                                              200
                       160
                                80
         28       20
    2
   March 2009   December 2009   August 2010   May 2011    July 2011   October 2011    April 2012    June 2012   September 2012


                                                                                  Sources: Google, Apple; number in thousands
Addressable Market to Surpass 1 Billion Next Year
Active smartphone & tablet devices
    Total Addressable Market
    Aggressive: 5B WW Mobile Device Owners
    Conservative: 2B WW Adults, Middle Class or higher
                                                                         1.1 B
    Upside:
    Smartphones – dropping prices, especially Android
    Tablets – little replacement, mainly new; sub for PCs
    Connected TVs – to be shipped
    Reference:
                                                             800 M
    2.3 Billion Internet Subscribers today


                                                   331 M

                               76 M
          23 M
        Aug 2009             Aug 2010             Aug 2011   Aug 2012   Aug 2013E

                                                                          Source: Flurry Analytics
A Global Phenomenon
Top Countries by Active iOS & Android Devices (millions)
     181
             167


                     35      28       27         22       19           19            14            14

      US     China   UK     Japan   S. Korea   Germany   France     Canada          Brazil        Spain

                                                             Source: Flurry Analytics active devices Oct 2012
30+ Countries Doubled in Last 12 Months
Fastest Growing iOS & Android Markets by Active Devices

    293%
             269%      260%
                                   235%
                                                 209%          202%           197%
                                                                                            181%          180%           180%


     China   Vietnam   Colombia      Chile        Ukraine      Venezuela       Turkey      Philippines      Egypt         Russia

                             Source: Flurry Analytics, Oct 2011 – Oct 2012, countries with at least 500k active devices as of Oct 2011
App Economy Expanding Internationally
Distribution of iOS and Android App Sessions
     100%


                          25%
      90%

      80%                                                              32%
      70%

      60%                 27%
      50%                                                              39%
      40%


                          48%
      30%

      20%

      10%                                                              29%
      0%

                          Oct 2011                                     Oct 2012


             UNITED STATES (TOP RANK)   REST OF TOP 10 (RANKS 2 – 9)       REST OF WORLD

                                                                                    Source: Flurry Analytics
How Mobile Stacks Up Against TV and The Web
Web vs. Mobile App vs. TV Consumption, Minutes per Day
     180

     160

     140                    162                     168                                      168
     120

     100
                                                                                  127
      80
                                          94
      60

      40
            70    66              72                                    70
      20

      -
                 Dec 2010               Dec 2011                                Dec 2012

                   Web Browsing        Mobile Applications                         Television

                                       Sources: comScore, Alexa, U.S. Bureau of Labor Statistics, Flurry Analytics
Tablet Usage More Games & Entertainment Oriented
Time Spent per Category, Smartphones versus Tablets
                                                         Productivity
        Entertainment                               News     1%
             3%                                      2%
                           Other                                        Other
   Lifestyle                                    Utilities
                           11%                                           7%
      3%                                          4%
   Health &
   Fitness
                                        Games           Entertainment
     3%
                                         39%                 9%
                                                         Social
              Utilities                                Networking
               17%                                        10%
                                                                                    Games
                                                                                     67%
                             Social
                           Networking
                              24%


                          Smartphones                                     Tablets
App Revenue Is Scaling

            20
 Billions


            18
            16
            14
            12
            10
            8
            6
            4
            2
            0
                 2008   2009             2010      2011                 2012

                         Virtual Goods          Advertising

                                                      Source: eMarketer, Mary Meeker (KPCB)
Gaming: Money, Midcore and Maturity
 ARPDAU among top 1,000 grossing iOS free-to-play games

      Over $0.75, 3%


                                             Over $0.75,
      $0.25 - $0.75                             15%
          15%

                                                                   Under $0.25,
                                                                      53%
                                         $0.25 - $0.75
                        Under $0.25,
                                             32%
                           82%


                  Sep 2011                           Sep 2012

                                                  Source: Flurry Analytics, 480 free-to-play games
Loyalty by Application Category
Mobile Game Loyalty Matrix (Freemium, iOS)
Mobile Game Age & Gender Matrix
(Freemium, iOS)

Mais conteúdo relacionado

Destaque

Grid Logistics - Asia - 4
Grid Logistics - Asia - 4Grid Logistics - Asia - 4
Grid Logistics - Asia - 4cneill6
 
զատիկը տարբեր երկրներում
զատիկը տարբեր երկրներումզատիկը տարբեր երկրներում
զատիկը տարբեր երկրներումAnushikNikoghosyan
 
Pemanfaatan lingkungan sekitar
Pemanfaatan lingkungan sekitarPemanfaatan lingkungan sekitar
Pemanfaatan lingkungan sekitarAsri Saputra
 
Reseach
ReseachReseach
Reseachpoo999
 
Pemanfaatan lingkungan sekitar
Pemanfaatan lingkungan sekitarPemanfaatan lingkungan sekitar
Pemanfaatan lingkungan sekitarAsri Saputra
 
ներկայացնում եմ ձեզ մի քանի փաստեր տարբեր երկրների
ներկայացնում եմ ձեզ մի քանի փաստեր տարբեր երկրներիներկայացնում եմ ձեզ մի քանի փաստեր տարբեր երկրների
ներկայացնում եմ ձեզ մի քանի փաստեր տարբեր երկրներիAnushikNikoghosyan
 
Pemanfaatan lingkungan sekitar
Pemanfaatan lingkungan sekitarPemanfaatan lingkungan sekitar
Pemanfaatan lingkungan sekitarAsri Saputra
 
Legal Practicing as a Freelance Designer
Legal Practicing as a Freelance DesignerLegal Practicing as a Freelance Designer
Legal Practicing as a Freelance DesignerinkCreativeStudio
 
Realizzazione di una base di dati per la memorizzazione di dati provenienti d...
Realizzazione di una base di dati per la memorizzazione di dati provenienti d...Realizzazione di una base di dati per la memorizzazione di dati provenienti d...
Realizzazione di una base di dati per la memorizzazione di dati provenienti d...mfurlanetto
 
Հողաթափիկ Ինփուզորիա
Հողաթափիկ ԻնփուզորիաՀողաթափիկ Ինփուզորիա
Հողաթափիկ ԻնփուզորիաAnushikNikoghosyan
 
Comportamientos digitales
Comportamientos digitalesComportamientos digitales
Comportamientos digitalesLuisaJuya
 

Destaque (20)

Presentacion acl low
Presentacion acl lowPresentacion acl low
Presentacion acl low
 
ջրիմուռներ123
ջրիմուռներ123ջրիմուռներ123
ջրիմուռներ123
 
Grid Logistics - Asia - 4
Grid Logistics - Asia - 4Grid Logistics - Asia - 4
Grid Logistics - Asia - 4
 
Grqer
GrqerGrqer
Grqer
 
քիմիա
քիմիաքիմիա
քիմիա
 
Praising failure, not perfection
Praising failure, not perfectionPraising failure, not perfection
Praising failure, not perfection
 
զատիկը տարբեր երկրներում
զատիկը տարբեր երկրներումզատիկը տարբեր երկրներում
զատիկը տարբեր երկրներում
 
Pemanfaatan lingkungan sekitar
Pemanfaatan lingkungan sekitarPemanfaatan lingkungan sekitar
Pemanfaatan lingkungan sekitar
 
Reseach
ReseachReseach
Reseach
 
Pemanfaatan lingkungan sekitar
Pemanfaatan lingkungan sekitarPemanfaatan lingkungan sekitar
Pemanfaatan lingkungan sekitar
 
ներկայացնում եմ ձեզ մի քանի փաստեր տարբեր երկրների
ներկայացնում եմ ձեզ մի քանի փաստեր տարբեր երկրներիներկայացնում եմ ձեզ մի քանի փաստեր տարբեր երկրների
ներկայացնում եմ ձեզ մի քանի փաստեր տարբեր երկրների
 
Pemanfaatan lingkungan sekitar
Pemanfaatan lingkungan sekitarPemanfaatan lingkungan sekitar
Pemanfaatan lingkungan sekitar
 
Rosita Forbes Bio
Rosita Forbes BioRosita Forbes Bio
Rosita Forbes Bio
 
Stefania
StefaniaStefania
Stefania
 
Legal Practicing as a Freelance Designer
Legal Practicing as a Freelance DesignerLegal Practicing as a Freelance Designer
Legal Practicing as a Freelance Designer
 
Realizzazione di una base di dati per la memorizzazione di dati provenienti d...
Realizzazione di una base di dati per la memorizzazione di dati provenienti d...Realizzazione di una base di dati per la memorizzazione di dati provenienti d...
Realizzazione di una base di dati per la memorizzazione di dati provenienti d...
 
միգրացիա3
միգրացիա3միգրացիա3
միգրացիա3
 
Հողաթափիկ Ինփուզորիա
Հողաթափիկ ԻնփուզորիաՀողաթափիկ Ինփուզորիա
Հողաթափիկ Ինփուզորիա
 
Comportamientos digitales
Comportamientos digitalesComportamientos digitales
Comportamientos digitales
 
Presentation1 (7)
Presentation1 (7)Presentation1 (7)
Presentation1 (7)
 

Último

Scanning the Internet for External Cloud Exposures via SSL Certs
Scanning the Internet for External Cloud Exposures via SSL CertsScanning the Internet for External Cloud Exposures via SSL Certs
Scanning the Internet for External Cloud Exposures via SSL CertsRizwan Syed
 
The Role of FIDO in a Cyber Secure Netherlands: FIDO Paris Seminar.pptx
The Role of FIDO in a Cyber Secure Netherlands: FIDO Paris Seminar.pptxThe Role of FIDO in a Cyber Secure Netherlands: FIDO Paris Seminar.pptx
The Role of FIDO in a Cyber Secure Netherlands: FIDO Paris Seminar.pptxLoriGlavin3
 
Unleash Your Potential - Namagunga Girls Coding Club
Unleash Your Potential - Namagunga Girls Coding ClubUnleash Your Potential - Namagunga Girls Coding Club
Unleash Your Potential - Namagunga Girls Coding ClubKalema Edgar
 
Transcript: New from BookNet Canada for 2024: BNC CataList - Tech Forum 2024
Transcript: New from BookNet Canada for 2024: BNC CataList - Tech Forum 2024Transcript: New from BookNet Canada for 2024: BNC CataList - Tech Forum 2024
Transcript: New from BookNet Canada for 2024: BNC CataList - Tech Forum 2024BookNet Canada
 
Developer Data Modeling Mistakes: From Postgres to NoSQL
Developer Data Modeling Mistakes: From Postgres to NoSQLDeveloper Data Modeling Mistakes: From Postgres to NoSQL
Developer Data Modeling Mistakes: From Postgres to NoSQLScyllaDB
 
Gen AI in Business - Global Trends Report 2024.pdf
Gen AI in Business - Global Trends Report 2024.pdfGen AI in Business - Global Trends Report 2024.pdf
Gen AI in Business - Global Trends Report 2024.pdfAddepto
 
DevEX - reference for building teams, processes, and platforms
DevEX - reference for building teams, processes, and platformsDevEX - reference for building teams, processes, and platforms
DevEX - reference for building teams, processes, and platformsSergiu Bodiu
 
Passkey Providers and Enabling Portability: FIDO Paris Seminar.pptx
Passkey Providers and Enabling Portability: FIDO Paris Seminar.pptxPasskey Providers and Enabling Portability: FIDO Paris Seminar.pptx
Passkey Providers and Enabling Portability: FIDO Paris Seminar.pptxLoriGlavin3
 
DSPy a system for AI to Write Prompts and Do Fine Tuning
DSPy a system for AI to Write Prompts and Do Fine TuningDSPy a system for AI to Write Prompts and Do Fine Tuning
DSPy a system for AI to Write Prompts and Do Fine TuningLars Bell
 
Take control of your SAP testing with UiPath Test Suite
Take control of your SAP testing with UiPath Test SuiteTake control of your SAP testing with UiPath Test Suite
Take control of your SAP testing with UiPath Test SuiteDianaGray10
 
The Ultimate Guide to Choosing WordPress Pros and Cons
The Ultimate Guide to Choosing WordPress Pros and ConsThe Ultimate Guide to Choosing WordPress Pros and Cons
The Ultimate Guide to Choosing WordPress Pros and ConsPixlogix Infotech
 
Streamlining Python Development: A Guide to a Modern Project Setup
Streamlining Python Development: A Guide to a Modern Project SetupStreamlining Python Development: A Guide to a Modern Project Setup
Streamlining Python Development: A Guide to a Modern Project SetupFlorian Wilhelm
 
SAP Build Work Zone - Overview L2-L3.pptx
SAP Build Work Zone - Overview L2-L3.pptxSAP Build Work Zone - Overview L2-L3.pptx
SAP Build Work Zone - Overview L2-L3.pptxNavinnSomaal
 
How to write a Business Continuity Plan
How to write a Business Continuity PlanHow to write a Business Continuity Plan
How to write a Business Continuity PlanDatabarracks
 
Hyperautomation and AI/ML: A Strategy for Digital Transformation Success.pdf
Hyperautomation and AI/ML: A Strategy for Digital Transformation Success.pdfHyperautomation and AI/ML: A Strategy for Digital Transformation Success.pdf
Hyperautomation and AI/ML: A Strategy for Digital Transformation Success.pdfPrecisely
 
TrustArc Webinar - How to Build Consumer Trust Through Data Privacy
TrustArc Webinar - How to Build Consumer Trust Through Data PrivacyTrustArc Webinar - How to Build Consumer Trust Through Data Privacy
TrustArc Webinar - How to Build Consumer Trust Through Data PrivacyTrustArc
 
DevoxxFR 2024 Reproducible Builds with Apache Maven
DevoxxFR 2024 Reproducible Builds with Apache MavenDevoxxFR 2024 Reproducible Builds with Apache Maven
DevoxxFR 2024 Reproducible Builds with Apache MavenHervé Boutemy
 
Transcript: New from BookNet Canada for 2024: Loan Stars - Tech Forum 2024
Transcript: New from BookNet Canada for 2024: Loan Stars - Tech Forum 2024Transcript: New from BookNet Canada for 2024: Loan Stars - Tech Forum 2024
Transcript: New from BookNet Canada for 2024: Loan Stars - Tech Forum 2024BookNet Canada
 
Ensuring Technical Readiness For Copilot in Microsoft 365
Ensuring Technical Readiness For Copilot in Microsoft 365Ensuring Technical Readiness For Copilot in Microsoft 365
Ensuring Technical Readiness For Copilot in Microsoft 3652toLead Limited
 
What's New in Teams Calling, Meetings and Devices March 2024
What's New in Teams Calling, Meetings and Devices March 2024What's New in Teams Calling, Meetings and Devices March 2024
What's New in Teams Calling, Meetings and Devices March 2024Stephanie Beckett
 

Último (20)

Scanning the Internet for External Cloud Exposures via SSL Certs
Scanning the Internet for External Cloud Exposures via SSL CertsScanning the Internet for External Cloud Exposures via SSL Certs
Scanning the Internet for External Cloud Exposures via SSL Certs
 
The Role of FIDO in a Cyber Secure Netherlands: FIDO Paris Seminar.pptx
The Role of FIDO in a Cyber Secure Netherlands: FIDO Paris Seminar.pptxThe Role of FIDO in a Cyber Secure Netherlands: FIDO Paris Seminar.pptx
The Role of FIDO in a Cyber Secure Netherlands: FIDO Paris Seminar.pptx
 
Unleash Your Potential - Namagunga Girls Coding Club
Unleash Your Potential - Namagunga Girls Coding ClubUnleash Your Potential - Namagunga Girls Coding Club
Unleash Your Potential - Namagunga Girls Coding Club
 
Transcript: New from BookNet Canada for 2024: BNC CataList - Tech Forum 2024
Transcript: New from BookNet Canada for 2024: BNC CataList - Tech Forum 2024Transcript: New from BookNet Canada for 2024: BNC CataList - Tech Forum 2024
Transcript: New from BookNet Canada for 2024: BNC CataList - Tech Forum 2024
 
Developer Data Modeling Mistakes: From Postgres to NoSQL
Developer Data Modeling Mistakes: From Postgres to NoSQLDeveloper Data Modeling Mistakes: From Postgres to NoSQL
Developer Data Modeling Mistakes: From Postgres to NoSQL
 
Gen AI in Business - Global Trends Report 2024.pdf
Gen AI in Business - Global Trends Report 2024.pdfGen AI in Business - Global Trends Report 2024.pdf
Gen AI in Business - Global Trends Report 2024.pdf
 
DevEX - reference for building teams, processes, and platforms
DevEX - reference for building teams, processes, and platformsDevEX - reference for building teams, processes, and platforms
DevEX - reference for building teams, processes, and platforms
 
Passkey Providers and Enabling Portability: FIDO Paris Seminar.pptx
Passkey Providers and Enabling Portability: FIDO Paris Seminar.pptxPasskey Providers and Enabling Portability: FIDO Paris Seminar.pptx
Passkey Providers and Enabling Portability: FIDO Paris Seminar.pptx
 
DSPy a system for AI to Write Prompts and Do Fine Tuning
DSPy a system for AI to Write Prompts and Do Fine TuningDSPy a system for AI to Write Prompts and Do Fine Tuning
DSPy a system for AI to Write Prompts and Do Fine Tuning
 
Take control of your SAP testing with UiPath Test Suite
Take control of your SAP testing with UiPath Test SuiteTake control of your SAP testing with UiPath Test Suite
Take control of your SAP testing with UiPath Test Suite
 
The Ultimate Guide to Choosing WordPress Pros and Cons
The Ultimate Guide to Choosing WordPress Pros and ConsThe Ultimate Guide to Choosing WordPress Pros and Cons
The Ultimate Guide to Choosing WordPress Pros and Cons
 
Streamlining Python Development: A Guide to a Modern Project Setup
Streamlining Python Development: A Guide to a Modern Project SetupStreamlining Python Development: A Guide to a Modern Project Setup
Streamlining Python Development: A Guide to a Modern Project Setup
 
SAP Build Work Zone - Overview L2-L3.pptx
SAP Build Work Zone - Overview L2-L3.pptxSAP Build Work Zone - Overview L2-L3.pptx
SAP Build Work Zone - Overview L2-L3.pptx
 
How to write a Business Continuity Plan
How to write a Business Continuity PlanHow to write a Business Continuity Plan
How to write a Business Continuity Plan
 
Hyperautomation and AI/ML: A Strategy for Digital Transformation Success.pdf
Hyperautomation and AI/ML: A Strategy for Digital Transformation Success.pdfHyperautomation and AI/ML: A Strategy for Digital Transformation Success.pdf
Hyperautomation and AI/ML: A Strategy for Digital Transformation Success.pdf
 
TrustArc Webinar - How to Build Consumer Trust Through Data Privacy
TrustArc Webinar - How to Build Consumer Trust Through Data PrivacyTrustArc Webinar - How to Build Consumer Trust Through Data Privacy
TrustArc Webinar - How to Build Consumer Trust Through Data Privacy
 
DevoxxFR 2024 Reproducible Builds with Apache Maven
DevoxxFR 2024 Reproducible Builds with Apache MavenDevoxxFR 2024 Reproducible Builds with Apache Maven
DevoxxFR 2024 Reproducible Builds with Apache Maven
 
Transcript: New from BookNet Canada for 2024: Loan Stars - Tech Forum 2024
Transcript: New from BookNet Canada for 2024: Loan Stars - Tech Forum 2024Transcript: New from BookNet Canada for 2024: Loan Stars - Tech Forum 2024
Transcript: New from BookNet Canada for 2024: Loan Stars - Tech Forum 2024
 
Ensuring Technical Readiness For Copilot in Microsoft 365
Ensuring Technical Readiness For Copilot in Microsoft 365Ensuring Technical Readiness For Copilot in Microsoft 365
Ensuring Technical Readiness For Copilot in Microsoft 365
 
What's New in Teams Calling, Meetings and Devices March 2024
What's New in Teams Calling, Meetings and Devices March 2024What's New in Teams Calling, Meetings and Devices March 2024
What's New in Teams Calling, Meetings and Devices March 2024
 

Andrew Webber game apps opportunities in 2013 [source slides]

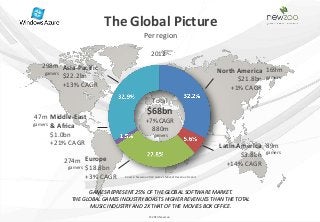
  • 1. The Global Picture Per region 2012 298m Asia-Pacific gamers North America 169m $22.2bn $21.8bn gamers +13% CAGR +1% CAGR Total $68bn 47m Middle-East +7% CAGR gamers & Africa 880m $1.0bn gamers +21% CAGR Latin America 89m $3.8bn gamers 274m Europe +14% CAGR gamers $18.8bn +3% CAGR Source: Newzoo 2012 Games Market Revenue Report GAMES REPRESENT 25% OF THE GLOBAL SOFTWARE MARKET. THE GLOBAL GAMES INDUSTRY BOASTS HIGHER REVENUES THAN THE TOTAL MUSIC INDUSTRY AND 2X THAT OF THE MOVIES BOX OFFICE. © 2013 Newzoo
  • 2. The Global Picture Per Market Segment Casual Websites PC/Mac Download $4.2bn $7.6bn -1% CAGR +2% CAGR Social Networks $3.9bn +5% CAGR PC/Mac Boxed Total $8.0bn Mobile $68bn Devices -11% CAGR +7% CAGR 9.0bn +32% CAGR Consoles $21.2 MMOs -2% CAGR $13.6bn Source: Newzoo 2012 Games Market Revenue Report +21% CAGR © 2013 Newzoo
  • 3. Microsoft is Already a Leader But Dramatic Market Changes Spark Opportunities for All Business Units © 2013 Newzoo
  • 4. Kings of Free-to-Play New companies set up to manage games-as-a-service ALL GAMES ARE MULTIPLAYER AND CONTINUOSLY RUN AND CONNECTED THROUGH THE CLOUD. FREE-TO-PLAY | PLATFORM/SCREEN: PC PUBLISHER: RIOTGAMES (US) OWNED BY TENCENT (CHINA) LAUNCH: OCTOBER 2009 MONTHLY ACTIVE PLAYERS: +/- 35,000,000 MONTHLY REVENUES: +/- $40,000,000 FREE-TO-PLAY | PLATFORM/SCREEN: PC PUBLISHER: WARGAMING.NET (RUSSIA) LAUNCH: APRIL 2008 MONTHLY ACTIVE PLAYERS: +/- 13,000,000 MONTHLY REVENUES: +/- $55,000,000 ESTIMATED PROFIT/MONTH: $25,000,000 ESTIMATED CLOUD COSTS/MONTH: $1.5-2M, $3-4M incl hardware FREE-TO-PLAY | PLATFORM/SCREEN: SMARTPHONE, TABLET PUBLISHER: SUPERCELL (FINLAND) LAUNCH: AUGUST 2012 MONTHLY DOWNLOADS: +/- 4,000,000 MONTHLY REVENUES: +/- $15,000,000 © 2013 Newzoo
  • 5. Time is Money eSports and Spectator Mode double time spent and load on the cloud Prize money season 2: $5,000,000 Video Watch live games of gamers that are (slightly) better than you. © 2013 Newzoo
  • 6. Mobile Games Market tablet and smartphone games (global, 2012) $9bn +32% >500M CONSUMER SPEND ANNUAL GROWTH MOBILE PLAYERS >175M PAYING PLAYERS 33% OF ALL* 66% OF ALL* DOWNLOADS MONEY $ TO SMARTPHONES SPENT ON SMARTPHONES AND TABLETS WERE AND TABLETS WAS SPENT ON GAMES *BASED ON iOS APP STORE DATA IN 44 COUNTRIES & PLAYSTORE GAMES DATA OF 17 COUNTRIES © 2013 Distimo/Newzoo
  • 7. UK Market Overview Quarter 3 2012 - selected results Ukie Event: 24 Jan Ian Bramley
  • 8. WHAT IS GAMETRACK? APPS ONLINE PACKAGED FREE APPS SOCIAL DISC/CART PAID APPS FREE DOWNLOAD NEW PAID EXTRAS PAID DOWNLOAD PRE OWNED PAID EXTRAS RENTAL MULTIPLAYER BROWSER TIME SPENT ACQUISITION VALUE
  • 9. HOW DO WE DO IT? MONTHLY FIELDWORK PER MARKET 1,000 Nat Rep 1,000 Online Face to Face Rep SAMPLES COMBINED AND WEIGHTED TO BE NATIONALLY REPRESENTATIVE AGED 6+ REPORTING QUARTERLY PER MARKET ON 6,000+ INTERVIEWS 24,000 INTERVIEWS PER QUARTER ACROSS EUROPE from Q3 2012 from Q1 2013 9
  • 11. WHAT ARE THE MAIN FORMS OF GAMING? Base: all 6+ population % Play... Q3 2012 Q4 ‘11 Any video gaming 20m people 35% 38% ANY Packaged 22% 26% ANY Apps 14% 12% ANY Online 19% 18% Downloads 8% 8% Social 8% 8% Multiplayer 8% 8% Browser game sites 8% 6% 11
  • 13. % PLAY ANY PACKAGED GAMES Base: all 6+ population 100% % Play... % Q3 2012 75% % Q4 2011 PACKAGED 50% 25% 0% 6 to 10 11 to 14 15 to 24 25 to 34 35 to 44 45+ % point -1% +5% -5% -7% -9% -2% Change 13
  • 14. % PLAY ANY APP GAMES Base: all 6+ population 100% % Play... % Q3 2012 75% % Q4 2011 APPS 50% 25% 0% 6 to 10 11 to 14 15 to 24 25 to 34 35 to 44 45+ % point +9% +11% +1% +2% +2% +2% Change 14
  • 15. % PLAY ANY ONLINE GAMES Base: all 6+ population 100% % Play... % Q3 2012 75% % Q4 2011 ONLINE 50% 25% 0% 6 to 10 11 to 14 15 to 24 25 to 34 35 to 44 45+ % point +6% +4% +2% +1% -2% +1% change 15
  • 16. WHAT DEVICES ARE BEING USED TO GAME ON? 16
  • 17. WHAT DEVICES ARE BEING USED TO GAME ON? Base: all 6+ population % Play devices... Q3 2012 Q4 ‘2011 Play any device 20m people 35% 38% CONSOLES 24% 27% COMPUTERS 24% 26% SMARTPHONE / iPODs 18% 17% PORTABLES 11% 12% TABLETS 7% 4% 17
  • 18. WHAT IS DRIVING MARKET VALUE, VOLUME, AND TIME 18
  • 19. % SHARE OF TOTAL MARKET: VALUE Base: 11+ in the UK, % SHARE OF TOTAL VALUE £972m £292m £235m £321m ONLINE APPS PACKAGED Q4 2011 Q1 2012 Q2 2012 Q3 2012 19
  • 20. % SHARE OF TOTAL MARKET: VOLUME Base: 11+ in the UK, % SHARE OF VOLUME 93m 49m 40m 51m ONLINE APPS PACKAGED Q4 2011 Q1 2012 Q2 2012 Q3 2012 20
  • 21. % SHARE OF TOTAL MARKET: GAMING TIME Base: 11+ in the UK, % SHARE TOTAL GAMING TIME IN TYPICAL WEEK 154m 155m 160m 156m hrs/wk hrs/wk hrs/wk hrs/wk ONLINE APPS PACKAGED Q4 2011 Q1 2012 Q2 2012 Q3 2012 21
  • 22. WHAT IS DRIVING THE SHARE OF TIME IN THE GAMES MARKET? % SHARE TOTAL GAMING TIME Q3 2012 Portable 5% Console PS3 11% Downloads 7% 34% Paid Free Console Xbox 360 X% Console X% X% Game sites 5% Wii X% PC X% X% PC/Mac Other Social 11% 12% X% Other X% X% Total X% X% 156m Multiplayer 11% hrs/wk Other Other Android 4% Paid Free X% X% iOS 10% Paid Free X% X% 22
  • 23. WHAT IS THE MACRO VIEW OF THE MARKET NOW? 23
  • 24. WHERE IS THE MARKET NOW? Base: all 11+ population Size of the bubble is the share total value of market Q3 2012 PLAY REACH - % PLAY IN POPULATION Q2 2012 Q1 2012 Q4 2011 TIME SPENT – % SHARE OF TOTAL GAMER HOURS 24 D2, B3
  • 26. IN SUMMARY Gaming is an increasingly complex and currently fragmented market Kids embrace multiple gaming formats, indicating where the market is heading What drives market VALUE is not the same as what drives VOLUME and TIME Market dynamics shifting: low revenue formats take significant share of time HOW WILL THESE DYNAMICS TREND OVER TIME AND WHAT ARE THE LONG TERM IMPACTS? 26
  • 27. February 2013 Thriving in the Mobile First Economy Richard Firminger, GM, EMEA
  • 28. Topics Flurry Background and Services App Consumption Trends WW Freemium, Virtual Goods, Advertising & ARPDAU Loyalty Matrix by Games Genre
  • 29. Flurry Track Record Number 1 Mobile Reach Monthly Unique Users 850M Number 1 Analytics Application Developers 95K Applications 290K Monthly Unique 74B Sessions Number 2 Ad Network Monthly Clips 130M
  • 30. Flurry Two-Sided Advertising Platform • Publishers: Direct, Indirect, desk-traded ad monetization • Advertisers: Ad effectiveness, measurement and ROI analysis • Built-in network effects
  • 31. Unstoppable Market Growth Worldwide in-application events measured by Flurry (billions) 1,200 1,100 1,000 900 800 700 600 500 400 300 200 100 - May Jul Sep Nov Jan Mar May Jul Sep Nov Jan Mar May Jul Sep Nov Jan Mar May Jul Sep Nov Jan Mar May Jul Sep Nov 08 08 08 08 09 09 09 09 09 09 10 10 10 10 10 10 11 11 11 11 11 11 12 12 12 12 12 12 Source: Flurry Analytics, May 2008 – November 2012, Billions
  • 32. Competition for Consumers Continues to Increase Over 1.4 million available apps on iOS and Android GOOGLE PLAY iTUNES APP STORE 700 675 650 600 600 500 460 425 400 350 250 250 200 160 80 28 20 2 March 2009 December 2009 August 2010 May 2011 July 2011 October 2011 April 2012 June 2012 September 2012 Sources: Google, Apple; number in thousands
  • 33. Addressable Market to Surpass 1 Billion Next Year Active smartphone & tablet devices Total Addressable Market Aggressive: 5B WW Mobile Device Owners Conservative: 2B WW Adults, Middle Class or higher 1.1 B Upside: Smartphones – dropping prices, especially Android Tablets – little replacement, mainly new; sub for PCs Connected TVs – to be shipped Reference: 800 M 2.3 Billion Internet Subscribers today 331 M 76 M 23 M Aug 2009 Aug 2010 Aug 2011 Aug 2012 Aug 2013E Source: Flurry Analytics
  • 34. A Global Phenomenon Top Countries by Active iOS & Android Devices (millions) 181 167 35 28 27 22 19 19 14 14 US China UK Japan S. Korea Germany France Canada Brazil Spain Source: Flurry Analytics active devices Oct 2012
  • 35. 30+ Countries Doubled in Last 12 Months Fastest Growing iOS & Android Markets by Active Devices 293% 269% 260% 235% 209% 202% 197% 181% 180% 180% China Vietnam Colombia Chile Ukraine Venezuela Turkey Philippines Egypt Russia Source: Flurry Analytics, Oct 2011 – Oct 2012, countries with at least 500k active devices as of Oct 2011
  • 36. App Economy Expanding Internationally Distribution of iOS and Android App Sessions 100% 25% 90% 80% 32% 70% 60% 27% 50% 39% 40% 48% 30% 20% 10% 29% 0% Oct 2011 Oct 2012 UNITED STATES (TOP RANK) REST OF TOP 10 (RANKS 2 – 9) REST OF WORLD Source: Flurry Analytics
  • 37. How Mobile Stacks Up Against TV and The Web Web vs. Mobile App vs. TV Consumption, Minutes per Day 180 160 140 162 168 168 120 100 127 80 94 60 40 70 66 72 70 20 - Dec 2010 Dec 2011 Dec 2012 Web Browsing Mobile Applications Television Sources: comScore, Alexa, U.S. Bureau of Labor Statistics, Flurry Analytics
  • 38. Tablet Usage More Games & Entertainment Oriented Time Spent per Category, Smartphones versus Tablets Productivity Entertainment News 1% 3% 2% Other Other Lifestyle Utilities 11% 7% 3% 4% Health & Fitness Games Entertainment 3% 39% 9% Social Utilities Networking 17% 10% Games 67% Social Networking 24% Smartphones Tablets
  • 39. App Revenue Is Scaling 20 Billions 18 16 14 12 10 8 6 4 2 0 2008 2009 2010 2011 2012 Virtual Goods Advertising Source: eMarketer, Mary Meeker (KPCB)
  • 40. Gaming: Money, Midcore and Maturity ARPDAU among top 1,000 grossing iOS free-to-play games Over $0.75, 3% Over $0.75, $0.25 - $0.75 15% 15% Under $0.25, 53% $0.25 - $0.75 Under $0.25, 32% 82% Sep 2011 Sep 2012 Source: Flurry Analytics, 480 free-to-play games
  • 42. Mobile Game Loyalty Matrix (Freemium, iOS)
  • 43. Mobile Game Age & Gender Matrix (Freemium, iOS)

Notas do Editor

  1. At the overall level it is interesting to see levels of gaming but how do these levels differ by AGE
  2. The idea – dev should consider the METRICS and DEMOGRAPHICS of genresDo RESOURCES and capabilities align? Your DESIGNER has a kick-ass PvP or Endless Runner. Can you address the PREDICTABLE behaviors of that genre? Can you Acquire, Retain, and Monetize? Optimizing a game, team, and live operations AROUND METRICS. Should be CRITICAL to business strategy Going to give MARKET data to set context. Then new RESEARCH. research we just released this morning on the specific retention, usage metrics, and demographics of nine of the most popular free2play genres.
  3. This overcrowding increased the competition for consumers. There has beenan explosion in the number of apps across Android and iOS. Today, there are over a million unique apps to choose from. With this kind of competition for shelf space and consumers, no wonder discovery is top of mind for every developer around the world.
  4. 487 in Feb519 in March529 in April
  5. With all these apps…FEAR not…games STILL RULE rule!Phones productive 20% of time. LESS on tablets. These are GAMING devices! SUPERCELL is tablet-first. iPad = iPhone revenue
  6. Recently, Flurry examined key loyalty metrics for a wide range of apps. PEEL the ONION on the games category. Examine GENRESHow do METRICS differ? WHO is playing each?
  7. Quadrant 1 - “sweet spot” – used INTENSIVELY for long DURATION. Manyimpressions, but also IAP. APPOINTMENT mechanics to maintain and progress their experience. SOCIAL mechanics + CLASSIC gameplay “evergreen” gameplay for Social Turn-Based. RE-ENGAGEMENTQuad 2 – STRATEGY. not for FAINT ofheartThe audience is DEMANDING,lifecycles are short, LIVE SERVICES must be flawless. MVP not good enoughPvP and PACEChurn through CONTENT quickly. Have content readyQuad 3 – FICKLE and fewer sessions to monetizeCard-Battle impressive given short timeframe. TARGETED user acquisition. Most drop off quickly due to the “hardcore”Quad 4 – EASY, REPEATABLE for years. Low IAP b/c lack DEPTHSubstantialADVERTISING X-PROMO
  8. Quadrant I middle-aged FEMALES, attractive retention and usage metrics.  Quadrant II - males GRADUATE to poker Quadrant III – HOT sector. Young, male “core” gamers coming to the devices and opening WALLETSDifficult to corral, but can monetize amazingly. Quadrant IV - younger females, more INVOLVED gameplay than middle-agedYOUNGEST quick solo experience of the Endless genreLatetwenties / early thirties use gameplay mechanics and SOCIAL