Continental Precious Minerals
•
0 gostou•395 visualizações

Continental Precious Minerals is a Canadian exploration company focused on mineral properties in Sweden. It has defined an inferred resource at its flagship Viken property of over 2.8 billion tonnes containing uranium, nickel, molybdenum, and vanadium. Recent testing demonstrated recovery rates over 90% for some metals. Management owns about 9% of shares and compensation is weighted towards stock and options. The stock performance has outperformed peers over 3 months but underperformed over longer periods.

Recomendados
Mais conteúdo relacionado
Mais procurados
Mais procurados (20)
Destaque
Destaque (11)
Último
Último (20)
Continental Precious Minerals
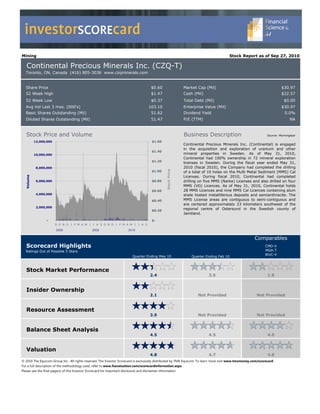
- 1. investorSCOREcard Mining Stock Report as of Sep 27, 2010 Continental Precious Minerals Inc. (CZQ-T) Toronto, ON, Canada (416) 805-3036 www.czqminerals.com Share Price $0.60 Market Cap (Mil) $30.97 52 Week High $1.47 Cash (Mil) $22.57 52 Week Low $0.37 Total Debt (Mil) $0.00 Avg Vol Last 3 mos. (000's) 103.10 Enterprise Value (Mil) $30.97 Basic Shares Outstanding (Mil) 51.62 Dividend Yield 0.0% Diluted Shares Outstanding (Mil) 51.47 P/E (TTM) NA Stock Price and Volume Business Description Source: Morningstar 12,000,000 $1.60 Continental Precious Minerals Inc. (Continental) is engaged in the acquisition and exploration of uranium and other $1.40 10,000,000 mineral properties in Sweden. As of May 31, 2010, Continental had 100% ownership in 72 mineral exploration $1.20 licenses in Sweden. During the fiscal year ended May 31, 8,000,000 Stock Price 2010 (fiscal 2010), the Company had completed the drilling $1.00 of a total of 10 holes on the Multi Metal Sediment (MMS) Cal Licenses. During fiscal 2010, Continental had completed Volume 6,000,000 $0.80 drilling on five MMS (Narke) Licenses and also drilled on four MMS (VG) Licences. As of May 31, 2010, Continental holds $0.60 28 MMS Licences and nine MMS Cal Licences containing alum 4,000,000 shale hosted metalliferous deposits and semianthracite. The $0.40 MMS License areas are contiguous to semi-contiguous and are centered approximately 23 kilometers southwest of the 2,000,000 $0.20 regional centre of Ostersund in the Swedish county of Jamtland. - $- S O N D J F M A M J J A S O N D J F M A M J J A S 2008 2009 2010 Comparables Scorecard Highlights CMD-V Ratings Out of Possible 5 Stars MGA-T WUC-V Quarter Ending May 10 Quarter Ending Feb 10 Stock Market Performance 2.4 3.5 1.8 Insider Ownership 2.1 Not Provided Not Provided Resource Assessment 3.9 Not Provided Not Provided Balance Sheet Analysis 4.5 4.5 4.0 Valuation 4.8 4.7 4.8 © 2010 The Equicom Group Inc. All rights reserved. The Investor Scorecard is exclusively distributed by TMX Equicom. To learn more visit www.tmxmoney.com/scorecard For a full description of the methodology used, refer to www.fsavaluation.com/scorecardinformation.aspx Please see the final page(s) of this Investor Scorecard for important disclosure and disclaimer information.
- 2. investorSCOREcard Continental Precious Minerals Inc. (CZQ-T) Business of the Company Continental Precious Minerals Inc. is a Canadian exploration company with a focus on Sweden. Since 2005, it has concentrated on its alum shale deposits where it has discovered a large polymetallic mineral deposit at its flagship property, called MMS Viken, and defined a NI 43-101 compliant resource. Continental has completed preliminary metallurgical test on samples of the deposit, which have demonstrated recovery rates of 90 percent for some metals. In August 2010, Continental announced the completion of testing for a preliminary economic assessment with evaluation of the results to be completed before the end of 2010. Overview of Projects Continental Precious Minerals Inc. has 69 mineral exploration licences throughout the country. Thirteen licences are for conventional hard rock uranium deposits and prospects and 55 cover multi-mineral sediment deposits and prospects hosted in alum shale formations. The company’s current focus is the advancement of its Viken licence, located near the town of Östersund in central Sweden. The Viken Licence Located in the central part of Sweden approximately 500 kilometres south of the Arctic Circle, the property subject to the Viken licence covers 677 hectares with a large multi-mineral deposit containing uranium, nickel, molybdenum and vanadium. On March 19, 2009 the company filed an NI 43-101 technical report on MMS Viken, entitled “Third Updated Technical Report on Viken MMS Licence Area, Jamtland, Kingdom of Sweden.” As seen in the table below, the MMS Viken Licence and portions of adjacent Company licences have an inferred resource estimate of 2,831 billion tonnes containing 1 billion pounds of uranium oxide (0.33 lbs/ton), 2 billion pounds of nickel (0.65 lbs/ton), 17 billion pounds of vanadium pentoxide (5.36 lbs/ton) and 1.5 billion pounds of molybdenum (0.49 lbs/ton). The resource estimate also includes an indicated resource of 24 million tonnes containing 10 million pounds of uranium oxide (0.38 lbs/ton), 17 million pounds of nickel (0.63 lbs/ton), 15 million pounds of molybdenum (0.56 lbs/ton) and 162 million pounds of vanadium pentoxide (6.25 lbs/ton). U3O8 V2O5 Mo Ni INDICATED tonnes 23,610,000 23,610,000 23,610,000 23,610,000 RESOURCE Grade (lbs/ton) 0.38 6.25 0.56 0.63 Grade (%) 0.019 0.313 0.028 0.032 lbs metal/oxide 9,944,000 162,751,000 14,678,000 16,500,000 U3O8 V2O5 Mo Ni INFERRED 2,830,757,000 2,830,757,000 2,830,757,000 2,830,757,00 tonnes RESOURCE 0 Grade (lbs/ton) 0.33 5.36 0.49 0.65 Grade (%) 0.017 0.268 0.024 0.032 lbs metal/oxide 1,037,661,000 16,716,126,000 1,516,487,000 2,015,742,00 0 (1) Mineral resources, which are not mineral reserves, do not have demonstrated economic viability. The estimate of mineral resources may be materially affected by environmental, permitting, legal, title, taxation, and socio-political, marketing or other relevant issues. (2) The quantity and grade of reported inferred resources in this estimation are uncertain in nature and there has been insufficient exploration to define these inferred resources as an indicated or measured mineral resource and it is uncertain if further exploration will result in upgrading them to an indicated or measured mineral resource category. (3) The mineral resources in this news release were estimated using the Canadian Institute of Mining, Metallurgy and Petroleum (CIM) Standards on Mineral Resources and Reserves, Definitions and Guidelines prepared by the CIM Standing Committee on Reserve Definitions and adopted by CIM Council December 11, 2005.
- 3. investorSCOREcard Continental Precious Minerals Inc. (CZQ-T) Management Ed Godin, Chief Executive Officer, President One of the founders of Continental and a veteran of mining finance, Mr. Godin has extensive knowledge and background in the mining industry. For over 20 years, he has participated in $75 million in financings for exploration projects. Rui Andrade, CGA, Vice-President and CFO Mr. Andrade has over 30 years of finance and accounting experience. Since August 2005, Mr. Andrade has been the corporate controller for the Triple M Metal group of companies, one of North America’s largest processors of ferrous and non-ferrous metals, with business interests in Canada, the United States, Europe, Asia and Mexico. Michael Bromley-Challenor, Executive VP/Director of Exploration and Development A leading expert in uranium and oil shale, Mr. Bromley-Challenor has 35 years of experience as an exploration consultant in Sweden and related projects in Europe. Since early 2005, Mr. Bromley-Challenor has been responsible for the company’s project management in Sweden. Gustav Åkerblom, Executive VP/Director of Environmental Management Before joining Continental as a consultant in 2007, Mr. Åkerblom held progressively senior positions with the Swedish Radiation Protection Authority (SSI) and is a leading radiation expert. While with the SSI, he served as Senior Geologist and Senior Radiation Officer, responsible for supervision of radon and natural radiation. Directors Patricia Sheahan, Chairman of the Board Ed Godin Gerard Osika Herb Dhaliwal Corporate Information Investor and Media Relations President and Chief Executive Officer Ed Godin Tel: (416) 805-3036 Email: godine@rogers.com http://www.czqminerals.com COMPARABLE COMPANIES Company Ticker Exchange Commander Resources ........ CMD ............ TSX-V Mega Uranium .................... MGA ............ TSX Western Uranium ................ WUC ........... TSX-V
- 4. investorSCOREcard Continental Precious Minerals Inc. (CZQ-T) Stock Market Performance Rating 2.4 Stock Market Returns 2,000,000 $8.00 1,800,000 Return Percentile Rating $7.00 Three Months 30% 82% 4.1 1,600,000 Six Months (16.7%) 25% 1.3 $6.00 1,400,000 Stock Price 1 Year 40% 95% 4.7 Volume $5.00 3 Years (CAGR) (36.8%) 1% 0.0 1,200,000 5 Years (CAGR) (2.2%) 37% 1.8 1,000,000 $4.00 800,000 Market Data 600,000 $3.00 Price $0.60 $2.00 Mkt Cap (Mil) $30.97 400,000 Shs Outstanding (Mil) 51.62 200,000 $1.00 Dividend Yield % 0.0% Avg Vol Last 3mos. (000's) 103.10 - $- 2005 2006 2007 2008 2009 2010 P/E (TTM) NA Insider Ownership Rating 2.1 Value of Shares and Options Percent of Ownership Shares Options Total Value Rating Percent Rating 9.1% Insiders * Adjusted 10.1% > 10% Holders # of # of $ Value if Adjusted $ $ Value $ Value if Rating Percent of Rating 80.8% Other Shares Options Exercised Value Exercised (Add all) Mkt. Value (Add all) Edward Godin 1,377,817 $826,690 2,640,000 $1,584,000 $792,000 $1,618,690 0.6 5.2% 1.0 President and CEO Rui Andrade Sep-10 - $0 - $0 $0 $0 0.0 0.0% 0.0 CFO Jul-10 Other Officers 195,000 $117,000 535,000 $321,000 $160,500 $277,500 0.1 0.9% 0.2 May-10 Board of Directors & Other Mar-10 Executives (excl. CEO) 355,000 $213,000 2,350,000 $1,410,000 $705,000 $918,000 0.4 3.0% 0.6 Jan-10 > 10% Holders Nov-09 4,724,800 $2,834,880 900,000 $540,000 $270,000 $3,104,880 10.1% 2.0 (For info only) Sep-09 Total (excl. >10% Holders) $3,991,570 $3,855,000 $1,927,500 $5,919,070 1.1 9.1% 1.8 0% 20% 40% 60% 80% 100% (Max of 4) (Max of 4) CEO CFO Other Officers Directors > 10% Holders Public Float * Adjusted $ Value of Options is 50% of their full value if exercised to account for volatility. Furthermore, our view is that shareholders would rather management owned shares vs. options Add: Compensation Type Category Rating Addition Percent of Compensation Share and Total Perform- Share and Salary Perform- Unit Option All Other Comp. ance Unit Option ance Bonus Awards Awards Comp. Bonus Awards Awards 14.8% Edward Godin Salary $144,000 $516,461 $107,000 $767,461 0.25 30.0% 0.0% President and CEO Bonus Rui Andrade Shares & Units $273 $20,000 $20,273 0.25 CFO Options Michael Bromley-Challenor All Other $18,400 $163,636 $182,036 0.25 EVP Exploration and Development 55.2% Total $144,000 $0 $0 $535,134 $290,636 $969,770 0.00 0.00 0.25 (Max Score) Bonus: Net Buying/Selling Last Six Months Insider Holdings Beginning and Ending Value Transactions Adjusted Share and $7,000,000 Rating $6,000,000 Option Value Buying Selling Net Bonus $5,000,000 $4,000,000 Edward Godin, President and CEO $0 $0 $0 0.00 $3,000,000 Rui Andrade, CFO $0 $0 $0 0.00 $2,000,000 Other Officers $0 $0 $0 0.00 $1,000,000 Board of Directors (excl. CEO) $0 $0 $0 0.00 $- > 10% Holders (info only) $0 $0 $0 Total (excl. >10% Holders) $0 $0 $0 0.00 (Total Score) Beg Trans- Ending Value actions Value
- 5. investorSCOREcard Continental Precious Minerals Inc. (CZQ-T) Resource Assessment Rating 3.9 Assessment Phase Viken MMS License Area 1 1 1 1 14,000,000 1 1 1 1 12,000,000 1 1 1 1 1 1 1 1 10,000,000 1 1 1 1 8,000,000 1 1 1 1 6,000,000 11,553, 0 0 0 0 679 0 0 0 0 4,000,000 0 0 0 0 2,000,000 0 0 0 0 Legend - 111,516 - - - - - - - - - Proven - - - - - - Probable Other Inferred Other Inferred Other Inferred Other Inferred Other Inferred Measured Indicated '000 Pounds of Uranium Inferred Assessment Phase Rating 1.0 Size Assessment Resource Classification of Primary Project (Viken MMS Proven Probable Measured Primary Mineral 0% 0% 0% Resource Primary Mine Mine Name Equivalent Resource Size Location Mineral Type Proven Including Byproducts Indicated 1% Probable Viken MMS License Area Finland Uranium Open Pit ##### '000 Pounds Measured Indicated Inferred Total Gold equivalent size 455,375 '000 Pounds Inferred 99% Note: Resource size is inclusive of inferred resources. Please see Assessment Phase above for categorical breakdown by project. Size Assessment Rating 5.0 Ore Grade Assessment Resource Primary Mine Primary Mineral Grade Primary Mineral Grade Equiv. incl. Byproducts Average Mine Name Equiv. Rating Location Mineral Type Inferred Indicated Measured Probable Proven Inferred Indicated Measured Probable Proven Grade Viken MMS License Area Finland Uranium Open Pit 0.02 0.02 0.19 0.21 0.19 5.0 Note: Grades for primary and byproduct minerals are scored pro forma as described in the NI 43-101 technical report without accounting for recovery rates which in some cases could be significantly below 100%. Ore Grade Assessment Rating 5.0 Regional Policy and Mineral Potential Source: Continental Precious Minerals Corporate Presentation Fraser Institute Survey Scores Out of 100 Policy Potential > 82 Mineral Exploration Licences Mine Name Resource Location Survey Results Rating > Continuing to increase land holdings Viken MMS License Area Sweden 93.8 4.7 Note: Sweden was not in the survey. > Sufficient capital to self-fund exploration Finaland was used as a proxy for Sweden. Weighted Average 93.8 4.7 Source: Fraser Institute; www.fraserinstitute.org Since 1997, The Fraser Institute has conducted an annual survey of metal mining and exploration companies to assess how mineral endowments and public policy factors such as taxation and regulation affect exploration investment. Survey results represent the opinions of executives and exploration managers in mining and mining consulting companies operating around the world. The survey now includes data on 51 jurisdictions around the world, on every continent except Antarctica, including sub-national jurisdictions in Canada, Australia, and the United States. Regional Policy and Mineral Potential Rating 4.7
- 6. investorSCOREcard Continental Precious Minerals Inc. (CZQ-T) Balance Sheet Analysis Rating 4.5 Short-Term Liquidity Quadrant 3: Quadrant 1: "RECOVERING" "OPTIMAL" $ 1.0 + VE $- 9-Aug Quadrant Rating May-09 Aug-09 Nov-09 Feb-10 May-10 ($1.0) 10-May Cash Flow (mil) 9-Nov Working Capital $ 25.9 $ 25.2 $ 24.3 $ 23.6 $ 22.6 Cash Flow Ops (Q in mil) ($0.9) ($0.2) ($0.4) ($0.5) ($0.3) ($2.0) 10-Feb Cash Flow Ops (Ann Q's in mil) ($3.5) ($0.8) ($1.4) ($1.9) ($1.0) Quadrant Rating 3.0 3.0 3.0 3.0 3.0 ($3.0) 9-May Addition to Quadrant Rating ($4.0) Our methodology accounts for the 'nearness' to improving or worsening a Company's quadrant ranking based on current cash generation/burn rate and working capital position. The Company ($5.0) - VE is DRAWING DOWN their working capital. At the current cash burn rate the Company's working ($5) $- $5 $ 10 $ 15 $ 20 $ 25 $ 30 $ 35 capital will be $0 in 262 month(s). Quadrant 2: Quadrant 4: "URGENT" "DRAWING DOWN" Add: 1.5 - VE Working Capital (mil) + VE Short-Term Liquidity Rating 4.5 Debt to Equity May-09 Aug-09 Nov-09 Feb-10 May-10 Equity Utilities Telecom Common Stock Equity Number of Companies $ 36.6 $ 36.3 $ 35.9 $ 35.6 $ 35.3 Materials Total Equity $ 36.6 $ 36.3 $ 35.9 $ 35.6 $ 35.3 Info Tech Industrials Debt and Equivalents Health Care Pref. Securities of Sub Trust - - - - - Energy Cons Staples Pref. Equity Outside Stock Equity - - - - - Cons Disc Preferred Stock Equity - - - - - Minority Interest (Bal. Sheet) - - - - - Short-Term Debt - - - - - Long-Term Debt - - - - - Capital Lease Obligations - - - - - Total Debt and Equivalents $ - $ - $ - $ - $ - 0.00 0.50 1.00 1.50 2.00 2.50 3.00 3.50 4.00 Debt to Equity 0.00 0.00 0.00 0.00 0.00 Debt to Equity Rating NA Low Risk Debt to Equity High Risk Debt to Equity Rating NA Interest Coverage May-09 Aug-09 Nov-09 Feb-10 May-10 1.0 x EBIT 0.9 x Quarterly ($1.4) ($0.3) ($0.5) ($0.8) ($0.4) 0.8 x TTM Interest Coverage ($2.8) ($2.9) ($2.9) ($3.0) ($2.0) 0.7 x 0.6 x N/A Interest Expense 0.5 x Quarterly - - - - - TTM $ 0.0 $ 0.0 - - - 0.4 x 0.3 x Interest Coverage 0.2 x Quarterly #N/A #N/A #N/A #N/A #N/A 0.1 x TTM #N/A #N/A #N/A #N/A #N/A 0.0 x May 09 Aug 09 Nov 09 Feb 10 May 10 Interest Coverage Rating Qtrly Interest Coverage Rating Quarterly TTM Interest Coverage Rating TTM Interest Coverage Rating N/A
- 7. investorSCOREcard Continental Precious Minerals Inc. (CZQ-T) Valuation Rating 4.8 Premium to Invested Capital (Lower numbers receive higher rankings) Premium to Invested Capital on Rolling 3000% Quarterly (TTM) May-09 Aug-09 Nov-09 Feb-10 May-10 Working Capital (Excl S.T. Debt) $ 25.9 $ 25.2 $ 24.3 $ 23.6 $ 22.6 2500% Long-Term Net Fixed Capital $ 10.7 $ 11.1 $ 11.7 $ 12.0 $ 12.7 Net Invested Capital $ 36.6 $ 36.3 $ 35.9 $ 35.6 $ 35.3 2000% Market Value of Equity $ 23.1 $ 30.8 $ 48.8 $ 31.5 $ 28.4 1500% Debt and Equivalents Basis $ - $ - $ - $ - $ - TTM Enterprise Value $ 23.1 $ 30.8 $ 48.8 $ 31.5 $ 28.4 1000% Premium to Invested Capital -36.7% -15.1% 35.9% -11.7% -19.5% 500% Premium to Invested Capital Rating 5.0 5.0 4.3 5.0 5.0 0% (500%) Dec Dec Nov Nov Nov Nov Nov Nov Nov Nov Nov 99 00 01 02 03 04 05 06 07 08 09 Premium to Invested Capital Rating 5.0 Price to Book (P/Book) (Lower numbers receive higher rankings) 35.0 x Annual (Fiscal Year) May-06 May-07 May-08 May-09 May-10 * Price $ 0.45 $ 0.60 $ 0.95 $ 0.61 $ 0.55 30.0 x Book Equity Per Share $ 0.50 $ 0.76 $ 0.77 $ 0.71 $ 0.68 P/Book on Quarterly 25.0 x Annual P/Book Annual P/Book Rating 4.8 4.8 4.8 4.8 4.8 20.0 x Basis Quarterly May-09 Aug-09 Nov-09 Feb-10 May-10 15.0 x * Price $ 0.45 $ 0.60 $ 0.95 $ 0.61 $ 0.55 Book Equity Per Share $ 0.71 $ 0.71 $ 0.70 $ 0.69 $ 0.68 10.0 x Quarterly P/Book 0.6 x 0.8 x 1.4 x 0.9 x 0.8 x 5.0 x Quarterly P/Book Rating 4.5 4.4 4.0 4.4 4.4 0.0 x Dec Dec Nov Nov Nov Nov Nov Nov Nov Nov Nov 99 00 01 02 03 04 05 06 07 08 09 Price to Book (P/Book) Rating 4.6 Market Implied In Situ Valuation Market Implied In Situ Valuation $0.30 Market Implied In Resource Size at Certainty Levels of Situ Valuation per $0.25 Property (Primary Mineral) Equivalent '000 Pounds resource unit (C$) $0.20 Viken MMS License Area (Ura Proven + Probable NA per Unit $0.15 Including Measured & Indicated 111,516 $0.28 Including Inferred 11,665,195 $0.00 $0.10 $0.05 $0.00 Proven + Probable Including Measured Including Inferred & Indicated NA * Price - Delayed 60 days to reflect the fact the financial statements are publicly approximately 60 days after the last day of the reporting period. For the last period the most recent price is used.
- 8. investorSCOREcard Disclosure and Disclaimer The issuer (“Issuer”) covered under this investor scorecard (“Investor Scorecard”) has paid a fee or has been charged a fee for the production and distribution of this Investor Scorecard. The fee paid or charged for the production and distribution of this Investor Scorecard was not subject to the rankings or information provided herein, nor was any securities of the Issuer accepted as payment for such fee. FSA Financial Science & Art Ltd. (“FSA”), The Equicom Group Inc. (“Equicom”) and their respective employees and directors may have had or from time to time acquire, hold or sell an interest in the listed securities of the Issuer. Unless specified otherwise, all forward looking statements in this Investor Scorecard have been approved by the Issuer, and the Issuer has advised FSA and Equicom, without independent verification by FSA or Equicom that a reasonable basis exists for such forward looking statements. Other information contained in this Investor Scorecard has been compiled by FSA or Equicom from sources believed to be reliable, which may include but not limited to, public information, research reports and discussions with management of the Issuer. Prior to its publication, this Investor Scorecard had been submitted to the management of the Issuer for review for factual accuracy. No representation or warranty, express or implied, is made by FSA, Equicom, its affiliates, any other person that provided information or data for this Investor Scorecard or any person that distributes this Investor Scorecard with respect to the adequacy, accuracy, completeness or timeliness of any information, estimates or opinions provided in this Investor Scorecard. All estimates, opinions and other information in this Investor Scorecard are provided by FSA, Equicom or another party as of the date of this Investor Scorecard. Such estimates, opinions and other information are subject to change without notice, and are provided in good faith but without any legal responsibility. Past performance is no guarantee of future results. This Investor Scorecard is provided for informational purposes only and does not constitute an offer or solicitation to buy or sell any securities discussed herein in any jurisdiction. The securities discussed in this Investor Scorecard may not be eligible for sale in some jurisdictions. This Investor Scorecard is not, and under no circumstances should be construed as, a solicitation to act as a securities broker, dealer or advisor in any jurisdiction by any person or company that is not legally permitted to carry on the business of a securities broker, dealer or advisor in that jurisdiction. Neither FSA nor Equicom is a registered investment dealer, broker or advisor, has investment banking operations or makes markets in any securities. This Investor Scorecard is prepared for general circulation and to provide an overview of Issuer’s business. This Investor Scorecard does not consider the investment objectives, financial situation or particular needs of any particular person, and is not tailored to the needs of any person receiving this Investor Scorecard. Readers of this Investor Scorecard should obtain professional advice based on their own individual circumstances before making an investment decision. Nothing in this Investor Scorecard constitutes individual investment, legal or tax advice. To the fullest extent permitted by law, FSA, Equicom, Morningstar Inc., its content providers, any other person that has provided information or data for this Investor Scorecard nor any authorized person that distributes this Investor Scorecard accepts any liability whatsoever for any direct, indirect, special, economic or consequential loss (whether in contract or tort even if FSA, Equicom or the other party has been advised of the possibility of such loss) arising from any use of, or reliance on the estimates, opinions or other information contained in this Investor Scorecard. Without limiting the generality of the foregoing, you are prohibited from using or disclosing any personal information contained in the Investor Scorecard for purposes unrelated to the purposes for which the information is made available to you and/or the public under Canadian securities laws, including, without limitation, for secondary marketing purposes, unless you have obtained any and all consents as required under applicable Canadian privacy laws. The information contained in this Investor Scorecard is copyrighted, and it may not be sold or licensed for commercial value or altered, in whole or in part, without prior express written consent of Equicom. Furthermore, Investor Scorecard can only be distributed in its entirety. Information or data herein, including any trade mark, service mark or logo is the intellectual property of FSA, Equicom, Morningstar Inc. and/or its content providers, Issuer or other persons that have provided such information or data, including but not limited to the organizations listed below and their respective content providers. This report was produced in part with information from the following organizations: