SlideShare uma empresa Scribd logo
1 de 11
Baixar para ler offline
Ubisoft® reports first-half 2010-11 results


           First-half sales up 57% to €260 million
           Improved financial results:
            - Current operating loss1: €64.9 million
            - Net loss excluding non-recurring items1: €44.5 million

           Studios’ roles and operations reorganization : €62.1 million non-recurring
            charge

           Net loss: €89.8 million

           Update on expected performance for full-year 2010-11 and the games
            release schedule.


Paris, November 15, 2010 – Today, Ubisoft released its sales and earnings figures for
the six months ended September 30, 2010.


Key financial data


    In € millions                                            H1 2010-11     %      H1 2009-10       %

    Sales                                                      260.5                 166.0
    Gross profit                                               146.2      56.1%       69.1      41.6%
    R&D expenses                                               (98.4)     -37.8%     (48.1)     -29.0%
      Selling expenses                                         (81.9)     -31.4%     (65.4)     -39.4%
      General and administrative expenses                      (30.8)     -11.8%     (33.1)     -19.9%
    SG&A expenses                                              (112.7)    -43.2%     (98.5)     -59.4%
                                         1
    Current operating income/(loss)                            (64.9)     -24.9%     (77.5)     -46.7%
    Operating income/(loss)                                    (133.8)    -51.4%     (83.0)     -50.0%
    Net income/(loss)                                          (89.8)     -34.5%     (52.0)     -31.3%

    Diluted earnings/(loss) per share (in €)                   (0.93)                (0.54)
    Diluted earnings/(loss) per share before non-recurring
                                                               (0.46)                (0.48)
    items and stock-based compensation (in €)
    Cash flows from operating activities                      (129.8)               (217.1)
    R&D investment*                                            189.9                 169.7
    Net cash/(debt)                                            (79.2)                (67.3)

* Including royalties but excluding future commitments.

1
    Before stock-based compensation.
                                                                                                1
Yves Guillemot, Chief Executive Officer, stated "Ubisoft continued to win market share
during the first nine months of 2010. Our sales figure for the first half of fiscal 2010-11
was boosted by a greater number of releases of High Definition games, solid back-
catalog sales and very positive revenue momentum from our digital activities. The
market environment continues to be tough and, although our gross profit rose sharply,
the increase was lower than we expected and we had to accelerate depreciations on
certain released titles."


Sales

Sales for the first six months of 2010-11 came to €260 million, up 56.7% (or 46.0% at
constant exchange rates) on the €166 million recorded for the same period of 2009-10.

Sales for the second quarter of 2010-11 totaled €99 million versus €83 million for the
same period of 2009-10, representing an increase of 19.3% (12.3% at constant
exchange rates).

Second-quarter 2010-11 sales were higher than the guidance of around €83 million
issued when Ubisoft released its sales figures for the first quarter of 2010-11. The second
quarter saw the following:
    − Tom Clancy’s H.A.W.X.® 2 and R.U.S.E.™ performed below expectations.
    − Solid back-catalog sales, led mainly by Just Dance®.
    − A twofold increase in digital sales, propelled by the notable success of Scott
       Pilgrim on XBLA and PSN, as well as downloadable content (DLC) and sales of PC
       games.
During the first nine months of calendar 2010, Ubisoft continued to gain market share in
Europe (8.4% versus 7.5% last year) and in the United States (5.2% versus 4.2%).


Main income statement items

Gross profit represented a significantly higher percentage of sales in first-half 2010-11,
coming in at 56.1% (€146.2 million) against 41.6% (€69.1 million) in the same period of
2009-10. This performance was achieved thanks to a greater number of higher margin
Xbox 360® and PlayStation®3 titles released, coupled with an improved showing from
back-catalog games. The increase was not as high as expected due to the
underperformance of certain High Definition games and returns from the Group’s
merchandising activity.

Ubisoft ended the period with a €64.9 million current operating loss before stock-based
compensation, marking an improvement on the €77.5 million loss recorded for the first
six months of 2009-10. The first-half 2010-11 figure reflects the following combined
factors:
       A €77.1 million increase in gross profit.
       A €50.3 million increase in R&D expenses, which came to €98.4 million,
        representing 37.8% of sales, versus €48.1 million (29.0% of sales) in first-half
        2009-10. This rise was chiefly attributable to a greater number of titles released
        for the Xbox 360® and PlayStation®3, accelerated R&D depreciation on certain
        titles released during the period, and a change in accounting method which
        resulted in the recognition of R&D depreciation in the first half of the year that is
        usually recognized in the second half.


                                                                                           2
   A decrease in SG&A expenses as a percentage of sales to 43.2% (€112.7 million)
       versus 59.4% (€98.5 million) in first-half 2009-10:
       − Variable marketing expenses represented 21.5% of sales (€56.0 million)
          compared with 25.2% (€41.9 million) in the first six months of 2009-10.
       − Structure costs corresponded to 21.7% of sales (€56.7 million) compared with
          34.1% (€56.6 million) in first-half 2009-10.

Non-recurring reorganization charges
Ubisoft is taking measures to adapt its structure to the major changes in the industry by
reorganizing the roles and operations of its studios, which has resulted in the termination
of certain projects. Consequently, the Company recognized €62.1 million in non-recurring
reorganization charges in the first half of 2010-11. Those charges had a limited impact
on cash flow.

Taking into account these €62.1 million non-recurring charges, Ubisoft recorded an
operating loss of €133.8 million in the first six months of 2010-11, compared with
€83.0 million in the same period of 2009-10. This figure also includes stock-based
compensation of €5.4 million for first-half 2010-11 (€5.5 million in first-half 2009-10).

Net financial expense came to €1.7 million (compared with net financial income of
€6.6 million in first-half 2009-10), primarily breaking down as follows:
      €3.9 million in financial charges compared with €0.0 million in first-half 2009-10.
       This figure included €3.6 million related to the sale of tax carry-back receivables.
      €2.3 million in foreign exchange losses, versus foreign exchange gains of
       €6.6 million in first-half 2009-10.
      A €4.7 million positive impact from the sale of 2.1 million Gameloft shares.
       Following this transaction, 7 million Gameloft shares are still recorded as part of
       the Equity Swap.

Ubisoft ended the first six months of fiscal 2010-11 with an €89.8 million net loss,
representing a diluted loss per share of €0.93, versus a net loss of €52.0 million and a
diluted loss per share of €0.54 in the first half of 2009-10.

Excluding non-recurring items and before stock-based compensation, the net loss would
have amounted to €44.5 million, representing a diluted loss per share of €0.46, versus a
net loss of €46.6 million and a diluted loss per share of €0.48 for the first six months of
2009-10.

Main cash flow statement and balance sheet items

Cash flows from operating activities came to a negative €129.8 million versus a negative
€217.1 million in first-half 2009-10, representing a significant year-on-year improvement
of €87.3 million. It reflects a negative €99.2 million in cash flow from operations (versus
a negative €154.9 million in the same period of 2009-10) and a €30.6 million increase in
working capital requirement (against a €62.2 million increase in first-half 2009-10).

At September 30, 2010, Ubisoft had net debt of €79.2 million. The change from the net
cash position of €41.3 million at March 31, 2010 primarily reflects:
    - The above-mentioned €129.8 million net cash outflow from operating activities,
      which includes €8 million from the sale of the Gameloft shares.
    - The sales of tax carry-back receivables for €22.0 million.
    - €13.3 million in purchases of tangible and intangible assets.


                                                                                         3
Outlook

Full-year 2010-11
Yves Guillemot stated, "Ubisoft’s outlook is extremely encouraging for the upcoming
Christmas period. Just Dance 2, launched in mid-October, is the Wii phenomenon of the
moment, with sales up 75%. Assassin’s Creed Brotherhood has the potential to outstrip
the exceptional performance of the previous episodes, with pre-orders up 25% over
Assassin’s Creed II. The initial reviews have been extremely positive, praising the
breadth of the single-player experience as well as the game’s revolutionary multiplayer
mode. Both Just Dance 2 and Assassin’s Creed Brotherhood testify to the creative power
of our teams and the impact of the promotional campaigns put in place by our marketing
teams. Michael Jackson The Experience and Raving Rabbids Travel in Time are also
expected to contribute to our success in the coming quarter, which looks set to see
record performances. We are also encouraged by the very positive early performance of
Kinect and the good showing of our games for this system, especially Your Shape:
Fitness Evolved which is the best selling third-party game for Kinect in the United
States."

Yves Guillemot continued, "For full-year 2010-11 we are standing by our targets of
achieving sales growth, a return to profitability and positive cash flow generation, a
significant improvement on 2009-10. Current operating income1 breakeven point is now
estimated at around €960 million. Our cost structure has been impacted by accelerated
write-downs recorded on titles launched in the first half of the year, fluctuations in
exchange rates, growth of digital expenses, and a product mix more biased towards
casual games, which require more marketing and royalty payments. Based on currently
available information and taking into account the positive signs for the Christmas period
and our significantly higher forecasts for the casual segment, we expect our sales to
come in above €960 million for the full year."

Yves Guillemot concluded, "Ubisoft is now armed with a balance sheet that is better
adapted to the requirements of the industry and we have a solid financial position as well
as €280 million committed credit facilities. We are continuing to overhaul our studios
roles, operations and structures in order to meet the new challenges in our industry and
are focused on offering highly innovative and creative products, as well as on enhancing
quality levels, releasing new iterations of our major franchises on a more regular basis,
providing gamers with an ever-richer online experience and attracting a constantly
growing number of casual gamers. The outstanding efforts of Ubisoft’s teams in these
areas will enable us to fully leverage the numerous opportunities coming up in the High
Definition, Casual and Online segments."

Sales for the third quarter of 2010-11
The third quarter will see the following main releases:
    - Assassin’s Creed® Brotherhood for Xbox 360®, PLAYSTATION® 3 and Facebook®
    - Just Dance® 2 and Just Dance® Kids for the Wii™
    - Raving Rabbids Travel in Time™ for the Wii™
    - Michael Jackson The Experience for the Wii™, Nintendo DS™ and PSP™
    - Your Shape™: Fitness Evolved, MotionSports™ and Fighters Uncaged™ for Xbox
       360™ Kinect

The Group expects third quarter 2010-11 sales of around €520 million, approximately
5% higher than in the third quarter of 2009-10.

Update on the games release schedule
Tom Clancy’s Ghost Recon Future Soldier™ and Driver® San Francisco, which were
previously planned for release in the fourth fiscal quarter, will now be included in the
2011-12 line-up.


1
    Before stock-based compensation.
                                                                                        4
Significant events

Market share: In the first nine months of calendar 2010, Ubisoft was the number 4
independent publisher in the United States with 5.2% market share (compared with
number 4 and 4.2% one year earlier) and was number 3 in Europe with 8.4% market
share (compared with number 3 and 7.5% one year earlier).

New credit facilities: Ubisoft has been granted new cash credit lines amounting to
€70 million and expiring in May 2013, and has carried out no-recourse sales for
€25.6 million worth of tax receivables due in 2016.

Sale of Gameloft shares: In the first half of 2010-11, 2.1 million Gameloft shares were
sold for €8.0 million, resulting in a gain of €4.7 million.

Acquisition of Quazal: Ubisoft has acquired Quazal Technologies, a leader in the creation
of multiplayer middleware and services for video game developers. These solutions are
integrated in the development of the majority of Ubisoft’s key titles, including Assassin's
Creed® Brotherhood, which was named “Best Online Game” at E3 2010. This acquisition
guarantees Ubisoft a solid technology that will help it attain the ambitious objectives of
its online strategy.


Contact
Investor Relations
Jean-Benoît Roquette
Head of Investor Relations
+ 33 1 48 18 52 39
Jean-benoit.roquette@ubisoft.com


Disclaimer
This statement may contain estimated financial data, information on future projects and transactions and future
business results/performance. Such forward-looking data are provided for estimation purposes only. They are
subject to market risks and uncertainties and may vary significantly compared with the actual results that will
be published. The estimated financial data have been presented to the Board of Directors and have not been
audited by the Statutory Auditors. (Additional information is specified in the most recent Ubisoft Registration
Document filed on June 30, 2010 with the French Financial Markets Authority (l’Autorité des marchés
financiers)).


About Ubisoft:
Ubisoft is a leading producer, publisher and distributor of interactive entertainment products worldwide and has
grown considerably through a strong and diversified line-up of products and partnerships. Ubisoft has offices in
26 countries and has sales in more than 55 countries around the globe. It is committed to delivering high-
quality, cutting-edge video game titles to consumers. For the 2009-10 fiscal year Ubisoft generated sales of €
871 million. To learn more, please visit: www.ubisoftgroup.com.


© 2010 Ubisoft Entertainment. All Rights Reserved. Ubisoft and the Ubisoft logo are trademarks of Ubisoft
Entertainment in the U.S. and/or other countries.


                                                                                                               5
APPENDICES


                Breakdown of sales by geographic region


                  % Sales           % Sales             % Sales   % Sales

                                                     6 months     6 months
                Q2 2010/11        Q2 2009/10         2010/11      2009/10
Europe              39%               46%                 39%       48%
North America       52%               48%                 52%       41%
Rest of world        9%                6%                  9%       11%
TOTAL              100%              100%               100%       100%


                    Breakdown of sales by platform


                                                     6 months     6 months
                Q2 2010/11        Q2 2009/10         2010/11      2009/10
Nintendo DS™        10%               24%                  7%       23%
PC                   2%               12%                  6%       17%
PlayStation®2        1%                3%                  0%        2%
PLAYSTATION®3       31%               17%                 22%       15%
PSP™                 6%                6%                  5%        5%
Wii™                29%               25%                 23%       22%
XBOX 360™           20%               11%                 36%       14%
Autres               1%                1%                  1%        2%
TOTAL              100%              100%               100%       100%


                  Breakdown of sales by business line


                                                     6 months     6 months
                Q2 2010/11        Q2 2009/10         2010/11      2009/10
Development         98%               66%                 98%       73%
Publishing           4%               22%                  2%       20%
Distribution        -2%               12%                 0%         8%
TOTAL              100%              100%               100%       100%


                                                                          6
Title Release Schedule


                  3rd Quarter (October – December 2010)

         ASSASSIN’S CREED® BROTHERHOOD                           Xbox 360™,
                                                               PLAYSTATION®3
       BATTLE OF GIANTS® DINOSAURS STRIKE                           Wii™
                BIG BOND THEORY                                      iPad
               BLOODY GOOD TIME™                                   PC, XBLA
                CRYSTAL SHUFFLE                                     iPhone
   CSI: CRIME SCENE INVESTIGATION™: CRIME CITY                    Facebook
                                                                 Xbox 360™,
CSI: CRIME SCENE INVESTIGATION™: FATAL CONSPIRACY
                                                           PLAYSTATION®3, Wii™, PC
   CSI: CRIME SCENE INVESTIGATION™: UNSOLVED!                   Nintendo DS™
                          ®
            FAMILY FEUD       DECADES (US)                          Wii™
               FIGHTERS UNCAGED™                               Xbox 360™ Kinect
   GIRLS LIFE™ CLOTHES AND ACCESSORIES (EMEA)                   Nintendo DS™
            HOLLYWOOD SQUARES (US)                                  Wii™
            IMAGINE® FASHION STYLIST                            Nintendo DS™
           IMAGINE® RESORT OWNER (US)                           Nintendo DS™
                  JUST DANCE® 2                                     Wii™
                              ®
              JUST DANCE          KIDS (US)                         Wii™
         MICHAEL JACKSON THE EXPERIENCE                    Wii™, Nintendo DS™, PSP™
                 MOTIONSPORTS™                                 Xbox 360™ Kinect
              PAYUTA® & THE ICE GOD                                  iPad
          PETZ® CATZ® PLAYGROUND (US)                           Nintendo DS™
      PETZ FANTASY™ MOONLIGHT MAGIC (US)                        Nintendo DS™
       PETZ FANTASY™ SUNSHINE MAGIC (US)                        Nintendo DS™
              PETZ NURSERY™ 2 (US)                              Nintendo DS™
       PRINCE OF PERSIA THE SANDS OF TIME™                           PSN
       PRINCE OF PERSIA THE TWO THRONES®                             PSN
                              ®
        PRINCE OF PERSIA          TRILOGY (EMEA)               PLAYSTATION®3
                                                ®
        PRINCE OF PERSIA WARRIOR WITHIN                              PSN
         RAVING RABBIDS TRAVEL IN TIME™                             Wii™
                                                                 Xbox 360™,
           SHAUN WHITE SKATEBOARDING
                                                           PLAYSTATION®3, Wii™, PC
             THE AMAZING RACE™ (US)                                 Wii™
            THE SETTLERS® OF TANDRIA                             iPad, iPhone
    TOM CLANCY’S GHOST RECON® PREDATOR (US)                         PSP™
           TOM CLANCY’S GHOST RECON®                                Wii™
             TOM CLANCY’S H.A.W.X.® 2                              PC, Wii™
    WHO WANTS TO BE A MILLIONAIRE™ 2010 (US)                  Wii™, Nintendo DS™
          YOUR SHAPE™: FITNESS EVOLVED                         Xbox 360™ Kinect


                                                                                   7
Consolidated income statement


In thousand of euros                                         09/30/10        09/30/09


Sales                                                         260 544         165 957
Cost of sales                                                 -114 360         -96 870
Gross Margin                                                  146 184          69 087
Research and Development costs                                 -98 406         -48 070
Marketing costs                                                -81 888         -65 393
General and Administrative costs                               -30 775         -33 104
Current operating income                                      -64 885         -77 480

Fair Value Variation                                            -1 360              0
Other operating income and expenses                            -62 130              -3
Stock-based compensation                                        -5 378          -5 501
Operating income                                             -133 753         -82 984
Net borrowing costs                                             -3 944             66
Net foreign exchange losses                                     -2 334           6 637
Other financial income and expenses                              4 582           -100
Net financial income                                           -1 696           6 603
Share of profit of associates                                      46             125
Income tax                                                     45 627           24 230

Profit for the period                                         -89 776         -52 026
Earnings per share

Basic earnings per share (in €)*                                 -0,95           -0,55

Diluted earnings per share (in €)*                               -0,93           -0,54

Weighted average number of shares in issue (*)                  94 387          94 080

Diluted weighted average number of shares in issue (*)          96 862          96 682


(*)
      After stock split.


                                                                                         8
Consolidated balance sheet

ASSETS                                                           Net              Net
In thousands of euros                                      9/30/10          3/31/10
Goodwill                                                      104 774          106 498
Other intangible assets                                       540 396          526 383
Property, plant and equipment                                  35 497           31 800
Investments in associates                                         440             393

Other financial assets                                          3 463            3 613
Deferred tax assets                                            86 500           65 884
                             Non current assets               771 070          734 571
Inventory                                                      46 742           47 973
Trade receivables                                              43 890           68 748
Other receivables                                              65 213           89 159
Other current financial assets                                 28 298           33 271
Current tax assets                                             10 971           25 080
Cash and cash equivalents                                     125 366          185 316
                                   Current assets             320 480          449 547
Total assets                                                1 091 550        1 184 118


LIABILITIES AND EQUITY                                       9/30/10          3/31/10
In thousand of euros
Capital                                                         7 324            7 320
Premiums                                                      519 284          512 444
Consolidated reserves                                         237 949          285 380
Consolidated earnings                                  -       89 777   -       43 672
             Equity (Group share)                             674 780          761 472

Minority interests
                                      Total equity            674 780          761 472
Provisions                                                      2 220            2 215
Employee benefit                                                1 855            1 710
Long-term borrowings                                           21 917           22 548
Deferred tax liabilities                                       26 008           32 921
                           Non-current liabilities             52 000           59 394
Short-term borrowings                                         183 780          121 784
Trade payables                                                104 825          144 499
Other liabilities                                              67 738           93 617
Current tax liabilities                                         8 427            3 352
                                 Current liabilities          364 770          363 252
                                   Total liabilities          416 770          422 646
Total liabilities and equity                                1 091 550        1 184 118


                                                                                         9
Consolidated cash flow statement for comparison with other industry players

In thousand of euros                                              9/30/10     9/30/09

Cash flows from operating activities
Consolidated earnings                                              -89 777     -52 027
+/- Share of profit of associates                                      -46        -125
+/- Amortization of game software                                  144 290      41 410
+/- Other amortization                                              10 962       7 656
+/- Provisions                                                       2 296         215
+/- Cost of share-based payments                                     5 378       5 501
+/- Gains / losses on disposals                                         41          17
+/- Other income and expenses calculated                             3 291       9 619
+/- Costs of internal development and license development
                                                                  -175 658     -167 152
CASH FLOW FROM OPERATIONS                                          -99 223    -154 886
Inventory                                                             -694       5 034
Trade receivables                                                   24 944         289
Other assets                                                         -4 878    -43 880
Trade payables                                                     -22 568     -12 794
Other liabilities                                                  -27 401     -10 877
+/-Change in working capital from operating activities
                                                                   -30 597     -62 228
TOTAL CASH FLOW GENERATED BY OPERATING ACTIVITIES
                                                                  -129 820    -217 114
Cash flows from investing activities
- Payments for the acquisition of property, plant and equipment
and other intangible assets                                        -13 376       -5 328
+ Proceeds from the disposal of intangible assets and property,
plant and equipment                                                     61          12
- Payments for the acquisition of financial assets                   -7 444      -8 634
+ Repayment of loans and other financial assets                      7 625       8 695
+/- Changes in scope                                                  -173           0
CASH USED BY INVESTING ACTIVITIES
                                                                   -13 307      -5 255
Cash flows from financing activities
+ New finance leases                                                    44         129
- Repayment of finance leases                                          -99         -28
- Repayment of borrowings                                             -755        -633
+ Proceeds from shareholders in capital increases                      323       4 131
+/- Sales / purchases of own shares                                   -217         -95
+/- Tax Carry back receivables sold                                 21 886           0
CASH GENERATED (USED) BY FINANCING ACTIVITIES                       21 212       3 547

Net change in cash and cash equivalents                           -121 915    -218 822
Cash and cash equivalents at the beginning of the fiscal year        64 978     176 890
Impact of translation adjustments                                      584       -2 916
Cash and cash equivalents at the end of the fiscal year
                                                                   -56 353     -44 850


                                                                                          10
Consolidated cash flow statement


In thousand of euros                                                9/30/10            9/30/09
Cash flows from operating activities
Consolidated earnings                                                    -89 777        -52 027
+/- Share of profit of associates                                            -46          -125
+/- Depreciation and amortization                                       155 252         49 066
+/- Provisions                                                            2 296            215
+/- Cost of share-based payments                                          5 378           5 501
+/- Gains / losses on disposals                                              41             17
+/- Other income and expenses calculated                                  3 291           9 619
+ Income tax paid                                                   -    45 627    -     24 230
Inventory                                                                  -694           5 034
Trade receivables                                                         24944            289
Other assets                                                             39 071           6 382
Trade payables                                                           -22 568        -12 794
Other liabilities                                                        -19 791        -33 229
+/-Change in working capital from operating activities                   20 962        -34 318

TOTAL CASH FLOW GENERATED BY OPERATING                                   51 770        -46 282
ACTIVITIES
- Income tax paid                                                         -5 932         -3 681
NET CASH GENERATED BY OPERATING ACTIVITIES                               45 838        -49 963

Cash flows from investing activities

- Payments for the acquisition of intangible assets and property,       -175 658       -167 152
plant and equipment
+ Proceeds from the disposal of intangible assets and property,          -13 376         -5 328
plant and equipment
- Payments for the acquisition of financial assets                           61             11

+/- Other cash flows from investing activities                            -7 444         -8 634
+ Repayment of loans and other financial assets                           7 625           8 695
                       (1)
+/- Changes in scope                                                       -173              0
CASH USED BY INVESTING ACTIVITIES                                   -188 965       -172 408

Cash flows from financing activities
+ New finance leases                                                         44            129
+ New borrowings                                                             30             43
- Repayment of finance leases                                                -99            -28
- Repayment of borrowings                                                  -755           -633
+ Proceeds from shareholders in capital increases                           323           4 131
+/- Sales / purchases of own shares                                        -217             -95
+/- Tax Carry back receivables sold                                      21 886              0
CASH GENERATED (USED) BY FINANCING ACTIVITIES                            21 212          3 547
Net change in cash and cash equivalents                             -121 915       -218 824
Cash and cash equivalents at the beginning of the fiscal year            -64 976       -176 890
Impact of translation adjustments                                            584         -2 916
Cash and cash equivalents at the end of the fiscal year                 -56 355        -44 850


                                                                                                  11

Mais conteúdo relacionado

Semelhante a Ubisoft Reports First-Half 2010-11 Results

Ubisoft Reports First-Half 2011-12 Results
Ubisoft Reports First-Half 2011-12 ResultsUbisoft Reports First-Half 2011-12 Results
Ubisoft Reports First-Half 2011-12 ResultsUbisoft Montreal
 
Présentation des résultats financiers Sony Ericsson (Q2 2010)
  Présentation des résultats financiers Sony Ericsson (Q2 2010)  Présentation des résultats financiers Sony Ericsson (Q2 2010)
Présentation des résultats financiers Sony Ericsson (Q2 2010)Ericsson France
 
Sony Ericsson Q4 Financial Results Final
Sony Ericsson Q4 Financial Results FinalSony Ericsson Q4 Financial Results Final
Sony Ericsson Q4 Financial Results FinalMI2mobile
 
BME Financial Results 3Q11
BME Financial Results 3Q11BME Financial Results 3Q11
BME Financial Results 3Q11BMEGroup
 
Safilo presentation q3 9-m 2010 results
Safilo presentation q3 9-m 2010 resultsSafilo presentation q3 9-m 2010 results
Safilo presentation q3 9-m 2010 resultsLongitud de Onda
 
Eni Interim Consolidated Report, July 29th, 2011
Eni Interim Consolidated Report, July 29th, 2011Eni Interim Consolidated Report, July 29th, 2011
Eni Interim Consolidated Report, July 29th, 2011Eni
 
BME Financial Results 1H11
BME Financial Results 1H11BME Financial Results 1H11
BME Financial Results 1H11BMEGroup
 
Q4 2008 Earnings Press Release and Financial Tables
Q4 2008 Earnings Press Release and Financial TablesQ4 2008 Earnings Press Release and Financial Tables
Q4 2008 Earnings Press Release and Financial Tablesfinance7
 
motorola Q4 2008 Earnings Press Release and Financial Tables
motorola Q4 2008 Earnings Press Release and Financial Tablesmotorola Q4 2008 Earnings Press Release and Financial Tables
motorola Q4 2008 Earnings Press Release and Financial Tablesfinance7
 
Q4 2007 Earnings Press Release and Financial Tables
Q4 2007 Earnings Press Release and Financial TablesQ4 2007 Earnings Press Release and Financial Tables
Q4 2007 Earnings Press Release and Financial Tablesfinance7
 
Kemira financial statements bulletin 2012
Kemira financial statements bulletin 2012Kemira financial statements bulletin 2012
Kemira financial statements bulletin 2012Kemira Oyj
 
Q1 2009 Earning Report of Lennox International Inc.
Q1 2009 Earning Report of Lennox International Inc.Q1 2009 Earning Report of Lennox International Inc.
Q1 2009 Earning Report of Lennox International Inc.earningreport earningreport
 
Q4 2006 Earnings Release
	Q4 2006 Earnings Release	Q4 2006 Earnings Release
Q4 2006 Earnings Releasefinance7
 
Release resultados 4 tri01 ingles
Release resultados 4 tri01 inglesRelease resultados 4 tri01 ingles
Release resultados 4 tri01 inglesEmbraer RI
 
Eni 2011 4Q Results and full year results (unaudited)
Eni 2011 4Q Results and full year results (unaudited)Eni 2011 4Q Results and full year results (unaudited)
Eni 2011 4Q Results and full year results (unaudited)Eni
 
AT&S Quarterly Financial Report Q1 2018/19
AT&S Quarterly Financial Report Q1 2018/19AT&S Quarterly Financial Report Q1 2018/19
AT&S Quarterly Financial Report Q1 2018/19AT&S_IR
 
9M results 2011
9M results 20119M results 2011
9M results 2011Ageas
 
Press Release 2009 Annual Results
Press Release 2009 Annual ResultsPress Release 2009 Annual Results
Press Release 2009 Annual ResultsBOURBON
 

Semelhante a Ubisoft Reports First-Half 2010-11 Results (20)

Ubisoft Reports First-Half 2011-12 Results
Ubisoft Reports First-Half 2011-12 ResultsUbisoft Reports First-Half 2011-12 Results
Ubisoft Reports First-Half 2011-12 Results
 
Présentation des résultats financiers Sony Ericsson (Q2 2010)
  Présentation des résultats financiers Sony Ericsson (Q2 2010)  Présentation des résultats financiers Sony Ericsson (Q2 2010)
Présentation des résultats financiers Sony Ericsson (Q2 2010)
 
Sony Ericsson Q4 Financial Results Final
Sony Ericsson Q4 Financial Results FinalSony Ericsson Q4 Financial Results Final
Sony Ericsson Q4 Financial Results Final
 
BME Financial Results 3Q11
BME Financial Results 3Q11BME Financial Results 3Q11
BME Financial Results 3Q11
 
Safilo presentation q3 9-m 2010 results
Safilo presentation q3 9-m 2010 resultsSafilo presentation q3 9-m 2010 results
Safilo presentation q3 9-m 2010 results
 
CBS qr3q 01
CBS qr3q 01CBS qr3q 01
CBS qr3q 01
 
Eni Interim Consolidated Report, July 29th, 2011
Eni Interim Consolidated Report, July 29th, 2011Eni Interim Consolidated Report, July 29th, 2011
Eni Interim Consolidated Report, July 29th, 2011
 
BME Financial Results 1H11
BME Financial Results 1H11BME Financial Results 1H11
BME Financial Results 1H11
 
Q4 2008 Earnings Press Release and Financial Tables
Q4 2008 Earnings Press Release and Financial TablesQ4 2008 Earnings Press Release and Financial Tables
Q4 2008 Earnings Press Release and Financial Tables
 
motorola Q4 2008 Earnings Press Release and Financial Tables
motorola Q4 2008 Earnings Press Release and Financial Tablesmotorola Q4 2008 Earnings Press Release and Financial Tables
motorola Q4 2008 Earnings Press Release and Financial Tables
 
Q4 2007 Earnings Press Release and Financial Tables
Q4 2007 Earnings Press Release and Financial TablesQ4 2007 Earnings Press Release and Financial Tables
Q4 2007 Earnings Press Release and Financial Tables
 
Kemira financial statements bulletin 2012
Kemira financial statements bulletin 2012Kemira financial statements bulletin 2012
Kemira financial statements bulletin 2012
 
Q1 2009 Earning Report of Lennox International Inc.
Q1 2009 Earning Report of Lennox International Inc.Q1 2009 Earning Report of Lennox International Inc.
Q1 2009 Earning Report of Lennox International Inc.
 
Q4 2006 Earnings Release
	Q4 2006 Earnings Release	Q4 2006 Earnings Release
Q4 2006 Earnings Release
 
Release resultados 4 tri01 ingles
Release resultados 4 tri01 inglesRelease resultados 4 tri01 ingles
Release resultados 4 tri01 ingles
 
Eni 2011 4Q Results and full year results (unaudited)
Eni 2011 4Q Results and full year results (unaudited)Eni 2011 4Q Results and full year results (unaudited)
Eni 2011 4Q Results and full year results (unaudited)
 
Release 2Q01
Release 2Q01Release 2Q01
Release 2Q01
 
AT&S Quarterly Financial Report Q1 2018/19
AT&S Quarterly Financial Report Q1 2018/19AT&S Quarterly Financial Report Q1 2018/19
AT&S Quarterly Financial Report Q1 2018/19
 
9M results 2011
9M results 20119M results 2011
9M results 2011
 
Press Release 2009 Annual Results
Press Release 2009 Annual ResultsPress Release 2009 Annual Results
Press Release 2009 Annual Results
 

Mais de Ubisoft Montreal

Assassin's creed III ce sera la révolution americaine
Assassin's creed III ce sera la révolution americaineAssassin's creed III ce sera la révolution americaine
Assassin's creed III ce sera la révolution americaineUbisoft Montreal
 
Ubisoft publie le chiffre d'affaires estimé du troisième semestre 2011 12
Ubisoft publie le chiffre d'affaires estimé du troisième semestre 2011 12Ubisoft publie le chiffre d'affaires estimé du troisième semestre 2011 12
Ubisoft publie le chiffre d'affaires estimé du troisième semestre 2011 12Ubisoft Montreal
 
Ubisoft étend l'univers du jeu Assassin's Creed et lance un nouveau récit animé
Ubisoft étend l'univers du jeu Assassin's Creed et lance un nouveau récit animéUbisoft étend l'univers du jeu Assassin's Creed et lance un nouveau récit animé
Ubisoft étend l'univers du jeu Assassin's Creed et lance un nouveau récit animéUbisoft Montreal
 
Ubisoft renforce de développement de ses activités online avec l'acquisition ...
Ubisoft renforce de développement de ses activités online avec l'acquisition ...Ubisoft renforce de développement de ses activités online avec l'acquisition ...
Ubisoft renforce de développement de ses activités online avec l'acquisition ...Ubisoft Montreal
 
Just Dance dépasse les 2 millions d'unités vendues dans le monde
Just Dance dépasse les 2 millions d'unités vendues dans le mondeJust Dance dépasse les 2 millions d'unités vendues dans le monde
Just Dance dépasse les 2 millions d'unités vendues dans le mondeUbisoft Montreal
 
Ubisoft dévoile la playlist complète de Just Dance 2
Ubisoft dévoile la playlist complète de Just Dance 2Ubisoft dévoile la playlist complète de Just Dance 2
Ubisoft dévoile la playlist complète de Just Dance 2Ubisoft Montreal
 
Ubisoft dévoile de nouvelles chansons pour Michael Jackson The Experience
Ubisoft dévoile de nouvelles chansons pour Michael Jackson The ExperienceUbisoft dévoile de nouvelles chansons pour Michael Jackson The Experience
Ubisoft dévoile de nouvelles chansons pour Michael Jackson The ExperienceUbisoft Montreal
 
Ubisoft présente sa liste de jeux présentés à la Gamescom 2010
Ubisoft présente sa liste de jeux présentés à la Gamescom 2010Ubisoft présente sa liste de jeux présentés à la Gamescom 2010
Ubisoft présente sa liste de jeux présentés à la Gamescom 2010Ubisoft Montreal
 
Ubisoft dévoile son chiffre d'affaires estimé pour le premier semestre 2010-11
Ubisoft dévoile son chiffre d'affaires estimé pour le premier semestre 2010-11Ubisoft dévoile son chiffre d'affaires estimé pour le premier semestre 2010-11
Ubisoft dévoile son chiffre d'affaires estimé pour le premier semestre 2010-11Ubisoft Montreal
 
Ubisoft annonce son chiffre d'affaires et ses résultats pour l'exercice 2009-10
Ubisoft annonce son chiffre d'affaires et ses résultats pour l'exercice 2009-10Ubisoft annonce son chiffre d'affaires et ses résultats pour l'exercice 2009-10
Ubisoft annonce son chiffre d'affaires et ses résultats pour l'exercice 2009-10Ubisoft Montreal
 
Ubisoft annonce un emballage écologique pour ses jeux PC et pour consoles XBO...
Ubisoft annonce un emballage écologique pour ses jeux PC et pour consoles XBO...Ubisoft annonce un emballage écologique pour ses jeux PC et pour consoles XBO...
Ubisoft annonce un emballage écologique pour ses jeux PC et pour consoles XBO...Ubisoft Montreal
 
Ubisoft annonce son chiffre d'affaires et ses résultats pour le premier semes...
Ubisoft annonce son chiffre d'affaires et ses résultats pour le premier semes...Ubisoft annonce son chiffre d'affaires et ses résultats pour le premier semes...
Ubisoft annonce son chiffre d'affaires et ses résultats pour le premier semes...Ubisoft Montreal
 
Ubisoft Expands Assassin's Creed Universe Beyond Video Games with New Animate...
Ubisoft Expands Assassin's Creed Universe Beyond Video Games with New Animate...Ubisoft Expands Assassin's Creed Universe Beyond Video Games with New Animate...
Ubisoft Expands Assassin's Creed Universe Beyond Video Games with New Animate...Ubisoft Montreal
 
Nivea, the #1 Skincare Brand, Partners with Ubisoft to Create Groundbreaking ...
Nivea, the #1 Skincare Brand, Partners with Ubisoft to Create Groundbreaking ...Nivea, the #1 Skincare Brand, Partners with Ubisoft to Create Groundbreaking ...
Nivea, the #1 Skincare Brand, Partners with Ubisoft to Create Groundbreaking ...Ubisoft Montreal
 
Ubisoft Presents Gamescom 2010 Highlights
Ubisoft Presents Gamescom 2010 HighlightsUbisoft Presents Gamescom 2010 Highlights
Ubisoft Presents Gamescom 2010 HighlightsUbisoft Montreal
 
Ubisoft Reports Estimated Sales for First Quarter 2010-11
Ubisoft Reports Estimated Sales for First Quarter 2010-11Ubisoft Reports Estimated Sales for First Quarter 2010-11
Ubisoft Reports Estimated Sales for First Quarter 2010-11Ubisoft Montreal
 
Ubisoft dévoile son line-up E3 2010
Ubisoft dévoile son line-up E3 2010Ubisoft dévoile son line-up E3 2010
Ubisoft dévoile son line-up E3 2010Ubisoft Montreal
 
Ubisoft Reveals E3 Line-Up
Ubisoft Reveals E3 Line-UpUbisoft Reveals E3 Line-Up
Ubisoft Reveals E3 Line-UpUbisoft Montreal
 
Ubisoft Launches Environment-friendly Packaging for its PC, Xbox 360 and Play...
Ubisoft Launches Environment-friendly Packaging for its PC, Xbox 360 and Play...Ubisoft Launches Environment-friendly Packaging for its PC, Xbox 360 and Play...
Ubisoft Launches Environment-friendly Packaging for its PC, Xbox 360 and Play...Ubisoft Montreal
 
Assassin's Creed II Awarded Guinness World Record
Assassin's Creed II Awarded Guinness World RecordAssassin's Creed II Awarded Guinness World Record
Assassin's Creed II Awarded Guinness World RecordUbisoft Montreal
 

Mais de Ubisoft Montreal (20)

Assassin's creed III ce sera la révolution americaine
Assassin's creed III ce sera la révolution americaineAssassin's creed III ce sera la révolution americaine
Assassin's creed III ce sera la révolution americaine
 
Ubisoft publie le chiffre d'affaires estimé du troisième semestre 2011 12
Ubisoft publie le chiffre d'affaires estimé du troisième semestre 2011 12Ubisoft publie le chiffre d'affaires estimé du troisième semestre 2011 12
Ubisoft publie le chiffre d'affaires estimé du troisième semestre 2011 12
 
Ubisoft étend l'univers du jeu Assassin's Creed et lance un nouveau récit animé
Ubisoft étend l'univers du jeu Assassin's Creed et lance un nouveau récit animéUbisoft étend l'univers du jeu Assassin's Creed et lance un nouveau récit animé
Ubisoft étend l'univers du jeu Assassin's Creed et lance un nouveau récit animé
 
Ubisoft renforce de développement de ses activités online avec l'acquisition ...
Ubisoft renforce de développement de ses activités online avec l'acquisition ...Ubisoft renforce de développement de ses activités online avec l'acquisition ...
Ubisoft renforce de développement de ses activités online avec l'acquisition ...
 
Just Dance dépasse les 2 millions d'unités vendues dans le monde
Just Dance dépasse les 2 millions d'unités vendues dans le mondeJust Dance dépasse les 2 millions d'unités vendues dans le monde
Just Dance dépasse les 2 millions d'unités vendues dans le monde
 
Ubisoft dévoile la playlist complète de Just Dance 2
Ubisoft dévoile la playlist complète de Just Dance 2Ubisoft dévoile la playlist complète de Just Dance 2
Ubisoft dévoile la playlist complète de Just Dance 2
 
Ubisoft dévoile de nouvelles chansons pour Michael Jackson The Experience
Ubisoft dévoile de nouvelles chansons pour Michael Jackson The ExperienceUbisoft dévoile de nouvelles chansons pour Michael Jackson The Experience
Ubisoft dévoile de nouvelles chansons pour Michael Jackson The Experience
 
Ubisoft présente sa liste de jeux présentés à la Gamescom 2010
Ubisoft présente sa liste de jeux présentés à la Gamescom 2010Ubisoft présente sa liste de jeux présentés à la Gamescom 2010
Ubisoft présente sa liste de jeux présentés à la Gamescom 2010
 
Ubisoft dévoile son chiffre d'affaires estimé pour le premier semestre 2010-11
Ubisoft dévoile son chiffre d'affaires estimé pour le premier semestre 2010-11Ubisoft dévoile son chiffre d'affaires estimé pour le premier semestre 2010-11
Ubisoft dévoile son chiffre d'affaires estimé pour le premier semestre 2010-11
 
Ubisoft annonce son chiffre d'affaires et ses résultats pour l'exercice 2009-10
Ubisoft annonce son chiffre d'affaires et ses résultats pour l'exercice 2009-10Ubisoft annonce son chiffre d'affaires et ses résultats pour l'exercice 2009-10
Ubisoft annonce son chiffre d'affaires et ses résultats pour l'exercice 2009-10
 
Ubisoft annonce un emballage écologique pour ses jeux PC et pour consoles XBO...
Ubisoft annonce un emballage écologique pour ses jeux PC et pour consoles XBO...Ubisoft annonce un emballage écologique pour ses jeux PC et pour consoles XBO...
Ubisoft annonce un emballage écologique pour ses jeux PC et pour consoles XBO...
 
Ubisoft annonce son chiffre d'affaires et ses résultats pour le premier semes...
Ubisoft annonce son chiffre d'affaires et ses résultats pour le premier semes...Ubisoft annonce son chiffre d'affaires et ses résultats pour le premier semes...
Ubisoft annonce son chiffre d'affaires et ses résultats pour le premier semes...
 
Ubisoft Expands Assassin's Creed Universe Beyond Video Games with New Animate...
Ubisoft Expands Assassin's Creed Universe Beyond Video Games with New Animate...Ubisoft Expands Assassin's Creed Universe Beyond Video Games with New Animate...
Ubisoft Expands Assassin's Creed Universe Beyond Video Games with New Animate...
 
Nivea, the #1 Skincare Brand, Partners with Ubisoft to Create Groundbreaking ...
Nivea, the #1 Skincare Brand, Partners with Ubisoft to Create Groundbreaking ...Nivea, the #1 Skincare Brand, Partners with Ubisoft to Create Groundbreaking ...
Nivea, the #1 Skincare Brand, Partners with Ubisoft to Create Groundbreaking ...
 
Ubisoft Presents Gamescom 2010 Highlights
Ubisoft Presents Gamescom 2010 HighlightsUbisoft Presents Gamescom 2010 Highlights
Ubisoft Presents Gamescom 2010 Highlights
 
Ubisoft Reports Estimated Sales for First Quarter 2010-11
Ubisoft Reports Estimated Sales for First Quarter 2010-11Ubisoft Reports Estimated Sales for First Quarter 2010-11
Ubisoft Reports Estimated Sales for First Quarter 2010-11
 
Ubisoft dévoile son line-up E3 2010
Ubisoft dévoile son line-up E3 2010Ubisoft dévoile son line-up E3 2010
Ubisoft dévoile son line-up E3 2010
 
Ubisoft Reveals E3 Line-Up
Ubisoft Reveals E3 Line-UpUbisoft Reveals E3 Line-Up
Ubisoft Reveals E3 Line-Up
 
Ubisoft Launches Environment-friendly Packaging for its PC, Xbox 360 and Play...
Ubisoft Launches Environment-friendly Packaging for its PC, Xbox 360 and Play...Ubisoft Launches Environment-friendly Packaging for its PC, Xbox 360 and Play...
Ubisoft Launches Environment-friendly Packaging for its PC, Xbox 360 and Play...
 
Assassin's Creed II Awarded Guinness World Record
Assassin's Creed II Awarded Guinness World RecordAssassin's Creed II Awarded Guinness World Record
Assassin's Creed II Awarded Guinness World Record
 

Último

Top Rated Pune Call Girls Dhayari ⟟ 6297143586 ⟟ Call Me For Genuine Sex Ser...
Top Rated  Pune Call Girls Dhayari ⟟ 6297143586 ⟟ Call Me For Genuine Sex Ser...Top Rated  Pune Call Girls Dhayari ⟟ 6297143586 ⟟ Call Me For Genuine Sex Ser...
Top Rated Pune Call Girls Dhayari ⟟ 6297143586 ⟟ Call Me For Genuine Sex Ser...Call Girls in Nagpur High Profile
 
↑Top Model (Kolkata) Call Girls Behala ⟟ 8250192130 ⟟ High Class Call Girl In...
↑Top Model (Kolkata) Call Girls Behala ⟟ 8250192130 ⟟ High Class Call Girl In...↑Top Model (Kolkata) Call Girls Behala ⟟ 8250192130 ⟟ High Class Call Girl In...
↑Top Model (Kolkata) Call Girls Behala ⟟ 8250192130 ⟟ High Class Call Girl In...noor ahmed
 
Nayabad Call Girls ✔ 8005736733 ✔ Hot Model With Sexy Bhabi Ready For Sex At ...
Nayabad Call Girls ✔ 8005736733 ✔ Hot Model With Sexy Bhabi Ready For Sex At ...Nayabad Call Girls ✔ 8005736733 ✔ Hot Model With Sexy Bhabi Ready For Sex At ...
Nayabad Call Girls ✔ 8005736733 ✔ Hot Model With Sexy Bhabi Ready For Sex At ...aamir
 
Karnal Call Girls 8860008073 Dyal Singh Colony Call Girls Service in Karnal E...
Karnal Call Girls 8860008073 Dyal Singh Colony Call Girls Service in Karnal E...Karnal Call Girls 8860008073 Dyal Singh Colony Call Girls Service in Karnal E...
Karnal Call Girls 8860008073 Dyal Singh Colony Call Girls Service in Karnal E...Apsara Of India
 
Independent Garulia Escorts ✔ 9332606886✔ Full Night With Room Online Booking...
Independent Garulia Escorts ✔ 9332606886✔ Full Night With Room Online Booking...Independent Garulia Escorts ✔ 9332606886✔ Full Night With Room Online Booking...
Independent Garulia Escorts ✔ 9332606886✔ Full Night With Room Online Booking...Riya Pathan
 
Dakshineswar Call Girls ✔ 8005736733 ✔ Hot Model With Sexy Bhabi Ready For Se...
Dakshineswar Call Girls ✔ 8005736733 ✔ Hot Model With Sexy Bhabi Ready For Se...Dakshineswar Call Girls ✔ 8005736733 ✔ Hot Model With Sexy Bhabi Ready For Se...
Dakshineswar Call Girls ✔ 8005736733 ✔ Hot Model With Sexy Bhabi Ready For Se...aamir
 
Independent Hatiara Escorts ✔ 9332606886✔ Full Night With Room Online Booking...
Independent Hatiara Escorts ✔ 9332606886✔ Full Night With Room Online Booking...Independent Hatiara Escorts ✔ 9332606886✔ Full Night With Room Online Booking...
Independent Hatiara Escorts ✔ 9332606886✔ Full Night With Room Online Booking...Riya Pathan
 
Science City Kolkata ( Call Girls ) Kolkata ✔ 6297143586 ✔ Hot Model With Sex...
Science City Kolkata ( Call Girls ) Kolkata ✔ 6297143586 ✔ Hot Model With Sex...Science City Kolkata ( Call Girls ) Kolkata ✔ 6297143586 ✔ Hot Model With Sex...
Science City Kolkata ( Call Girls ) Kolkata ✔ 6297143586 ✔ Hot Model With Sex...rahim quresi
 
Borum Call Girls Service ☎ ️93326-06886 ❤️‍🔥 Enjoy 24/7 Escort Service
Borum Call Girls Service ☎ ️93326-06886 ❤️‍🔥 Enjoy 24/7 Escort ServiceBorum Call Girls Service ☎ ️93326-06886 ❤️‍🔥 Enjoy 24/7 Escort Service
Borum Call Girls Service ☎ ️93326-06886 ❤️‍🔥 Enjoy 24/7 Escort ServiceDamini Dixit
 
↑Top Model (Kolkata) Call Girls Howrah ⟟ 8250192130 ⟟ High Class Call Girl In...
↑Top Model (Kolkata) Call Girls Howrah ⟟ 8250192130 ⟟ High Class Call Girl In...↑Top Model (Kolkata) Call Girls Howrah ⟟ 8250192130 ⟟ High Class Call Girl In...
↑Top Model (Kolkata) Call Girls Howrah ⟟ 8250192130 ⟟ High Class Call Girl In...noor ahmed
 
📞 Contact Number 8617697112 VIP Ganderbal Call Girls
📞 Contact Number 8617697112 VIP Ganderbal Call Girls📞 Contact Number 8617697112 VIP Ganderbal Call Girls
📞 Contact Number 8617697112 VIP Ganderbal Call GirlsNitya salvi
 
Call Girls Agency In Goa 💚 9316020077 💚 Call Girl Goa By Russian Call Girl ...
Call Girls  Agency In Goa  💚 9316020077 💚 Call Girl Goa By Russian Call Girl ...Call Girls  Agency In Goa  💚 9316020077 💚 Call Girl Goa By Russian Call Girl ...
Call Girls Agency In Goa 💚 9316020077 💚 Call Girl Goa By Russian Call Girl ...russian goa call girl and escorts service
 
Top Rated Pune Call Girls Pimpri Chinchwad ⟟ 6297143586 ⟟ Call Me For Genuin...
Top Rated  Pune Call Girls Pimpri Chinchwad ⟟ 6297143586 ⟟ Call Me For Genuin...Top Rated  Pune Call Girls Pimpri Chinchwad ⟟ 6297143586 ⟟ Call Me For Genuin...
Top Rated Pune Call Girls Pimpri Chinchwad ⟟ 6297143586 ⟟ Call Me For Genuin...Call Girls in Nagpur High Profile
 
𓀤Call On 6297143586 𓀤 Sonagachi Call Girls In All Kolkata 24/7 Provide Call W...
𓀤Call On 6297143586 𓀤 Sonagachi Call Girls In All Kolkata 24/7 Provide Call W...𓀤Call On 6297143586 𓀤 Sonagachi Call Girls In All Kolkata 24/7 Provide Call W...
𓀤Call On 6297143586 𓀤 Sonagachi Call Girls In All Kolkata 24/7 Provide Call W...rahim quresi
 
Independent Joka Escorts ✔ 8250192130 ✔ Full Night With Room Online Booking 2...
Independent Joka Escorts ✔ 8250192130 ✔ Full Night With Room Online Booking 2...Independent Joka Escorts ✔ 8250192130 ✔ Full Night With Room Online Booking 2...
Independent Joka Escorts ✔ 8250192130 ✔ Full Night With Room Online Booking 2...noor ahmed
 
Hotel And Home Service Available Kolkata Call Girls Sonagachi ✔ 6297143586 ✔C...
Hotel And Home Service Available Kolkata Call Girls Sonagachi ✔ 6297143586 ✔C...Hotel And Home Service Available Kolkata Call Girls Sonagachi ✔ 6297143586 ✔C...
Hotel And Home Service Available Kolkata Call Girls Sonagachi ✔ 6297143586 ✔C...ritikasharma
 

Último (20)

Top Rated Pune Call Girls Dhayari ⟟ 6297143586 ⟟ Call Me For Genuine Sex Ser...
Top Rated  Pune Call Girls Dhayari ⟟ 6297143586 ⟟ Call Me For Genuine Sex Ser...Top Rated  Pune Call Girls Dhayari ⟟ 6297143586 ⟟ Call Me For Genuine Sex Ser...
Top Rated Pune Call Girls Dhayari ⟟ 6297143586 ⟟ Call Me For Genuine Sex Ser...
 
Goa Call "Girls Service 9316020077 Call "Girls in Goa
Goa Call "Girls  Service   9316020077 Call "Girls in GoaGoa Call "Girls  Service   9316020077 Call "Girls in Goa
Goa Call "Girls Service 9316020077 Call "Girls in Goa
 
↑Top Model (Kolkata) Call Girls Behala ⟟ 8250192130 ⟟ High Class Call Girl In...
↑Top Model (Kolkata) Call Girls Behala ⟟ 8250192130 ⟟ High Class Call Girl In...↑Top Model (Kolkata) Call Girls Behala ⟟ 8250192130 ⟟ High Class Call Girl In...
↑Top Model (Kolkata) Call Girls Behala ⟟ 8250192130 ⟟ High Class Call Girl In...
 
Russian ℂall gIRLS In Goa 9316020077 ℂall gIRLS Service In Goa
Russian ℂall gIRLS In Goa 9316020077  ℂall gIRLS Service  In GoaRussian ℂall gIRLS In Goa 9316020077  ℂall gIRLS Service  In Goa
Russian ℂall gIRLS In Goa 9316020077 ℂall gIRLS Service In Goa
 
Nayabad Call Girls ✔ 8005736733 ✔ Hot Model With Sexy Bhabi Ready For Sex At ...
Nayabad Call Girls ✔ 8005736733 ✔ Hot Model With Sexy Bhabi Ready For Sex At ...Nayabad Call Girls ✔ 8005736733 ✔ Hot Model With Sexy Bhabi Ready For Sex At ...
Nayabad Call Girls ✔ 8005736733 ✔ Hot Model With Sexy Bhabi Ready For Sex At ...
 
Karnal Call Girls 8860008073 Dyal Singh Colony Call Girls Service in Karnal E...
Karnal Call Girls 8860008073 Dyal Singh Colony Call Girls Service in Karnal E...Karnal Call Girls 8860008073 Dyal Singh Colony Call Girls Service in Karnal E...
Karnal Call Girls 8860008073 Dyal Singh Colony Call Girls Service in Karnal E...
 
Independent Garulia Escorts ✔ 9332606886✔ Full Night With Room Online Booking...
Independent Garulia Escorts ✔ 9332606886✔ Full Night With Room Online Booking...Independent Garulia Escorts ✔ 9332606886✔ Full Night With Room Online Booking...
Independent Garulia Escorts ✔ 9332606886✔ Full Night With Room Online Booking...
 
Dakshineswar Call Girls ✔ 8005736733 ✔ Hot Model With Sexy Bhabi Ready For Se...
Dakshineswar Call Girls ✔ 8005736733 ✔ Hot Model With Sexy Bhabi Ready For Se...Dakshineswar Call Girls ✔ 8005736733 ✔ Hot Model With Sexy Bhabi Ready For Se...
Dakshineswar Call Girls ✔ 8005736733 ✔ Hot Model With Sexy Bhabi Ready For Se...
 
Independent Hatiara Escorts ✔ 9332606886✔ Full Night With Room Online Booking...
Independent Hatiara Escorts ✔ 9332606886✔ Full Night With Room Online Booking...Independent Hatiara Escorts ✔ 9332606886✔ Full Night With Room Online Booking...
Independent Hatiara Escorts ✔ 9332606886✔ Full Night With Room Online Booking...
 
Science City Kolkata ( Call Girls ) Kolkata ✔ 6297143586 ✔ Hot Model With Sex...
Science City Kolkata ( Call Girls ) Kolkata ✔ 6297143586 ✔ Hot Model With Sex...Science City Kolkata ( Call Girls ) Kolkata ✔ 6297143586 ✔ Hot Model With Sex...
Science City Kolkata ( Call Girls ) Kolkata ✔ 6297143586 ✔ Hot Model With Sex...
 
Borum Call Girls Service ☎ ️93326-06886 ❤️‍🔥 Enjoy 24/7 Escort Service
Borum Call Girls Service ☎ ️93326-06886 ❤️‍🔥 Enjoy 24/7 Escort ServiceBorum Call Girls Service ☎ ️93326-06886 ❤️‍🔥 Enjoy 24/7 Escort Service
Borum Call Girls Service ☎ ️93326-06886 ❤️‍🔥 Enjoy 24/7 Escort Service
 
↑Top Model (Kolkata) Call Girls Howrah ⟟ 8250192130 ⟟ High Class Call Girl In...
↑Top Model (Kolkata) Call Girls Howrah ⟟ 8250192130 ⟟ High Class Call Girl In...↑Top Model (Kolkata) Call Girls Howrah ⟟ 8250192130 ⟟ High Class Call Girl In...
↑Top Model (Kolkata) Call Girls Howrah ⟟ 8250192130 ⟟ High Class Call Girl In...
 
📞 Contact Number 8617697112 VIP Ganderbal Call Girls
📞 Contact Number 8617697112 VIP Ganderbal Call Girls📞 Contact Number 8617697112 VIP Ganderbal Call Girls
📞 Contact Number 8617697112 VIP Ganderbal Call Girls
 
Call Girls Agency In Goa 💚 9316020077 💚 Call Girl Goa By Russian Call Girl ...
Call Girls  Agency In Goa  💚 9316020077 💚 Call Girl Goa By Russian Call Girl ...Call Girls  Agency In Goa  💚 9316020077 💚 Call Girl Goa By Russian Call Girl ...
Call Girls Agency In Goa 💚 9316020077 💚 Call Girl Goa By Russian Call Girl ...
 
CHEAP Call Girls in Malviya Nagar, (-DELHI )🔝 9953056974🔝(=)/CALL GIRLS SERVICE
CHEAP Call Girls in  Malviya Nagar, (-DELHI )🔝 9953056974🔝(=)/CALL GIRLS SERVICECHEAP Call Girls in  Malviya Nagar, (-DELHI )🔝 9953056974🔝(=)/CALL GIRLS SERVICE
CHEAP Call Girls in Malviya Nagar, (-DELHI )🔝 9953056974🔝(=)/CALL GIRLS SERVICE
 
Top Rated Pune Call Girls Pimpri Chinchwad ⟟ 6297143586 ⟟ Call Me For Genuin...
Top Rated  Pune Call Girls Pimpri Chinchwad ⟟ 6297143586 ⟟ Call Me For Genuin...Top Rated  Pune Call Girls Pimpri Chinchwad ⟟ 6297143586 ⟟ Call Me For Genuin...
Top Rated Pune Call Girls Pimpri Chinchwad ⟟ 6297143586 ⟟ Call Me For Genuin...
 
Goa Call Girls 9316020077 Call Girls In Goa By Russian Call Girl in goa
Goa Call Girls 9316020077 Call Girls  In Goa By Russian Call Girl in goaGoa Call Girls 9316020077 Call Girls  In Goa By Russian Call Girl in goa
Goa Call Girls 9316020077 Call Girls In Goa By Russian Call Girl in goa
 
𓀤Call On 6297143586 𓀤 Sonagachi Call Girls In All Kolkata 24/7 Provide Call W...
𓀤Call On 6297143586 𓀤 Sonagachi Call Girls In All Kolkata 24/7 Provide Call W...𓀤Call On 6297143586 𓀤 Sonagachi Call Girls In All Kolkata 24/7 Provide Call W...
𓀤Call On 6297143586 𓀤 Sonagachi Call Girls In All Kolkata 24/7 Provide Call W...
 
Independent Joka Escorts ✔ 8250192130 ✔ Full Night With Room Online Booking 2...
Independent Joka Escorts ✔ 8250192130 ✔ Full Night With Room Online Booking 2...Independent Joka Escorts ✔ 8250192130 ✔ Full Night With Room Online Booking 2...
Independent Joka Escorts ✔ 8250192130 ✔ Full Night With Room Online Booking 2...
 
Hotel And Home Service Available Kolkata Call Girls Sonagachi ✔ 6297143586 ✔C...
Hotel And Home Service Available Kolkata Call Girls Sonagachi ✔ 6297143586 ✔C...Hotel And Home Service Available Kolkata Call Girls Sonagachi ✔ 6297143586 ✔C...
Hotel And Home Service Available Kolkata Call Girls Sonagachi ✔ 6297143586 ✔C...
 

Ubisoft Reports First-Half 2010-11 Results

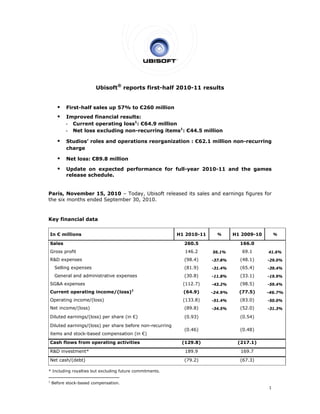
  • 1. Ubisoft® reports first-half 2010-11 results  First-half sales up 57% to €260 million  Improved financial results: - Current operating loss1: €64.9 million - Net loss excluding non-recurring items1: €44.5 million  Studios’ roles and operations reorganization : €62.1 million non-recurring charge  Net loss: €89.8 million  Update on expected performance for full-year 2010-11 and the games release schedule. Paris, November 15, 2010 – Today, Ubisoft released its sales and earnings figures for the six months ended September 30, 2010. Key financial data In € millions H1 2010-11 % H1 2009-10 % Sales 260.5 166.0 Gross profit 146.2 56.1% 69.1 41.6% R&D expenses (98.4) -37.8% (48.1) -29.0% Selling expenses (81.9) -31.4% (65.4) -39.4% General and administrative expenses (30.8) -11.8% (33.1) -19.9% SG&A expenses (112.7) -43.2% (98.5) -59.4% 1 Current operating income/(loss) (64.9) -24.9% (77.5) -46.7% Operating income/(loss) (133.8) -51.4% (83.0) -50.0% Net income/(loss) (89.8) -34.5% (52.0) -31.3% Diluted earnings/(loss) per share (in €) (0.93) (0.54) Diluted earnings/(loss) per share before non-recurring (0.46) (0.48) items and stock-based compensation (in €) Cash flows from operating activities (129.8) (217.1) R&D investment* 189.9 169.7 Net cash/(debt) (79.2) (67.3) * Including royalties but excluding future commitments. 1 Before stock-based compensation. 1
  • 2. Yves Guillemot, Chief Executive Officer, stated "Ubisoft continued to win market share during the first nine months of 2010. Our sales figure for the first half of fiscal 2010-11 was boosted by a greater number of releases of High Definition games, solid back- catalog sales and very positive revenue momentum from our digital activities. The market environment continues to be tough and, although our gross profit rose sharply, the increase was lower than we expected and we had to accelerate depreciations on certain released titles." Sales Sales for the first six months of 2010-11 came to €260 million, up 56.7% (or 46.0% at constant exchange rates) on the €166 million recorded for the same period of 2009-10. Sales for the second quarter of 2010-11 totaled €99 million versus €83 million for the same period of 2009-10, representing an increase of 19.3% (12.3% at constant exchange rates). Second-quarter 2010-11 sales were higher than the guidance of around €83 million issued when Ubisoft released its sales figures for the first quarter of 2010-11. The second quarter saw the following: − Tom Clancy’s H.A.W.X.® 2 and R.U.S.E.™ performed below expectations. − Solid back-catalog sales, led mainly by Just Dance®. − A twofold increase in digital sales, propelled by the notable success of Scott Pilgrim on XBLA and PSN, as well as downloadable content (DLC) and sales of PC games. During the first nine months of calendar 2010, Ubisoft continued to gain market share in Europe (8.4% versus 7.5% last year) and in the United States (5.2% versus 4.2%). Main income statement items Gross profit represented a significantly higher percentage of sales in first-half 2010-11, coming in at 56.1% (€146.2 million) against 41.6% (€69.1 million) in the same period of 2009-10. This performance was achieved thanks to a greater number of higher margin Xbox 360® and PlayStation®3 titles released, coupled with an improved showing from back-catalog games. The increase was not as high as expected due to the underperformance of certain High Definition games and returns from the Group’s merchandising activity. Ubisoft ended the period with a €64.9 million current operating loss before stock-based compensation, marking an improvement on the €77.5 million loss recorded for the first six months of 2009-10. The first-half 2010-11 figure reflects the following combined factors:  A €77.1 million increase in gross profit.  A €50.3 million increase in R&D expenses, which came to €98.4 million, representing 37.8% of sales, versus €48.1 million (29.0% of sales) in first-half 2009-10. This rise was chiefly attributable to a greater number of titles released for the Xbox 360® and PlayStation®3, accelerated R&D depreciation on certain titles released during the period, and a change in accounting method which resulted in the recognition of R&D depreciation in the first half of the year that is usually recognized in the second half. 2
  • 3. A decrease in SG&A expenses as a percentage of sales to 43.2% (€112.7 million) versus 59.4% (€98.5 million) in first-half 2009-10: − Variable marketing expenses represented 21.5% of sales (€56.0 million) compared with 25.2% (€41.9 million) in the first six months of 2009-10. − Structure costs corresponded to 21.7% of sales (€56.7 million) compared with 34.1% (€56.6 million) in first-half 2009-10. Non-recurring reorganization charges Ubisoft is taking measures to adapt its structure to the major changes in the industry by reorganizing the roles and operations of its studios, which has resulted in the termination of certain projects. Consequently, the Company recognized €62.1 million in non-recurring reorganization charges in the first half of 2010-11. Those charges had a limited impact on cash flow. Taking into account these €62.1 million non-recurring charges, Ubisoft recorded an operating loss of €133.8 million in the first six months of 2010-11, compared with €83.0 million in the same period of 2009-10. This figure also includes stock-based compensation of €5.4 million for first-half 2010-11 (€5.5 million in first-half 2009-10). Net financial expense came to €1.7 million (compared with net financial income of €6.6 million in first-half 2009-10), primarily breaking down as follows:  €3.9 million in financial charges compared with €0.0 million in first-half 2009-10. This figure included €3.6 million related to the sale of tax carry-back receivables.  €2.3 million in foreign exchange losses, versus foreign exchange gains of €6.6 million in first-half 2009-10.  A €4.7 million positive impact from the sale of 2.1 million Gameloft shares. Following this transaction, 7 million Gameloft shares are still recorded as part of the Equity Swap. Ubisoft ended the first six months of fiscal 2010-11 with an €89.8 million net loss, representing a diluted loss per share of €0.93, versus a net loss of €52.0 million and a diluted loss per share of €0.54 in the first half of 2009-10. Excluding non-recurring items and before stock-based compensation, the net loss would have amounted to €44.5 million, representing a diluted loss per share of €0.46, versus a net loss of €46.6 million and a diluted loss per share of €0.48 for the first six months of 2009-10. Main cash flow statement and balance sheet items Cash flows from operating activities came to a negative €129.8 million versus a negative €217.1 million in first-half 2009-10, representing a significant year-on-year improvement of €87.3 million. It reflects a negative €99.2 million in cash flow from operations (versus a negative €154.9 million in the same period of 2009-10) and a €30.6 million increase in working capital requirement (against a €62.2 million increase in first-half 2009-10). At September 30, 2010, Ubisoft had net debt of €79.2 million. The change from the net cash position of €41.3 million at March 31, 2010 primarily reflects: - The above-mentioned €129.8 million net cash outflow from operating activities, which includes €8 million from the sale of the Gameloft shares. - The sales of tax carry-back receivables for €22.0 million. - €13.3 million in purchases of tangible and intangible assets. 3
  • 4. Outlook Full-year 2010-11 Yves Guillemot stated, "Ubisoft’s outlook is extremely encouraging for the upcoming Christmas period. Just Dance 2, launched in mid-October, is the Wii phenomenon of the moment, with sales up 75%. Assassin’s Creed Brotherhood has the potential to outstrip the exceptional performance of the previous episodes, with pre-orders up 25% over Assassin’s Creed II. The initial reviews have been extremely positive, praising the breadth of the single-player experience as well as the game’s revolutionary multiplayer mode. Both Just Dance 2 and Assassin’s Creed Brotherhood testify to the creative power of our teams and the impact of the promotional campaigns put in place by our marketing teams. Michael Jackson The Experience and Raving Rabbids Travel in Time are also expected to contribute to our success in the coming quarter, which looks set to see record performances. We are also encouraged by the very positive early performance of Kinect and the good showing of our games for this system, especially Your Shape: Fitness Evolved which is the best selling third-party game for Kinect in the United States." Yves Guillemot continued, "For full-year 2010-11 we are standing by our targets of achieving sales growth, a return to profitability and positive cash flow generation, a significant improvement on 2009-10. Current operating income1 breakeven point is now estimated at around €960 million. Our cost structure has been impacted by accelerated write-downs recorded on titles launched in the first half of the year, fluctuations in exchange rates, growth of digital expenses, and a product mix more biased towards casual games, which require more marketing and royalty payments. Based on currently available information and taking into account the positive signs for the Christmas period and our significantly higher forecasts for the casual segment, we expect our sales to come in above €960 million for the full year." Yves Guillemot concluded, "Ubisoft is now armed with a balance sheet that is better adapted to the requirements of the industry and we have a solid financial position as well as €280 million committed credit facilities. We are continuing to overhaul our studios roles, operations and structures in order to meet the new challenges in our industry and are focused on offering highly innovative and creative products, as well as on enhancing quality levels, releasing new iterations of our major franchises on a more regular basis, providing gamers with an ever-richer online experience and attracting a constantly growing number of casual gamers. The outstanding efforts of Ubisoft’s teams in these areas will enable us to fully leverage the numerous opportunities coming up in the High Definition, Casual and Online segments." Sales for the third quarter of 2010-11 The third quarter will see the following main releases: - Assassin’s Creed® Brotherhood for Xbox 360®, PLAYSTATION® 3 and Facebook® - Just Dance® 2 and Just Dance® Kids for the Wii™ - Raving Rabbids Travel in Time™ for the Wii™ - Michael Jackson The Experience for the Wii™, Nintendo DS™ and PSP™ - Your Shape™: Fitness Evolved, MotionSports™ and Fighters Uncaged™ for Xbox 360™ Kinect The Group expects third quarter 2010-11 sales of around €520 million, approximately 5% higher than in the third quarter of 2009-10. Update on the games release schedule Tom Clancy’s Ghost Recon Future Soldier™ and Driver® San Francisco, which were previously planned for release in the fourth fiscal quarter, will now be included in the 2011-12 line-up. 1 Before stock-based compensation. 4
  • 5. Significant events Market share: In the first nine months of calendar 2010, Ubisoft was the number 4 independent publisher in the United States with 5.2% market share (compared with number 4 and 4.2% one year earlier) and was number 3 in Europe with 8.4% market share (compared with number 3 and 7.5% one year earlier). New credit facilities: Ubisoft has been granted new cash credit lines amounting to €70 million and expiring in May 2013, and has carried out no-recourse sales for €25.6 million worth of tax receivables due in 2016. Sale of Gameloft shares: In the first half of 2010-11, 2.1 million Gameloft shares were sold for €8.0 million, resulting in a gain of €4.7 million. Acquisition of Quazal: Ubisoft has acquired Quazal Technologies, a leader in the creation of multiplayer middleware and services for video game developers. These solutions are integrated in the development of the majority of Ubisoft’s key titles, including Assassin's Creed® Brotherhood, which was named “Best Online Game” at E3 2010. This acquisition guarantees Ubisoft a solid technology that will help it attain the ambitious objectives of its online strategy. Contact Investor Relations Jean-Benoît Roquette Head of Investor Relations + 33 1 48 18 52 39 Jean-benoit.roquette@ubisoft.com Disclaimer This statement may contain estimated financial data, information on future projects and transactions and future business results/performance. Such forward-looking data are provided for estimation purposes only. They are subject to market risks and uncertainties and may vary significantly compared with the actual results that will be published. The estimated financial data have been presented to the Board of Directors and have not been audited by the Statutory Auditors. (Additional information is specified in the most recent Ubisoft Registration Document filed on June 30, 2010 with the French Financial Markets Authority (l’Autorité des marchés financiers)). About Ubisoft: Ubisoft is a leading producer, publisher and distributor of interactive entertainment products worldwide and has grown considerably through a strong and diversified line-up of products and partnerships. Ubisoft has offices in 26 countries and has sales in more than 55 countries around the globe. It is committed to delivering high- quality, cutting-edge video game titles to consumers. For the 2009-10 fiscal year Ubisoft generated sales of € 871 million. To learn more, please visit: www.ubisoftgroup.com. © 2010 Ubisoft Entertainment. All Rights Reserved. Ubisoft and the Ubisoft logo are trademarks of Ubisoft Entertainment in the U.S. and/or other countries. 5
  • 6. APPENDICES Breakdown of sales by geographic region % Sales % Sales % Sales % Sales 6 months 6 months Q2 2010/11 Q2 2009/10 2010/11 2009/10 Europe 39% 46% 39% 48% North America 52% 48% 52% 41% Rest of world 9% 6% 9% 11% TOTAL 100% 100% 100% 100% Breakdown of sales by platform 6 months 6 months Q2 2010/11 Q2 2009/10 2010/11 2009/10 Nintendo DS™ 10% 24% 7% 23% PC 2% 12% 6% 17% PlayStation®2 1% 3% 0% 2% PLAYSTATION®3 31% 17% 22% 15% PSP™ 6% 6% 5% 5% Wii™ 29% 25% 23% 22% XBOX 360™ 20% 11% 36% 14% Autres 1% 1% 1% 2% TOTAL 100% 100% 100% 100% Breakdown of sales by business line 6 months 6 months Q2 2010/11 Q2 2009/10 2010/11 2009/10 Development 98% 66% 98% 73% Publishing 4% 22% 2% 20% Distribution -2% 12% 0% 8% TOTAL 100% 100% 100% 100% 6
  • 7. Title Release Schedule 3rd Quarter (October – December 2010) ASSASSIN’S CREED® BROTHERHOOD Xbox 360™, PLAYSTATION®3 BATTLE OF GIANTS® DINOSAURS STRIKE Wii™ BIG BOND THEORY iPad BLOODY GOOD TIME™ PC, XBLA CRYSTAL SHUFFLE iPhone CSI: CRIME SCENE INVESTIGATION™: CRIME CITY Facebook Xbox 360™, CSI: CRIME SCENE INVESTIGATION™: FATAL CONSPIRACY PLAYSTATION®3, Wii™, PC CSI: CRIME SCENE INVESTIGATION™: UNSOLVED! Nintendo DS™ ® FAMILY FEUD DECADES (US) Wii™ FIGHTERS UNCAGED™ Xbox 360™ Kinect GIRLS LIFE™ CLOTHES AND ACCESSORIES (EMEA) Nintendo DS™ HOLLYWOOD SQUARES (US) Wii™ IMAGINE® FASHION STYLIST Nintendo DS™ IMAGINE® RESORT OWNER (US) Nintendo DS™ JUST DANCE® 2 Wii™ ® JUST DANCE KIDS (US) Wii™ MICHAEL JACKSON THE EXPERIENCE Wii™, Nintendo DS™, PSP™ MOTIONSPORTS™ Xbox 360™ Kinect PAYUTA® & THE ICE GOD iPad PETZ® CATZ® PLAYGROUND (US) Nintendo DS™ PETZ FANTASY™ MOONLIGHT MAGIC (US) Nintendo DS™ PETZ FANTASY™ SUNSHINE MAGIC (US) Nintendo DS™ PETZ NURSERY™ 2 (US) Nintendo DS™ PRINCE OF PERSIA THE SANDS OF TIME™ PSN PRINCE OF PERSIA THE TWO THRONES® PSN ® PRINCE OF PERSIA TRILOGY (EMEA) PLAYSTATION®3 ® PRINCE OF PERSIA WARRIOR WITHIN PSN RAVING RABBIDS TRAVEL IN TIME™ Wii™ Xbox 360™, SHAUN WHITE SKATEBOARDING PLAYSTATION®3, Wii™, PC THE AMAZING RACE™ (US) Wii™ THE SETTLERS® OF TANDRIA iPad, iPhone TOM CLANCY’S GHOST RECON® PREDATOR (US) PSP™ TOM CLANCY’S GHOST RECON® Wii™ TOM CLANCY’S H.A.W.X.® 2 PC, Wii™ WHO WANTS TO BE A MILLIONAIRE™ 2010 (US) Wii™, Nintendo DS™ YOUR SHAPE™: FITNESS EVOLVED Xbox 360™ Kinect 7
  • 8. Consolidated income statement In thousand of euros 09/30/10 09/30/09       Sales 260 544 165 957 Cost of sales -114 360 -96 870 Gross Margin 146 184 69 087 Research and Development costs -98 406 -48 070 Marketing costs -81 888 -65 393 General and Administrative costs -30 775 -33 104 Current operating income -64 885 -77 480 Fair Value Variation -1 360 0 Other operating income and expenses -62 130 -3 Stock-based compensation -5 378 -5 501 Operating income -133 753 -82 984 Net borrowing costs -3 944 66 Net foreign exchange losses -2 334 6 637 Other financial income and expenses 4 582 -100 Net financial income -1 696 6 603 Share of profit of associates 46 125 Income tax 45 627 24 230 Profit for the period -89 776 -52 026 Earnings per share Basic earnings per share (in €)* -0,95 -0,55 Diluted earnings per share (in €)* -0,93 -0,54 Weighted average number of shares in issue (*) 94 387 94 080 Diluted weighted average number of shares in issue (*) 96 862 96 682 (*) After stock split. 8
  • 9. Consolidated balance sheet ASSETS Net Net In thousands of euros 9/30/10 3/31/10 Goodwill 104 774 106 498 Other intangible assets 540 396 526 383 Property, plant and equipment 35 497 31 800 Investments in associates 440 393 Other financial assets 3 463 3 613 Deferred tax assets 86 500 65 884 Non current assets 771 070 734 571 Inventory 46 742 47 973 Trade receivables 43 890 68 748 Other receivables 65 213 89 159 Other current financial assets 28 298 33 271 Current tax assets 10 971 25 080 Cash and cash equivalents 125 366 185 316 Current assets 320 480 449 547 Total assets 1 091 550 1 184 118 LIABILITIES AND EQUITY 9/30/10 3/31/10 In thousand of euros Capital 7 324 7 320 Premiums 519 284 512 444 Consolidated reserves 237 949 285 380 Consolidated earnings - 89 777 - 43 672 Equity (Group share) 674 780 761 472 Minority interests Total equity 674 780 761 472 Provisions 2 220 2 215 Employee benefit 1 855 1 710 Long-term borrowings 21 917 22 548 Deferred tax liabilities 26 008 32 921 Non-current liabilities 52 000 59 394 Short-term borrowings 183 780 121 784 Trade payables 104 825 144 499 Other liabilities 67 738 93 617 Current tax liabilities 8 427 3 352 Current liabilities 364 770 363 252 Total liabilities 416 770 422 646 Total liabilities and equity 1 091 550 1 184 118 9
  • 10. Consolidated cash flow statement for comparison with other industry players In thousand of euros 9/30/10 9/30/09 Cash flows from operating activities Consolidated earnings -89 777 -52 027 +/- Share of profit of associates -46 -125 +/- Amortization of game software 144 290 41 410 +/- Other amortization 10 962 7 656 +/- Provisions 2 296 215 +/- Cost of share-based payments 5 378 5 501 +/- Gains / losses on disposals 41 17 +/- Other income and expenses calculated 3 291 9 619 +/- Costs of internal development and license development -175 658 -167 152 CASH FLOW FROM OPERATIONS -99 223 -154 886 Inventory -694 5 034 Trade receivables 24 944 289 Other assets -4 878 -43 880 Trade payables -22 568 -12 794 Other liabilities -27 401 -10 877 +/-Change in working capital from operating activities -30 597 -62 228 TOTAL CASH FLOW GENERATED BY OPERATING ACTIVITIES -129 820 -217 114 Cash flows from investing activities - Payments for the acquisition of property, plant and equipment and other intangible assets -13 376 -5 328 + Proceeds from the disposal of intangible assets and property, plant and equipment 61 12 - Payments for the acquisition of financial assets -7 444 -8 634 + Repayment of loans and other financial assets 7 625 8 695 +/- Changes in scope -173 0 CASH USED BY INVESTING ACTIVITIES -13 307 -5 255 Cash flows from financing activities + New finance leases 44 129 - Repayment of finance leases -99 -28 - Repayment of borrowings -755 -633 + Proceeds from shareholders in capital increases 323 4 131 +/- Sales / purchases of own shares -217 -95 +/- Tax Carry back receivables sold 21 886 0 CASH GENERATED (USED) BY FINANCING ACTIVITIES 21 212 3 547 Net change in cash and cash equivalents -121 915 -218 822 Cash and cash equivalents at the beginning of the fiscal year 64 978 176 890 Impact of translation adjustments 584 -2 916 Cash and cash equivalents at the end of the fiscal year -56 353 -44 850 10
  • 11. Consolidated cash flow statement In thousand of euros 9/30/10 9/30/09 Cash flows from operating activities Consolidated earnings -89 777 -52 027 +/- Share of profit of associates -46 -125 +/- Depreciation and amortization 155 252 49 066 +/- Provisions 2 296 215 +/- Cost of share-based payments 5 378 5 501 +/- Gains / losses on disposals 41 17 +/- Other income and expenses calculated 3 291 9 619 + Income tax paid - 45 627 - 24 230 Inventory -694 5 034 Trade receivables 24944 289 Other assets 39 071 6 382 Trade payables -22 568 -12 794 Other liabilities -19 791 -33 229 +/-Change in working capital from operating activities 20 962 -34 318 TOTAL CASH FLOW GENERATED BY OPERATING 51 770 -46 282 ACTIVITIES - Income tax paid -5 932 -3 681 NET CASH GENERATED BY OPERATING ACTIVITIES 45 838 -49 963 Cash flows from investing activities - Payments for the acquisition of intangible assets and property, -175 658 -167 152 plant and equipment + Proceeds from the disposal of intangible assets and property, -13 376 -5 328 plant and equipment - Payments for the acquisition of financial assets 61 11 +/- Other cash flows from investing activities -7 444 -8 634 + Repayment of loans and other financial assets 7 625 8 695 (1) +/- Changes in scope -173 0 CASH USED BY INVESTING ACTIVITIES -188 965 -172 408 Cash flows from financing activities + New finance leases 44 129 + New borrowings 30 43 - Repayment of finance leases -99 -28 - Repayment of borrowings -755 -633 + Proceeds from shareholders in capital increases 323 4 131 +/- Sales / purchases of own shares -217 -95 +/- Tax Carry back receivables sold 21 886 0 CASH GENERATED (USED) BY FINANCING ACTIVITIES 21 212 3 547 Net change in cash and cash equivalents -121 915 -218 824 Cash and cash equivalents at the beginning of the fiscal year -64 976 -176 890 Impact of translation adjustments 584 -2 916 Cash and cash equivalents at the end of the fiscal year -56 355 -44 850 11