Measures of Dispersion and Variability: Range, QD, AD and SD
Iirs rstechnologypdf
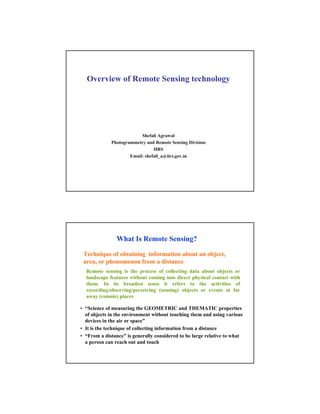
1. Overview of Remote Sensing technology
Shefali Agrawal
Photogrammetry and Remote Sensing Division
IIRS
Email: shefali_a@iirs.gov.in
What Is Remote Sensing?
Technique of obtaining information about an object,
area, or phenomenon from a distance
Remote sensing is the process of collecting data about objects or
landscape features without coming into direct physical contact with
them. In its broadest sense it refers to the activities of
recording/observing/perceiving (sensing) objects or events at far
away (remote) places
• “Science of measuring the GEOMETRIC and THEMATIC properties
of objects in the environment without touching them and using various
devices in the air or space”
• It is the technique of collecting information from a distance
• “From a distance” is generally considered to be large relative to what
a person can reach out and touch
2. The Remote Sensing Process
Energy Source Sensor SatCom
Application
Target
Processing
Station Analysis
The EM spectrum
‘Optical range’
Cosmic Gamma X-
Radio Electric power
U-V Infrared Micro-waves TV
rays rays Rays
Visible spectrum
Ultraviolet Blue Green Red Infrared (IR)
0.3μm 0.4 0.5μm 0.6 0.7μm 10.0 15.0
300nm 500nm 700nm
Wavelength
3. The size of a cell we call image resolution, depending on…
Such as 1 m, 30 m, 1 km, or 4 km
Types of remote sensing
• Passive: source of • Active: source of
energy is either the Sun, energy is part of the
Earth, or atmosphere remote sensor system
– Sun – Radar
- wavelengths: 0.4-5 µm - wavelengths: mm-m
– Earth or its atmosphere – Lidar
- wavelengths: 3 µm -30 - wavelengths: UV,
cm Visible, and near
infrared
4. Remote sensing is classified into three types with respect
to the wavelength regions;
• Visible and Reflective Infrared Remote Sensing,
0.4µm to 3 µm
• Thermal Infrared Remote Sensing and
3 µm to 35 µm
• Microwave Remote Sensing,
1mm to 1m
Interactions with the Atmosphere
The two major atmospheric effects are scattering and
absorption
A) Scattering B) Absorption
⇒ Scattering occurs when particles or large gas molecules present in the atmosphere interact with
and cause the electromagnetic radiation to be redirected from its original path
⇒ Absorbption causes molecules in the atmosphere to absorb energy at various wavelengths.
Ozone, carbon dioxide, and water vapour are the three main atmospheric constituents which
absorb radiation
5. Atmospheric windows suitable for Earth observations
from space,
Atmosphere
transmission (%)
100
50
0
0.4 0.7 1 2 3 5 10 (...) 10,000 µm
Interactions with the surface
Sun
scattered Incident energy
radiation**
R.S. Instrument
Scattered Atmospheric
Clouds radiation* emission
Atmospheric transmitted Reflected Thermal emission
absorption radiation radiation
Earth Reflection processes Emission processes
6. • For example A white surface reflects equal amounts of
radiation of all wavelengths of visible light.
• A green object reflects less in red and blue parts of the
spectrum than in green. The excess reflection in green
wavelength makes makes the object appear green.
• So, the composition of electromagnetic reflection (spectral
signature )tells us about the surface reflecting the
radiation.
Spectral reflectance of vegetation
9. (a)
(b)
IRS LISS-3 image over part of Himalayas. (a) is in band-2 (Green) and (b) in band-5 (SWIR).
Both cloud and snow have higher reflectance in visible and hence cannot be discriminated
(except from shadow). In SWIR, low reflectance of snow can discriminate snow from cloud.
10. Platforms
Sensing from 1 meter to 36,000 km
height
Platforms are:
•Ground based
•Airborne
•Spaceborne
11. Space borne remote sensing
Spot off nadir
Geostationary Orbit
A satellite that appears to remain in the same position above
the Earth is called a "geostationary satellite."
Credit: C.M.Kishtawal, SAC
12. Polar Orbits
An orbit with a inclination of 90
degrees, or close to it, is called a
"polar orbit." Because the Earth is
rotating as the satellite follows a
polar orbit, the satellite can survey
the whole of the Earth's surface,
including the poles, in a few days.
Many observation satellites that
need to cover the entire Earth are in
polar or near-polar orbits.
Credit: C.M.Kishtawal, SAC
13. Selection of Sensor Parameters
Information collected by sensor should be sufficient enough to meet
accuracy in class discrimination and mapping.
• Spatial resolution
• Spectral resolution
λ
• (Radiometric resolution)
• Temporal resolution (revisit time)
1/
14. Spatial Resolution
SPATIAL - THE PHYSICAL DIMENSION ON
EARTH IS RECORDED : SPATIAL
RESOLUTION
• Spatial resolution refers to the amount of detail that
can be detected by a sensor.
• Detailed mapping of land use practices requires a
much greater spatial resolution than observations of a
large scale storm system.
AWIFS (56 m)
18. Spectral Resolution
SPECTRAL- Relating of wavelength
characteristics of EMR measured
number of bands, bandwidth:
spectral resolution
•Describes the ability of a sensor to define fine
wavelengths intervals
•The finer the spectral resolution, narrower the
wavelength range of a particular band
Spectral Bands : LANDSAT TM
Band (.45 to .515μm) Band (.525 to .605 μm) Band (.63 to .690 μm)
Band (.75 to .90 μm) Band (1.55 to 1.75 μm) Band (2.09 to 2.35μm)
19. Colour Composite
True Color Composite (3,2,1) False Color Composite IR Colour Composite
(4,3,2) (7,5,4)
Radiometric Resolution
• Measure of capability of sensor to differentiate the
smallest change in spectral reflectance of a earth
feature.
High
D For same reflectance,
N High RR :DN = 4096(12)
slope Low RR DN = 64 (6 bit)
|
0
reflectance 1.0
20. Radiometric Resolution
Low Radiometric resolution High Radiometric resolution
Temporal Resolution
• High TR enhances utility of mission
• Key Factors deciding orbit repetivity
– Cross-track width of imaging strip
– Application demand
• Meteorological - hourly need to monitor clouds
• Oceanographic - 2-3 days of repetivity
• Stereo viewing - 0-1 days of repetivity
• Vegetation monitoring - 5 days of repetivity
21. INDIAN IMAGING CAPABILITY
•1 Km to 1 m spatial Resolution
•24 Days to every 30 mts. Repetitivity
•1 Million scale to Cadastral Level
IRS-1A/1B sensors
IRS-1A was launched in 1988 and provided data up to 1992
IRS-1B launched in 1991 and continues to provide good quality data till date
• LISS-I
– Operates in 4 bands in the visible and near infrared
regions
– Resolution 72 m
– Swath 148 km
• LISS-II
– Operates in same 4 bands as LISS-I
– Resolution 36.5 m
– Swath 74 km
22. IRS-1C/1D Mission
Sensors
• LISS-III
• PAN – Operates in 4 bands (3 in visible
and near infrared and 1 band in
– Operates in one visible
shortwave infrared)
band
– Resolution 23 m
– High resolution 5.8 m
– Swath 141 km
– Swath 70 km at nadir
– 90 km off nadir • WiFS
– Tilt capability +/- 26 – Operates in 2 bands in visible and
Degrees near infrared
– Resolution 188 m
– Swath 810 km
Indian Remote Sensing Satellite Resourcesat (IRS P6)
23. IRS Resourcesat (P6) Payloads
LISS-3: 141 km swath, 23.5 m resolution (all bands).
– B2: 0.52 - 0.59
– B3: 0.62 - 0.68
– B4: 0.76 – 0.86
– B5:1.55 – 1.70
LISS-4: 23.5 km (Mx mode) & 70.3 km (mono) swath, 5.8 m resolution
(all bands).
– B2: 0.52 - 0.59
– B3: 0.62 - 0.68
– B4: 0.76 – 0.86
AWiFS: 737 km combined swath, 56 m resolution at nadir, 70 m resolution
at field edges.
– B2: 0.52 - 0.59
– B3: 0.62 - 0.68
– B4: 0.76 – 0.86
– B5: 1.55 – 1.70
LISS-4 Sensor
– Sensor: 12 K CCD per band
– Spectral bands: 3 bands (0.52- 0.59, 0.62- 0.68 and 0.77- 0.86μ)
– Swath, MSS Mode: 23.9 km, selectable over 70 Km
– Swath, Pan Mode: 70 km in red band
– Ground Resolution: 5.8 meter pixel in all 3 bands
– Radiometric Resolution: 7 Bits selectable over 10bits
– Steering Capability: ± 26 degrees
– BBR: < 0.25 pixel
– Revisit Capability: 5 days
24. RESOURCESAT-1 LISS-IV MX IMAGE OF MUMBAI
Cartosat-1 PAN Sensor
Real time stereo viewing
SPATIAL RESOLUTION 2.5 m
Satellite Path
Two Pan cameras - fore with 26
deg. and
aft with -5 deg. Tilt( 500 nm- 850
Fore look Aft look nm)
Swath 27.5 km for stereo and 55
km for monoscopic mode.
8 km overlap between adjacent
paths
10 bits
Facility for across track tilt to give
better revisit
25. ON
- ORBIT CONFIGURATION OF CARTOSAT- 2SATELLITE
PAYLOAD : PAN : 0.8 M
SWATH : 9.6K M
SPACECRAFT WEIGHT: 680 KGS
ORBIT : 632 KM
REVISIT : 4/5 DAYS
EQUATORIAL CROSS
OVER TIME : 9:30 AM
LAUNCHED ON : 10TH JAN 2007
CARTOSAT PANCHROMATIC DATA (2.5 M)
IIRS
26. IRS P6 LISS IV(5.8m) MSS and CARTOSAT(2.5m) PAN FUSED
Cartosat 1 : Chandigarh
27. Hyderabad (Khairatabad and its environs), India as seen by CARTOSAT-2
Perth Airport, Australia as seen by CARTOSAT-2
28. IKONOS SATELLITE DETAILS
PAYLOAD :PAN : I M RESOLUTION
MS : 4 M, 4 BANDS
SWATH : 11 KMS
SPACECRAFT MASS : 720 KGS
ORBIT : 680 KM
REVISIT : EVERY 3 DAYS
EQUATORIAL CROSS
OVER TIME : 10:30AM
LAUNCH DATE : SEPTEMBER 1999
29. ORBVIEW 5 (GEOEYE 1
- - )
PAYLOAD : PAN & MS CAMERA
0.41 M PAN
1.64 M MS IN 4 BANDS
SWATH : 15.2 KM
DYNAMIC RANGE : 11 BITS
ORBIT : 684 KM
REVISIT : < 3 DAYS
EQUATORIAL CROSS
OVER TIME : 10:30 AM
LAUNCH DATE : 2007
Thermal Images
Day time
Night time
30. RADAR Images
ERS SAR image (pixel size=12.5 m)
Flat surfaces such as paved roads, runways or calm water
normally appear as dark areas in a radar image since most of the
incident radar pulses are specularly reflected away.
31. Microwave images
This SAR image shows an area of the sea near
a busy port. Many ships can be seen as bright
spots in this image due to corner reflection.
The sea is calm, and hence the ships can be
easily detected against the dark background