Hyundai Heavy Industries August 2013 investor presentation
MOL Q2 FY2012 results
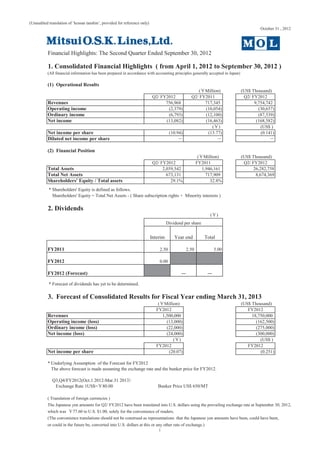
1. (Unaudited translation of ‘kessan tanshin’, provided for reference only)
October 31 , 2012
Financial Highlights: The Second Quarter Ended September 30, 2012
1. Consolidated Financial Highlights ( from April 1, 2012 to September 30, 2012 )
(All financial information has been prepared in accordance with accounting principles generally accepted in Japan)
(1) Operational Results
( Million) (US$ Thousand)
Q2/ FY2012 Q2/ FY2011 Q2/ FY2012
Revenues 756,968 717,345 9,754,742
Operating income (2,379) (10,054) (30,657)
Ordinary income (6,793) (12,100) (87,539)
Net income (13,082) (16,463) (168,582)
( ) (US$ )
Net income per share (10.94) (13.77) (0.141)
Diluted net income per share
(2) Financial Position
( Million) (US$ Thousand)
Q2/ FY2012 FY2011 Q2/ FY2012
Total Assets 2,039,542 1,946,161 26,282,758
Total Net Assets 673,131 717,909 8,674,369
Shareholders' Equity / Total assets 29.1% 32.8%
* Shareholders' Equity is defined as follows.
Shareholders' Equity = Total Net Assets - ( Share subscription rights + Minority interests )
2. Dividends
( )
Dividend per share
Interim Year end Total
FY2011 2.50 2.50 5.00
FY2012 0.00
FY2012 (Forecast)
* Forecast of dividends has yet to be determined.
3. Forecast of Consolidated Results for Fiscal Year ending March 31, 2013
( Million) (US$ Thousand)
FY2012 FY2012
Revenues 1,500,000 18,750,000
Operating income (loss) (13,000) (162,500)
Ordinary income (loss) (22,000) (275,000)
Net income (loss) (24,000) (300,000)
( ) (US$ )
FY2012 FY2012
Net income per share (20.07) (0.251)
* Underlying Assumption of the Forecast for FY2012
The above forecast is made assuming the exchange rate and the bunker price for FY2012.
Q3,Q4/FY2012(Oct.1 2012-Mar.31 2013
Exchange Rate 1US$= 80.00 Bunker Price US$ 650/MT
( Translation of foreign currencies )
The Japanese yen amounts for Q2/ FY2012 have been translated into U.S. dollars using the prevailing exchange rate at September 30, 2012,
which was 77.60 to U.S. $1.00, solely for the convenience of readers.
(The convenience translations should not be construed as representations that the Japanese yen amounts have been, could have been,
or could in the future be, converted into U.S. dollars at this or any other rate of exchange.)
1
2. (Unaudited translation of ‘kessan tanshin’, provided for reference only)
October 31, 2012
4. Business Performance
(Billions of Yen)
Six months Year-on-year
From Apr. 1 From Apr. 1 comparison
to Sep. 30, 2011 to Sep. 30, 2012 (variance)
Revenue 717.3 756.9 39.6/ 5.5%
Operating income (loss) (10.0) (2.3) 7.6/ %
Ordinary income (loss) (12.1) (6.7) 5.3/ %
Net income (loss) (16.4) (13.0) 3.3/ %
Exchange rate (six-month average) ¥80.26/US$ ¥80.19/US$ ¥ 0.07 /US$
Bunker price (six-month average) US$645/MT US$681/MT US$36/MT
During the first six months of the fiscal year (FY) 2012 (April 1, 2012 to September 30, 2012), concerns
about economic slowdown spread globally, leading to the implementation of further monetary easing
measures to stimulate the economies of many countries.
In Europe, insecurity in the financial system eased temporarily on the back of financial support measures
including the European Central Bank’s announcement of a policy of support buying government bonds and
the launch of the European Stability Mechanism. Nevertheless, capital investment and consumption
remained weak due to austere fiscal policies and high unemployment rates. Although the U.S. is for the
present experiencing continued moderate growth against a backdrop of recovery in the housing market,
favorable automobile sales and a decline in energy prices, a third round of quantitative easing (“QE3”) has
been announced in response to the slow pace of recovery in employment, which reflects concerns about the
direction of the economy. In China, although efforts were made to boost the economy with monetary easing
and the promotion of infrastructure investment, the pace of economic growth weakened because of
downward pressure on the domestic economy from a slump in overseas demand, particularly from Europe.
With respect to Japan, although domestic demand was firm primarily on the back of automobile sales and
earthquake-related restoration demand, the pace of economic recovery remained slow because of weak
overseas demand, particularly from China.
Looking at the maritime shipping market conditions, in the dry bulker market, deliveries of new vessels
remained at a record high, preventing further improvements in the balance of supply and demand, and the
markets for Capesize and Panamax bulkers in particular remained at rock bottom levels. Despite performing
firmly at the start of the period, the crude oil tanker (VLCC) market stagnated due to the combined effects
of summer season, during which demand drops off, and weaker cargo volume due to slower economic
growth in China. As for containerships, efforts were made to increase operation efficiency by such means as
reorganizing global alliances and enhancing super-slow steaming. As a result, the supply and demand
environment improved and progress was made in the restoration of freight rates. Even so, in addition to
stagnation in Europe and slower growth in China partly caused by the situation in Europe, there was a
slowdown in cargo volumes to European routes, and freight rate levels weakened.
The average exchange rate against the U.S. dollar during the first six months appreciated by ¥0.07 year on
year to ¥80.19. Furthermore, the average bunker price during the first six months rose by US$36/MT to
US$681/MT, which negatively impacted our profits.
As a result of the above, we recorded revenue for the first six months of ¥756.9 billion, operating loss of
¥2.3 billion and ordinary loss of ¥6.7 billion. Net loss was ¥13.0 billion, partly due to a ¥7.4 billion loss on
valuation of investment securities caused by the decline in stock market prices.
The following is a summary of business conditions including revenue and ordinary income/loss per
business segment.
2
3. (Unaudited translation of ‘kessan tanshin’, provided for reference only)
October 31, 2012
Upper: Revenue, Lower: Segment Income (Loss) (Ordinary Income (Loss)) (Billions of Yen)
Six months Year-on-year
From Apr. 1 From Apr. 1 comparison
to Sep. 30, 2011 to Sep. 30, 2012 (variance)
Bulkships 353.9 369.8 15.9 / 4.5%
(6.1) (10.9) 4.7 / %
Containerships 282.7 303.7 20.9 / 7.4%
(10.5) (2.6) 7.8 / %
Ferry and Domestic Transport 25.2 27.4 2.2 / 8.9%
(1.2) 0.7 1.9 / %
Associated Businesses 61.6 62.8 1.1 / 1.9%
4.7 5.7 1.0 / 21.8%
Others 8.0 7.5 0.5 / 6.3 %
1.0 0.9 0.0 / 8.7 %
(Note) Revenue includes internal sales or transfers among segments.
(A) Bulkships
<Dry Bulkers>
In the dry bulker segment, deliveries of new vessels remained at a record high. Consequently, there were no
further improvements in the balance of supply and demand, despite an increase in the shipping tonnage of
vessels scrapped, and the market stagnated as a result. The Capesize bulker market remained at bottom
levels, partly because of reduced crude steel production in European regions and peaking crude steel
production in China. The Panamax market experienced similar stagnation. This was primarily the result of
downwards pressure from the stagnating Capesize bulker market, weak cargo volume to Asia, and a steep
increase in shipping tonnage due to the large number of new vessel deliveries. As a consequence, average
Panamax hire rates for four main routes, which are released by The Baltic Exchange, reached their lowest
point to date in late September.
Under such environment, in the dry bulker segment, we secured stable profits through long-term contracts
for carriers of iron ore, woodchips, steaming coal, etc., and continued to cut costs through efficient vessel
operations and cold lay-ups of Capesize bulkers. We also proactively scrapped Capesize bulkers and
woodchip carriers, worked to renew our fleet and improve its quality, and strove to provide high-quality
transportation services. Despite these efforts, a loss was recorded in this segment for the first six months.
<Tankers/LNG Carriers>
Regarding the tanker segment, the crude oil tanker (VLCC) market struggled following a seasonal drop off
in demand in line with oil refineries in multiple Asian countries undergoing periodic maintenance, despite
its firm performance at the start of the period. In addition, cargo volume was weak, partly because of a
perceived excessive inventory of oil products resulting from slower economic growth in China. This
resulted in a renewed awareness of supply pressure from newly delivered vessels, leading to market
stagnation.
In the product tanker market, the fundamental balance of supply and demand trended towards improvement;
operations in some waters, like in the Far East, showed signs of continued strength temporarily. Even so, the
perception of an oversupply of vessels lingered due to weakness in cargo volume caused by economic
malaise in Europe and stagnation in arbitrage-trading. As a result, the market stood still.
Although we responded to this situation by such means as reducing fuel costs by further enhancing slow
steaming and improving operation efficiency by setting up pools with other operators, a loss was recorded
in the tanker segment for the first six months.
The LNG carrier segment performed firmly owing to the limited number of deliveries of newly built LNG
carriers and stable LNG demand in Japan and other areas of Asia. Ordinary income for the first six months
increased year on year as stable revenue was secured from long-term transport contracts.
3
4. (Unaudited translation of ‘kessan tanshin’, provided for reference only)
October 31, 2012
<Car Carriers>
In the car carrier segment, despite firm exports of completed cars from Japan to the U.S. and Australia,
shipments to Europe failed to reach a full-fledged recovery, primarily due to the impact of economic
stagnation in Europe. On the other hand, strengthened cross trade and the firm performance of Asia-bound
transport from Europe contributed to a significant improvement in ordinary income/loss compared with the
same period of the previous fiscal year when the impact of the Great East Japan Earthquake existed.
(B) Containerships
Regarding containerships, we worked to expand alliances and rationalize our services, while the supply and
demand environment gradually improved from the beginning of spring and progress was made in restoring
freight rates. In addition, we continued to enhance super-slow steaming and made strong efforts to promote
cost cutting. Regarding Asia-Europe routes, however, growth in cargo volume was restrained and freight
rate levels became weak in the summer demand season and after. As a result, although year-on-year
improvement was achieved, a loss was recorded for the first six months.
(C) Ferry and Domestic Transport
The ferry business showed a large improvement in ordinary income/loss. This was the result of the return to
normal operations of the Oarai Ferry Terminal in Ibaraki Prefecture on the Hokkaido route in the current
fiscal year. The terminal was damaged in the Great East Japan Earthquake, making it unusable until early
June in the previous fiscal year. The domestic transport business secured ordinary income/loss in excess of
the same period of the previous fiscal year because the energy transportation-related field continued to yield
strong results. Overall, the ferry and domestic transport segment achieved considerable year-on-year
improvement in ordinary income/loss.
(D) Associated Businesses
In the real estate business, while the rental office market failed to reach a full-fledged recovery, Daibiru
Corporation, the core company in the MOL Group’s real estate business, maintained high occupancy rates,
allowing us to sustain a stable performance. In the cruise ship business, although sales efforts began to have
an effect, we were unable to secure our target number of passengers. Consequently, despite achieving
year-on-year improvement, a loss was recorded. Apart from the cruise ship business, results from other
associated businesses were firm overall. As a result, ordinary income in the associated businesses segment
increased year on year.
(E) Others
Other businesses, which are mainly cost centers, include ship operations, ship management, financing, and
shipbuilding. Ordinary income in this segment decreased year on year.
5. Financial Position
Consolidated assets as of September 30, 2012, were 2,039.5 billion yen, an increase of 93.3 billion yen from
the end of the previous fiscal year.
This mainly reflects an increase in vessels due to delivery of newly completed vessels as well as an increase
in other current assets due to an increase in short-term loans receivable including repurchase agreement,
although investment securities decreased.
Consolidated liabilities as of September 30, 2012, were 1,366.4 billion yen, an increase of 138.1 billion yen
from the end of the previous fiscal year. This was mainly due to an increase in bonds and long-term bank
loans for acquisition of newly completed vessels.
Consolidated net assets as of September 30, 2012, were 673.1 billion yen, a decrease of 44.7 billion yen
from the end of the previous fiscal year. This was mainly due to a decrease in retained earnings and
unrealized holding gains on available-for-sale securities and an increase in unrealized losses on hedging
derivatives.
As a result, shareholder’s equity ratio was 29.1%, down 3.7% from the end of the previous fiscal year.
4
5. (Unaudited translation of ‘kessan tanshin’, provided for reference only)
October 31, 2012
6. Outlook for FY2012
For FY2012 (Billions of Yen)
Previous outlook Latest outlook
Comparison (variance)
(When announced 1Q) (When announced 2Q)
Revenue 1,550.0 1,500.0 50.0 /(3.2) %
Operating income (loss) 16.0 (13.0) 29.0 / %
Ordinary income (loss) 10.0 (22.0) 32.0 / %
Net income (loss) 3.0 (24.0) (27.0) / %
Exchange rate ¥80.00/US$ ¥80.00/US$ ¥0.00/US$
Bunker price US$630/MT US$650/MT US$20/MT
(Assumption for 3/4Q) (Assumption for 3/4Q)
For the third quarter and beyond, we project that the business environment will continue to be difficult,
characterized by the yen remaining strong and bunker prices remaining at high levels in the long term,
pressure from large numbers of new vessel deliveries and a slow recovery of European economies.
However, firm cargo volumes of iron ore and coal are expected in the dry bulker segment, while market
conditions for the tanker segment are expected to improve toward the winter demand period. In addition, we
will continue pushing ahead with rationalization efforts in the containership business, including reducing
the frequency of services, as well as reorganizing and/or expanding shipping routes. Through these efforts,
we will work to maintain and improve the supply and demand environment and to improve our results for
FY2012.
In consideration of these prospects, we project for FY2012 consolidated revenue of ¥1,500.0 billion,
consolidated operating loss of ¥13.0 billion, consolidated ordinary loss of ¥22.0 billion, and consolidated
net loss of ¥24.0 billion.
Considering consolidated ordinary loss of ¥6.7 billion for the first six months of FY2012, we have decided
not to pay an interim dividend for this fiscal year. In consideration of continuing uncertainty in the business
environment surrounding the Company, we have not yet made a decision on our year-end dividend for
FY2012 at this stage.
As to the outlook changes from the release on July 31,2012.,please look at “Announcement of Differences
between the Financial Outlook and Financial Results for 1st half of FY2012 and Revision of FY2012
Outlook”.
5
6. (Unaudited translation of ‘kessan tanshin’, provided for reference only)
October 31, 2012
7. Consolidated Financial Statements
(All financial information has been prepared in accordance with accounting principles generally accepted in Japan)
(1) Consolidated Balance Sheets
( Million)
As of March 31, 2012 As of September 30, 2012
Assets
Current assets
Cash and deposits 50,864 52,510
Trade receivables 130,921 143,091
Marketable securities 10,023 34,025
Inventories 54,335 52,584
Deferred and prepaid expenses 53,744 52,448
Deferred tax assets 4,594 4,940
Other current assets 82,852 126,106
Allowance for doubtful accounts (401) (501)
Total Current Assets 386,936 465,206
Fixed assets
Tangible fixed assets
Vessels 822,280 856,736
Buildings and structures 124,294 121,788
Equipments,mainly containers 9,210 8,780
Equipments and parts 3,597 3,926
Land 215,958 216,580
Vessels and other property under construction 116,724 108,564
Other tangible fixed assets 1,735 2,291
Total tangible fixed assets 1,293,802 1,318,668
Intangible fixed assets 16,193 20,295
Investments and other assets
Investment securities 172,746 148,100
Long-term loans receivable 19,166 21,708
Prepaid expenses 20,479 20,346
Deferred tax assets 11,692 22,275
Other long-term assets 27,696 25,229
Allowance for doubtful accounts (2,551) (2,288)
Total investments and other assets 249,228 235,371
Total fixed assets 1,559,225 1,574,335
Total assets 1,946,161 2,039,542
6
7. (Unaudited translation of ‘kessan tanshin’, provided for reference only)
October 31, 2012
( Million)
As of March 31, 2012 As of September 30, 2012
Liabilities
Current liabilities
Trade payables 133,599 137,931
Short-term bonds 4,190 5,652
Short-term bank loans 101,012 115,816
Accrued income taxes 6,112 5,583
Advances received 19,808 19,351
Deferred tax liabilities 902 907
Allowance for provision for bonuses 3,928 3,493
Allowance for provision for directors' bonuses 152 33
Allowance for provision for loss related to U.S. antitrust matter 151 142
Commercial paper 5,000 3,500
Other current liabilities 47,993 49,486
Total Current Liabilities 322,851 341,898
Fixed liabilities
Bonds 187,030 226,410
Long-term bank loans 552,156 608,750
Lease obligations 19,011 19,315
Deferred tax liabilities 18,732 18,196
Allowance for employees' severance and retirement benefits 13,766 13,531
Allowance for directors' and corporate auditors' retirement benefits 2,159 1,706
Allowance for provision for special repairs 14,058 14,111
Other fixed liabilities 98,484 122,488
Total Fixed Liabilities 905,401 1,024,511
Total Liabilities 1,228,252 1,366,410
Net Assets
Owners' equity
Common stock 65,400 65,400
Capital surplus 44,486 44,496
Retained earnings 629,667 613,592
Treasury stock, at cost (7,151) (7,006)
Total owners' equity 732,402 716,483
Accumulated gains (losses) from valuation and translation adjustments
Unrealized holding gains on available for-sale-securities, net of tax 16,888 9,419
Unrealized gains (losses) on hedging derivatives, net of tax (54,936) (76,470)
Foreign currency translation adjustments (56,932) (56,235)
Total accumulated losses from valuation and translation adjustments (94,980) (123,286)
Share subscription rights 2,005 2,115
Minority interests 78,481 77,820
Total Net Assets 717,909 673,131
Total Liabilities and Total Net Assets 1,946,161 2,039,542
7
8. (Unaudited translation of ‘kessan tanshin’, provided for reference only)
October 31, 2012
(2) Consolidated Statements of Income
( Million)
Q2 / FY2011 Q2 / FY2012
(Apr.1 - Sep.30, 2011) (Apr.1 - Sep.30, 2012)
Shipping and other operating revenues 717,345 756,968
Shipping and other operating expenses 680,474 716,043
Gross operating income 36,871 40,924
Selling, general and administrative expenses 46,926 43,303
Operating income (loss) (10,054) (2,379)
Non-operating income:
Interest income 721 521
Dividend income 1,782 1,916
Equity in earnings of unconsolidated subsidiaries and affiliated 1,545
Gain on sale of containers 1,159 2,239
Others 1,949 1,624
Total 7,158 6,302
Non-operating expenses:
Interest expense 5,567 6,123
Equity in losses of unconsolidated subsidiaries and affiliated companies 2,243
Exchange loss 1,949 1,247
Loss on valuation of derivatives 1,036 445
Others 651 655
Total 9,204 10,716
Ordinary income (loss) (12,100) (6,793)
Extraordinary profit:
Gain on sale of fixed assets 3,944 5,446
Cancellation fee for chartered ships 62 1,514
Others 1,803 1,317
Total 5,810 8,277
Extraordinary loss:
Loss on sale of fixed assets 569 2,739
Loss on retirement of fixed assets 1,017 535
Loss on valuation of investment securities 8,139 7,452
Others 1,567 857
Total 11,293 11,585
Income (loss) before income taxes and minority interests (17,583) (10,100)
Income taxes-current
Income taxes-deferred
Income taxes (2,606) 977
Income (loss) before minority interests (14,977) (11,078)
Minority interests in earnings of consolidated subsidiaries 1,486 2,004
Net income (loss) (16,463) (13,082)
8
9. (Unaudited translation of ‘kessan tanshin’, provided for reference only)
October 31, 2012
(3) Consolidated Statements of Comprehensive Income
( Million)
Q2 / FY2011 Q2 / FY2012
(Apr.1 - Sep.30, 2011) (Apr.1 - Sep.30, 2012)
Income (Loss) before minority interests (14,977) (11,078)
Other comprehensive income
Unrealized holding gains (losses) on available-for-sale securities, net of tax (6,884) (7,227)
Unrealized gains (losses) on hedging derivatives, net of tax (13,096) (20,082)
Foreign currency translation adjustments 1,994 1,427
Share of other comprehensive income of associates accounted for using equity method (1,471) (3,000)
Total (19,457) (28,883)
Comprehensive income (34,435) (39,961)
(Breakdown)
Comprehensive income attributable to owners of the parent (35,323) (41,389)
Comprehensive income attributable to minority interests 887 1,427
9
10. (Unaudited translation of ‘kessan tanshin’, provided for reference only)
October 31, 2012
(4) Consolidated Statements of Cash Flows
( Million)
Q2 / FY2011 Q2 / FY2012
(Apr.1 - Sep.30, 2011) (Apr.1 - Sep.30, 2012)
Cash flows from operating activities:
Income (loss) before income taxes and minority interests (17,583) (10,100)
Depreciation and amortization 41,690 45,201
Equity in (earnings) losses of affiliates (1,545) 2,243
Loss on valuation of investment securities 8,139 7,452
Various provisions (reversals) (4,065) (1,208)
Interest and dividend income (2,504) (2,438)
Interest expense 5,567 6,123
Loss (gain) on the sale of investment securities (224) 160
Loss (gain) on sale and retirement of vessels, property, plant and equipme (2,357) (2,171)
Exchange (earning) loss,net 1,233 2,375
Changes in operating assets and liabilities
Trade receivables 394 (11,985)
Inventories (3,099) 1,820
Trade payables (7,458) 4,209
Other,net (3,549) (4,886)
Sub total 14,636 36,796
Cash received from interest and dividend 5,690 5,188
Cash paid for interest (5,365) (6,584)
Cash (paid) refund for corporate income tax, resident tax and enterprise ta (29,118) 5,081
Net cash provided by (used in) operating activities (14,156) 40,481
Cash flows from investing activities:
Purchase of investment securities (859) (898)
Proceeds from sale and redemption of investment securities 604 292
Payments for purchases of vessels and other tangible / intangible fixed ass (89,523) (99,071)
Proceeds from sale of vessels and other tangible / intangible fixed assets 24,035 31,885
Net (increase) decrease in short-term loans receivable 326 470
Disbursements for loans receivable (921) (4,153)
Collections of loans receivable 7,004 734
Other, net (1,236) 704
Net cash provided by (used in) investing activities (60,570) (70,035)
Cash flows from financing activities:
Net increase (decrease) in short-term bonds (87)
Net increase (decrease) in short-term bank loans (5,011) (8,708)
Net increase (decrease) in commercial paper (16,000) (1,500)
Proceeds from long-term bank loans 133,154 120,106
Repayments of long-term bank loans (38,575) (42,478)
Proceeds from issuance of bonds 30,000 45,000
Redemption of bonds (5,057) (4,313)
Purchase of treasury stock (18) (6)
Sale of treasury stock 18 15
Cash dividends paid by the company (6,013) (3,040)
Cash dividends paid to minority interests (380) (2,082)
Other, net (402) (722)
Net cash provided by (used in) financing activities 91,625 102,268
Effect of exchange rate changes on cash and cash equivalents (501) 1
Net increase (decrease) in cash and cash equivalents 16,397 72,716
Cash and cash equivalents at beginning of the year 65,477 82,837
Cash and cash equivalents at end of Q2 of the year 81,874 155,553
10
11. (Unaudited translation of ‘kessan tanshin’, provided for reference only)
October 31, 2012
(5) Segment Information
Business segment information:
( Million)
Segment report
Adjust- Consoli-
Q2 / FY2011 Ferry & Others
Bulk- Container Associated Total ment dated
(Apr.1 - Sep.30, 2011) Domestic Sub Total *1
ships - ships Businesses *2 *5
Transport
Revenues
1.Revenues from
customers,
unconsolidated 353,411 281,853 25,123 52,881 713,269 4,076 717,345 - 717,345
subsidiaries and
affiliated companies
2.Inter-segments
505 936 108 8,796 10,347 3,965 14,313 (14,313) -
revenues
Total Revenues 353,916 282,789 25,232 61,677 723,616 8,042 731,658 (14,313) 717,345
Segment income(loss) (6,185) (10,529) (1,206) 4,715 (13,205) 1,040 (12,164) 64 (12,100)
( Million)
Segment report
Adjust- Consoli-
Q2 / FY2012 Ferry & Others
Bulk- Container Associated Total ment dated
(Apr.1 - Sep.30, 2012) Domestic Sub Total *1
ships - ships Businesses *3 *5
Transport
Revenues
1.Revenues from
customers,
unconsolidated 369,286 302,915 27,363 53,919 753,484 3,483 756,968 - 756,968
subsidiaries and
affiliated companies
2.Inter-segments
606 871 107 8,920 10,505 4,049 14,554 (14,554) -
revenues
Total Revenues 369,893 303,786 27,470 62,839 763,990 7,532 771,522 (14,554) 756,968
Segment income (loss) (10,904) (2,642) 732 5,743 (7,071) 950 (6,120) (672) (6,793)
* 1. "Others" consist of the businesses which are not included in "segment report", such as vessels' operation, vessels' management,
vessels' chartering business, financial business and shipbuilding business.
* 2. The adjustment of segment income (64 million yen) include the following element:-318 million yen of corporate profit
which is unable to be distributed to each segment, 836 million yen of adjustment for management accounting,
-454 million yen of intersegment transaction elimination.
* 3. The adjustment of segment loss (-672 million yen) include the following element:-3,056 million yen of corporate loss
which is unable to be distributed to each segment, 2,337 million yen of adjustment for management accounting,
46 million yen of intersegment transaction elimination.
* 4. The method of allocating general and administrative expenses was changed from the first quarter of FY2012 to reflect global
expansion of our business locations on segment information appropriately. In case of calculating allocation of general and
administrative expenses of the second quarter of FY2011 by the modified method, segment loss would be decreased by 1,153
million yen in "Bulk-ships", 348 million yen in "Container-ships", 38 million yen in "Ferry & Domestic Transport".
And segment income would be increased by 43 million yen in "Associated Business" and decreased by 16 million yen
in "Others", 1,567 million yen in "Adjustment".
* 5. The segment income (loss) is the ordinary income (loss), and the consolidated statements of income mentions the total figure
after the adjustment.
11
12. (Unaudited translation of 'kessan tanshin', provided for reference only)
October 31, 2012
Supplement
1. Review of Quarterly Results
FY2012
1st Quarter 2nd Quarter 3rd Quarter 4th Quarter
Apr. Jun.,2012 Jul. Sep.,2012 Oct. Dec.,2012 Jan. Mar.,2013
Revenues [ Million] 378,850 378,118
Operating Income (loss) (503) (1,876)
Ordinary income (loss) (1,538) (5,255)
Income (loss) before income taxes (5,811) (4,289)
Net income (loss) (5,020) (8,062)
Net income ( loss) per share [ ] (4.20) (6.74)
Total assets [ Million] 1,988,564 2,039,542
Total net assets 698,541 673,131
FY2011
1st Quarter 2nd Quarter 3rd Quarter 4th Quarter
Apr. Jun.,2011 Jul. Sep.,2011 Oct. Dec.,2011 Jan. Mar.,2012
Revenues [ Million] 349,113 368,232 356,326 361,549
Operating Income (loss) (8,643) (1,411) (8,321) (6,084)
Ordinary income (loss) (8,356) (3,744) (6,569) (5,651)
Income (loss) before income taxes (5,643) (11,940) (12,416) (3,517)
Net income (loss) (8,047) (8,416) (8,678) (868)
Net income (loss) per share [ ] (6.73) (7.04) (7.26) (0.73)
Total assets [ Million] 1,897,714 1,911,808 1,890,477 1,946,161
Total net assets 719,521 697,365 674,922 717,909
12
13. (Unaudited translation of 'kessan tanshin', provided for reference only)
October 31,2012
2. Depreciation and Amortization
(Million yen)
Six months ended Six months ended
Sep. 30,2011 Sep. 30,2012
Increase /Decrease FY2011
Vessels 33,962 37,703 3,741 70,149
Others 7,728 7,497 (231) 15,475
Total 41,690 45,201 3,511 85,624
3. Interest-bearing Debt
(Million yen)
As of Mar. 31,2012 As of Sep.30,2012 Increase /Decrease As of Sep. 30, 2011
Bank loans 653,168 724,566 71,398 598,644
Bonds 191,221 232,063 40,842 195,322
Commercial paper 5,000 3,500 (1,500) 5,500
Others 20,229 20,430 201 20,648
Total 869,619 980,560 110,941 820,116
4. Fleet Capacity
(MOL and consolidated subsidiaries)
Dry bulkers Tankers LNG carriers Car carriers Containerships
No.of ships 1,000MT No.of ships 1,000MT No.of ships 1,000MT No.of ships 1,000MT No.of ships 1,000MT
Owned 84 6,696 84 13,034 27 1,883 54 868 23 1,507
Chartered 330 29,040 112 5,217 - - 77 1,219 93 4,850
Others - - - - 2 143 - - - -
As of Sep.30,2012 414 35,736 196 18,251 29 2,026 131 2,087 116 6,357
As of Mar.31,2012 392 34,911 195 17,718 31 2,172 128 2,055 115 6,205
Ferries/Domestic
Passenger ships Others Total
carriers(*1)
No.of ships 1,000MT No.of ships 1,000MT No.of ships 1,000MT No.of ships 1,000MT
Owned 15 79 1 5 1 6 289 24,077
Chartered 29 81 - - 2 13 643 40,421
Others 2 1 - - - - 4 145
As of Sep.30,2012 46 162 1 5 3 19 936 64,643
As of Mar.31,2012 45 158 1 5 3 19 910 63,242
*1:excluding tug boats
5. Exchange Rates
Six months ended Six months ended
Sep. 30,2011 Sep. 30,2012
Change FY2011
Average rates ¥80.26 ¥80.19 ¥0.07 (0.1%) appreciated ¥78.85
Term-end rates ¥76.65 ¥77.60 ¥0.95 (1.2%) weaken ¥82.19
(Remark) "Average rates" are average of monthly corporate rates in each term, while "term-end rates" are TTM rates on the last day of each term.
Overseas subsidiaries
TTM on TTM on TTM on
Change Dec. 31, 2011
Jun. 30, 2011 Jun. 30, 2012
Term-end rates ¥80.73 ¥79.31 ¥1.42 (1.8%) appreciated ¥77.74
6. Bunker Prices
Six months ended Six months ended
Sep. 30,2011 Sep. 30,2012
Increase /Decrease
Consumption Prices US$645/MT US$681/MT US$36/MT
13
14. (Unaudited translation of 'kessan tanshin', provided for reference only)
October 31, 2012
7 Market Information
(1) Containership Market (China Containerized Freight Index) Source : Shanghai Shipping Exchange
CCFI W/C America Service CCFI E/C America Service CCFI Europe Service
2,100
1,900
1,700
1,500
1,300
1,100
900
700
1998.1.1 1,000
500
Aug
Aug
Aug
Aug
Aug
Apr
Apr
Apr
Apr
Apr
May
Jun
Jul
Oct
Nov
May
Jun
Jul
Oct
Nov
May
Jun
Jul
Oct
Nov
May
Jun
Jul
Oct
Nov
May
Jun
Jul
Mar
Mar
Mar
Mar
Mar
Dec
Dec
Dec
Dec
Jan
Feb
Sep
Jan
Feb
Sep
Jan
Feb
Sep
Jan
Feb
Sep
Jan
Feb
Sep
2008 2009 2010 2011 2012
* CCFI reflects the freight rate trend for container exports from China only, which does not always match the overall trend for container exports from Asia.
Therefore, this information is provided and updated only for reference purposes.
(2) Dry Bulk Market (Baltic Dry Index) Source : Tramp Data Service
BDI (Baltic Dry Index)
12,000
10,844
10,000
BDI :January 1985 = 1,000
8,000
6,000
4,000
2,000
743 707
0
Jan-01 Jan-02 Jan-03 Jan-04 Jan-05 Jan-06 Jan-07 Jan-08 Jan-09 Jan-10 Jan-11 Jan-12
(Calender Year)
2000 2001 2002 2003 2004 2005 2006 2007 2008 2009 2010 2011 2012
Maximum 1,734 1,566 1,666 4,609 5,519 4,678 4,336 10,543 10,830 3,941 3,838 2,072 1,170
Minimum 1,371 855 931 1,674 2,902 2,207 2,262 4,398 743 905 1,910 1,181 703
Average 1,606 1,215 1,144 2,634 4,521 3,380 3,188 7,090 6,346 2,613 2,761 1,548 917
(Jan. Sep.)
(3) VLCC Market Source : Drewry, RIM etc.
WS VLCC spot rate(AG/East)
350
317
300
234
250
200
150
100
50
29 27 37
0
Jan-01 Jan-02 Jan-03 Jan-04 Jan-05 Jan-06 Jan-07 Jan-08 Jan-09 Jan-10 Jan-11 Jan-12
(Calender Year)
2000 2001 2002 2003 2004 2005 2006 2007 2008 2009 2010 2011 2012
Maximum 168 108 112 149 317 190 120 234 216 54 97 63 65
Minimum 55 35 29 49 89 57 57 54 59 27 47 47 36
Average 110 66 50 93 149 101 90 79 120 40 69 52 52
(Jan. Aug.)
14