
Recomendados
Recomendados
Mais conteúdo relacionado
Destaque
Destaque (20)
Semelhante a Tsh scorecard corporate - 2010 11 q3 d
Semelhante a Tsh scorecard corporate - 2010 11 q3 d (15)
Mais de The Scarborough Hospital
Mais de The Scarborough Hospital (20)
Último
Último (20)
Tsh scorecard corporate - 2010 11 q3 d
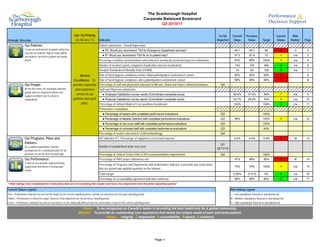
- 1. The Scarborough Hospital Corporate Balanced Scorecard Q3 2010/11 Our 1st Priority 1st Qtr Current Previous Current Risk Strategic Direction (to 30-Jun-11) Indicator Reported Value Value Target Status Rating* Page Our Patients: Patient satisfaction - Overall Impression: Create an environment of patient safety that ● ED: Would you recommend TSH for Emergency Department services? 49.1 49.7 50 R H 2 exceeds our patients' highest expectations and delivers care that is patient and family ● IP: Would you recommend TSH for an In-patient stay? 67.2 61.9 73 Y n/a 2 driven. Percentage of publicly reported patient safety indicators meeting the provincial target (see addendum) 63% 58% 100% Y n/a 4 Number of incident reports completed (medication and non-medication) 743 730 490 G n/a 6 Hospital Standardized Mortality Ratio (HSMR) 74 84 100 G n/a 7 Service Rate of hand hygiene compliance before initial patient/patient environment contact 85% 92% 90% R 8 Excellence: To Rate of hand hygiene compliance after patient/patient environment contact 89% 96% 90% R 8 Our People: provide respectful Percentage of staff and physicians educated in Mission, Vision and Values defined behaviours Q4 Be the first choice for motivated, talented and responsive Staff and Physician satisfaction: people who are inspired to deliver and support excellent care in a diverse service to our ● Employee Satisfaction survey results (Commitment composite score) 50.9% 37.5% 59% Y n/a 9 environment. patients and each ● Physician Satisfaction survey results (Commitment composite score) 42.7% 28.8% 43% Y n/a 10 other. Percentage of defined Model of Care positions transitioned 100% 100% G n/a 11 Performance evaluations ● Percentage of leaders with completed performance evaluations Q3 100% ● Percentage of Medical Directors with completed performance evaluations Q3 80% 100% Y n/a 12 ● Percentage of non-union staff with completed performance evaluations Q3 100% ● Percentage of unionized staff with completed performance evaluations Q3 50% Percentage of leaders educated in LEAN methodology Q4 Our Programs, Plans and HIT indicator #17, Percentage of equipment cost to total expense 5.2% 5.4% 5.9% R M 13 Partners: Q1 As a unified organization, lead the Number of standardized order sets used 2011/12 development of a coordinated plan for the provision of care for all of Scarborough. Percentage of Clinical Service Plan (CSP) recommendations implemented Q4 100% Our Performance: Percentage of PMO project milestones met 47% 96% 80% R M 14 Create an accountable, high performing Percentage of Programs and Departments with performance indicator scorecards and action plans organization that delivers measureable 75% 75% 100% Y n/a 15 results. that are posted and updated quarterly on the Intranet Total margin 0.30% -0.31% 0% G n/a 16 Percentage of accountability agreement indicators achieved 88% 88% 80% G n/a 17 * Risk rating only completed for indicators that are not meeting the target and have not improved over the prior reporting period Current Status Legend: Risk Rating Legend Red = Performance indicator has not met the target for the current reporting period, and has not improved over the prior reporting period L = Low reputational, financial or operational risk Yellow = Performance is below the target, however it has improved over the previous reporting period M = Medium reputational, financial or operational risk Green = Performance indicator has met or exceeded or is not statistically different than the performance target for the current reporting period H = High reputational, financial or operational risk Vision: To be recognized as Canada’s leader in providing the best healthcare for a global community. Mission: To provide an outstanding care experience that meets the unique needs of each and every patient. Values: I ntegrity, C ompassion, A ccountability, R espect, E xcellence Page 1
- 2. The Scarborough Hospital Corporate Balanced Scorecard Publicly Reported Patient Safety Indicators Current Previous Current Strategic Direction Indicator Value Value Target Status Risk Rating* Page Our Patients: Emergency Department Wait Time for High Acuity Visits - General Campus 19:35 15:12 8:00 R H A1 Emergency Department Wait Time for High Acuity Visits - Birchmount Campus 22:51 12:12 8:00 R H A2 Emergency Department Wait Time for Low Acuity Visits - General Campus 5:31 4:48 4:00 R H A3 Emergency Department Wait Time for Low Acuity Visits - Birchmount Campus 4:57 4:30 4:00 R H A4 Percent of CTAS 1&2 meeting 8 hour target 66% 71% 90% R H A5 Percent of CTAS 3 meeting 6 hour target 66% 73% 90% R H A6 Percent of CTAS 4&5 meeting 4 hour target 79% 84% 90% R H A7 Rate of Hospital Acquired C. difficile Associated Diarrhea 0.32 0.22 0.28 R M A8 Rate of Hospital Acquired Methicillin Resistant Staphylococcus Aureus (MRSA) Bacteraemia 0.00 0.00 0.02 G n/a A9 Rate of Hospital Acquired Vancomycin Resistant Enterococcus (VRE) Bacteraemia 0.00 0.00 0.00 G n/a A10 Rate of Central Line Infection (CLI) 1.48 0.61 0.75 R A11 Rate of Ventilator Associated Pneumonia (VAP) 0.00 0.76 1.46 G n/a A12 Rate of Timely Administration of Prophylactic Antibiotics - Primary Hip & Knee 98.0% 97.6% 96.1% G n/a A13 Wait Time - General Surgery 82 67 182 G n/a A14 Wait Time - Cancer Surgery 65 54 84 G n/a A15 Wait Time - Cataract Surgery 123 223 182 G n/a A16 Wait Time - Total Hip Replacement 123 151 182 G n/a A17 Wait time - Total Knee Replacement 106 153 182 G n/a A18 Wait Time - CT 20 23 28 G n/a A19 Wait Time - MRI 99 116 28 Y M A20 * Risk rating only completed for indicators that are not meeting the target and have not improved over the prior reporting period Status Legend: Risk Rating Legend Red = Performance indicator has not met the target for the current reporting period, and has not improved over the prior reporting period L = Low reputational, financial or operational risk Yellow = Performance is below the target, however it has improved over the previous reporting period M = Medium reputational, financial or operational risk Green = Performance indicator has met or exceeded or is not statistically different than the performance target for the current reporting period H = High reputational, financial or operational risk Vision: To be recognized as Canada s leader in providing the best healthcare for a global community. Mission: To provide an outstanding care experience that meets the unique needs of each and every patient. Values: I ntegrity, C ompassion, A ccountability, R espect, E xcellence Page Addendum
- 3. The Scarborough Hospital Corporate Balanced Scorecard Publicly Reported Patient Safety Indicators Indicator Emergency Department Wait Time for High Acuity Visits - General Campus Strategic Direction Our Patients Time Frame Q4 2010/11 (Jan) Source MOHLTC Wait Times Website / NACRS Performance Measurement Summary Definition 19:35, n=3518 16:47, n=8517 This indicator reports the 90th Percentile Wait time for all ED Admits with CTAS 1-5 22:00 15:54, n=8051 15:48, n=8883 15:12, n=10727 15:32, n=8512 15:31, n=7938 and NonAdmits with CTAS 1-3. 20:00 13:12, n=9747 18:00 Significance 16:00 This indicator is associated with efficiency within the ED and within the hospital, as well as with ED patient satisfaction. 14:00 12:00 Target 10:00 MOHLTC Target - 8:00, lower value is desired. 8:00 CHART PLACEHOLDER Risk Rating 6:00 High - There will be reputational impact of dissatisfied patients waiting in Emergency Department and potential financial risk of losing Pay-for-Results funding. 4:00 Analysis 2:00 There are challenges related to discharge processes, bed turnover times, and bed availability. As a result of ED PIP, white boards, discharge huddles, patient 0:00 education and discharge processes have improved on participating units. Spreading the concept to other units is underway. Changing the philosophy to shared accountability for patients is spreading. General Campus Target Action Plan Initiative Lead Date Initiated Status ED PIP initiated J. Phan Sep-09 Ongoing GEM D. Driver Oct-09 Ongoing Charge Nurse and Triage RN Education T. Reardon Mar-10 Ongoing Virtual CDU implemented Dr T. Chan Apr-10 Ongoing Schedule to Demand D. Edman Jun-10 Completed Rounding for Outcomes D. Edman Jun-10 Ongoing Performance Huddles Leadership Team Jun-10 Ongoing NP LTC B. Bickle Jun-10 Ongoing ED PIP Kaizen Events S. Gilbert Aug-10 In progress Schedule to Demand M. Tang Jan-11 Pending Page A1
- 4. The Scarborough Hospital Corporate Balanced Scorecard Publicly Reported Patient Safety Indicators Indicator Emergency Department Wait Time for High Acuity Visits - Birchmount Campus Strategic Direction Our Patients Time Frame Q4 2010/11 (Jan) Source MOHLTC Wait Times Website / NACRS Performance Measurement Summary Definition 22:51, n=2519 This indicator reports the 90th Percentile Wait time for all ED Admits with CTAS 1-5 2:00 and NonAdmits with CTAS 1-3. 0:00 17:02, n=6387 16:45, n=6561 16:31, n=6673 22:00 15:30, n=6325 14:06, n=6668 20:00 13:36, n=6812 Significance 12:12, n=7166 This indicator is associated with efficiency within the ED and within the hospital, as 18:00 well as with ED patient satisfaction. 16:00 14:00 Target 12:00 MOHLTC Target - 8:00, lower value is desired. 10:00 CHART PLACEHOLDER 8:00 Risk Rating High - There will be reputational impact of dissatisfied patients waiting in Emergency 6:00 Department and potential financial risk of losing Pay-for-Results funding. 4:00 Analysis 2:00 There are challenges related to specialty consultations and Diagnostic Imaging 0:00 procedures. Birchmount Campus Target Action Plan Initiative Lead Date Initiated Status Laboratory Technologists G. Bajwa Sep-09 Ongoing GEM E. Laine Jun-09 Ongoing NP LTC S. Vellani Jun-09 Ongoing Charge Nurse and Triage RN Education L. Vanden Kroonenberg Mar-10 Ongoing Virtual CDU implemented Dr T. Chan Apr-10 Ongoing ED PIP initiated N. Alli, T. Osgood May-10 In progress Rounding for Outcomes M. Tang Jun-10 Ongoing Performance Huddles Leadership Team Jun-10 Ongoing Schedule to Demand M. Tang Jan-11 Pending Page A2
- 5. The Scarborough Hospital Corporate Balanced Scorecard Publicly Reported Patient Safety Indicators Indicator Emergency Department Wait Time for Low Acuity Visits - General Campus Strategic Direction Our Patients Time Frame Q4 2010/11 (Jan) Source MOHLTC Wait Times Website / NACRS Performance Measurement Summary Definition This indicator reports the 90th Percentile Wait time for all NonAdmit with CTAS 4-5 visits. 06:37, n=5220 9:00 06:07, n=5325 05:54, n=4487 05:42, n=4779 05:37, n=5477 8:00 05:31, n=1245 05:12, n=4481 Significance 04:48, n=3713 This indicator is associated with efficiency within the ED and within the hospital, as 7:00 well as with ED patient satisfaction. 6:00 5:00 Target MOHLTC Target - 4:00, lower value is desired. 4:00 CHART PLACEHOLDER 3:00 Risk Rating High - There will be reputational impact of dissatisfied patients waiting in Emergency 2:00 Department and potential financial risk of losing Pay-for-Results funding. Analysis 1:00 There are challenges related to flow of patient treatment between major and minor 0:00 cases. General Campus Target Action Plan Initiative Lead Date Initiated Status RPN Role D. Edman Jun-09 Ongoing ED PIP initiated J. Phan, N. Velosos Sep-09 Ongoing See and Treat Model of Care ED Staff Mar-10 In progress Rounding for Outcomes D. Edman Jun-10 Ongoing Performance Huddles Leadership Team Jun-10 Ongoing Kaizen Events S. Gilbert Aug-10 In progress Page A3
- 6. The Scarborough Hospital Corporate Balanced Scorecard Publicly Reported Patient Safety Indicators Indicator Emergency Department Wait Time for Low Acuity Visits - Birchmount Campus Strategic Direction Our Patients Time Frame Q4 2010/11 (Jan) Source MOHLTC Wait Times Website / NACRS Performance Measurement Summary Definition This indicator reports the 90th Percentile Wait time for all NonAdmit with CTAS 4-5 visits. 06:37, n=3905 9:00 06:07, n=3811 05:54, n=3271 05:37, n=3894 8:00 05:18, n=3980 05:00, n=3950 04:57, n=1188 Significance 7:00 04:30, n=3973 This indicator is associated with efficiency within the ED and within the hospital, as well as with ED patient satisfaction. 6:00 5:00 Target MOHLTC Target - 4:00, lower value is desired. 4:00 CHART PLACEHOLDER 3:00 Risk Rating High - There will be reputational impact of dissatisfied patients waiting in Emergency 2:00 Department and potential financial risk of losing Pay-for-Results funding. 1:00 Analysis There are challenges related to flow of patient treatment between major and minor 0:00 cases. Birchmount Target Action Plan Initiative Lead Date Initiated Status RPN Role D. Edman Jun-09 Ongoing ED PIP initiated N. Alli, T. Osgood May-10 In progress Rounding for Outcomes D. Edman Jun-10 Ongoing Performance Huddles Leadership Team Jun-10 Ongoing See and Treat Model of Care ED Staff Aug-10 In progress Page A4
- 7. The Scarborough Hospital Corporate Balanced Scorecard Publicly Reported Patient Safety Indicators Indicator Percent of CTAS 1&2 meeting 8 hour target Strategic Direction Our Patients Time Frame Q4 2010/11 (Jan) Source MOHLTC Wait Times Website / NACRS Performance Measurement Summary Definition This indicator reports the percentage of ED patients with CTAS 1 and 2 who 100% 73%, n=1413 73%, n=1401 71%, n=4200 71%, n=3733 completed their visit (Registration to Leaving ED) within 8 hours. 71%, n=2787 70%, n=2332 69%, n=1228 69%, n=1203 69%, n=3248 69%, n=2045 90% 68%, n=1854 68%, n=3057 68%, n=1203 67%, n=1912 67%, n=3001 66%, n=3128 66%, n=1318 66%, n=1181 66%, n=1773 65%, n=1216 65%, n=2976 67%, n=855 64%, n=1795 65%, n=463 80% Significance To ensure adequate patient access and flow within ED and hospital. 70% 60% 50% Target MOHLTC Target - 90%, higher value is desired. 40% CHART PLACEHOLDER 30% Risk Rating High - There will be reputational impact of dissatisfied patients waiting in Emergency 20% Department and potential financial risk of losing Pay-for-Results funding. Analysis 10% There are challenges related to specialty consultations and Diagnostic Imaging 0% procedures. A Diagnostic Imaging Kaizen event is taking place to improve Diagnostic Imaging callbacks wait times. General Birchmount TSH Target Action Plan Initiative Lead Date Initiated Status ED PIP initiated J. Phan Sep-09 Ongoing GEM D. Driver Oct-09 Ongoing Charge Nurse and Triage RN Education T. Reardon Mar-10 Ongoing Virtual CDU implemented Dr T. Chan Apr-10 Ongoing Schedule to Demand D. Edman Jun-10 Completed Rounding for Outcomes D. Edman Jun-10 Ongoing Performance Huddles Leadership Team Jun-10 Ongoing NP LTC B. Bickle Jun-10 Ongoing ED PIP Kaizen Events S. Gilbert Aug-10 In progress Page A5
- 8. The Scarborough Hospital Corporate Balanced Scorecard Publicly Reported Patient Safety Indicators Indicator Percent of CTAS 3 meeting 6 hour target Strategic Direction Our Patients Time Frame Q4 2010/11 (Jan) Source MOHLTC Wait Times Website / NACRS Performance Measurement Summary Definition This indicator reports the percentage of ED patients with CTAS 3 who completed 100% 73%, n=4877 73%, n=8575 72%, n=3698 72%, n=4553 their visit (Registration to Leaving ED) within 6 hours. 70%, n=7756 90% 67%, n=3203 67%, n=1486 66%, n=2653 66%, n=1167 65%, n=3784 65%, n=6914 65%, n=3130 63%, n=2771 61%, n=5821 61%, n=2837 60%, n=6218 60%, n=3381 60%, n=3050 60%, n=3399 80% 59%, n=6120 58%, n=2563 58%, n=2721 55%, n=5167 Significance 51%, n=2604 To ensure adequate patient access and flow within ED and hospital. 70% 60% 50% Target MOHLTC Target - 90%, higher value is desired. 40% CHART PLACEHOLDER Risk Rating 30% High - There will be reputational impact of dissatisfied patients waiting in Emergency Department and potential financial risk of losing Pay-for-Results funding. 20% Analysis 10% There are challenges related to specialty consultations and Diagnostic Imaging procedures. A Diagnostic Imaging Kaizen event is taking place to improve 0% Diagnostic Imaging callbacks wait times. General Birchmount TSH Target Action Plan Initiative Lead Date Initiated Status ED PIP initiated J. Phan Sep-09 Ongoing GEM D. Driver Oct-09 Ongoing Charge Nurse and Triage RN Education T. Reardon Mar-10 Ongoing Virtual CDU implemented Dr T. Chan Apr-10 Ongoing Schedule to Demand D. Edman Jun-10 Completed Rounding for Outcomes D. Edman Jun-10 Ongoing Performance Huddles Leadership Team Jun-10 Ongoing NP LTC B. Bickle Jun-10 Ongoing ED PIP Kaizen Events S. Gilbert Aug-10 In progress Page A6
- 9. The Scarborough Hospital Corporate Balanced Scorecard Publicly Reported Patient Safety Indicators Indicator Percent of CTAS 4&5 meeting 4 hour target Strategic Direction Our Patients Time Frame Q4 2010/11 (Jan) Source MOHLTC Wait Times Website / NACRS Performance Measurement Summary Definition 79%, n=3600 81%, n=3253 80%, n=6853 82%, n=3101 85%, n=3438 84%, n=6539 79%, n=1965 80%, n=977 100% 76%, n=4280 76%, n=3093 78%, n=988 This indicator reports the percentage of ED patients with CTAS 4 and 5 who 75%, n=3457 75%, n=7258 74%, n=6627 74%, n=2978 73%, n=5863 73%, n=3974 73%, n=3534 72%, n=3864 71%, n=2406 71%, n=6608 completed their visit (Registration to Leaving ED) within 4 hours. 69%, n=6508 90% 68%, n=2634 66%, n=2644 80% Significance To ensure adequate patient access and flow within ED and hospital. 70% 60% 50% Target 40% MOHLTC Target - 90%, higher value is desired. CHART PLACEHOLDER 30% Risk Rating High - There will be reputational impact of dissatisfied patients waiting in Emergency 20% Department and potential financial risk of losing Pay-for-Results funding. 10% Analysis There are challenges related to flow of patient treatment between major and minor 0% cases. Q1 2009/10 Q2 2009/10 Q3 2009/10 Q4 2009/10 Q1 2010/11 Q2 2010/11 Q3 2010/11 Q4 2010/11 (Jan) General Birchmount TSH Target Action Plan Initiative Lead Date Initiated Status RPN Role D. Edman Jun-09 Ongoing ED-PIP initiated J. Phan, N. Velosos Sep-09 Ongoing See and Treat Model of Care ED Staff Mar-10 In progress Rounding for Outcomes D. Edman Jun-10 Ongoing Performance Huddles Leadership Team Jun-10 Ongoing Kaizen Events S. Gilbert Aug-10 In progress Page A7
- 10. The Scarborough Hospital Corporate Balanced Scorecard Publicly Reported Patient Safety Indicators Indicator Rate of Hospital Acquired C. difficile Associated Diarrhea Strategic Direction Our Patients Time Frame May 2011 Source Surveillance and Case Finding Performance Measurement Summary Definition 1.09, n=9 Overall Rate of hospital acquired C. difficile associated diarrhea. Rate is based on 1.20 total number of inpatients/patients with confirmed infection per 1000 patient-days. 1.00 0.78, n=11 Significance To track hospital acquired C. difficile rates in order to identify and implement infection control measures to prevent nosocomial spread of C. difficile. While C. 0.80 0.58, n=5 0.58, n=5 difficile does not usually present a big problem for reasonably healthy adults, it can 0.53, n=5 0.43,0.51, n=3 be quite serious for those who are frail or have other health challenges. 0.49, n=3 0.49, n=3 0.35, n=3 n=3 0.48, n=4 0.47, n=7 0.47, n=7 0.47, n=7 0.47, n=3 0.46, n=4 0.26, n=4 0.46, n=3 0.15, n=10.32, n=5 n=4 0.45, n=4 0.60 n=6 Target 0.40, n=6 0.48, 0.15, n=1 0.38, n=6 0.45, 0.37, n=3 0.36, n=3 Ontario Average - 0.28, lower value is desired. 0.35, n=5 0.34, n=2 0.34, n=5 0.13, n=1 0.34, n=2 0.33, n=2 0.26, n=4 0.26, n=2 CHART PLACEHOLDER 0.17, n=1 n=2 0.24, n=2 0.23, n=2 0.40 0.22, n=3 0.00, n=0 0.22, n=3 0.22, n=3 Risk Rating 0.20, n=3 0.25, 0.16, n=1 Medium- Controlling the rate of infection is very important to TSH. The increase in 0.15, n=2 0.13, n=1 0.12, n=1 0.11, n=1 the rate of infection may cause some financial and reputational risk to the 0.00, n=0 n=1 0.00, n=0n=1 organization. 0.20 0.00, n=0 0.00, n=0 0.00, n=0 0.00, n=0 0.00, n=0 0.00, n=0 0.07, 0.07, Analysis There have been a few months of increased cases of C. difficile at the General Campus since February 2010. Rates have begun to decline with increased - monitoring and vigilance of infection control practices in the inpatient areas. The Oct 09 Oct 10 Feb 10 Apr 10 May 10 Aug 10 Sep 10 Feb 11 Apr 11 May 11 Jun 10 Jul 10 Nov 09 Dec 09 Jan 10 Mar 10 Nov 10 Dec 10 Jan 11 Mar 11 Birchmount Campus remains below the Ontario Average. General Campus Birchmount Campus TSH Ontario Average per 1,000 patient-days TSH Rolling 12-month Average Action Plan Initiative Lead Date Initiated Status Increased vigilance to IPAC guidelines around C. difficile management for both campuses and enviromental E. Lipnicki Jan-11 Ongoing audits of units "Vernacare" system for both campuses emphasizing safe disposable of wastes on units has been implemented E. Lipnicki Jun-10 Completed Proposal being made for an antimicrobial stewardship program to help decrease the use of antibiotics IPAC/Pharmacy Feb-11 In progress associated with the development of C. difficile Page A8
- 11. The Scarborough Hospital Corporate Balanced Scorecard Publicly Reported Patient Safety Indicators Indicator Rate of Hospital Acquired Methicillin Resistant Staphylococcus Aureus (MRSA) Bacteraemia Strategic Direction Our Patients Time Frame Q4 2010/11 Source Surveillance and Case Finding Performance Measurement Summary Definition 0.06 0.00, n=0 Overall Rate of hospital acquired Methicillin Resistant Staphylococcus Aureus (MRSA) bacteraemia. Rate is based on total number of inpatients/patients with confirmed infection per 1000 patient-days. 0.05 0.00, n=0 0.00, n=0 0.00, n=0 Significance Higher MRSA colonization rates will lead to higher rates of blood stream infections 0.04 with MRSA. Tracking hospital acquired MRSA Bacteraemia rates helps to identify 0.00, n=0 the clinical significance of MRSA colonization. This will help identify a need for 0.00, n=0 0.00, n=0 0.00, n=0 further strategies to prevent nosocomial spread of MRSA. 0.03 Target Ontario Average - 0.02, lower value is desired. 0.02 CHART PLACEHOLDER Risk Rating n/a 0.01 0.11, n=1 0.00, n=0 0.06, n=1 0.00, n=0 0.00, n=0 0.00, n=0 0.00, n=0 0.00, n=0 0.00, n=0 0.00, n=0 0.00, n=0 0.00, n=0 0.00, n=0 0.00, n=0 0.00, n=0 0.00, n=0 0.00, n=0 0.00, n=0 0.00, n=0 0.00, n=0 0.00, n=0 0.00, n=0 Analysis 0.00 Both General Campus and Birchmount Campus remains below the Ontario Average. General Campus Birchmount Campus TSH Ontario Average per 1,000 patient-days TSH Rolling 12-month Average Action Plan Initiative Lead Date Initiated Status Continue with MRSA surveillance protocols E. Lipnicki Jul-10 Ongoing Begin universal screening for MRSA colonization on admission IPAC Dec-10 In progress Page A9
- 12. The Scarborough Hospital Corporate Balanced Scorecard Publicly Reported Patient Safety Indicators Indicator Rate of Hospital Acquired Vancomycin Resistant Enterococcus (VRE) Bacteraemia Strategic Direction Our Patients Time Frame Q4 2010/11 Source Surveillance and Case Finding Performance Measurement Summary Definition Overall Rate of hospital acquired Vancomycin Resistant Enterococcus (VRE) 0.012 bacteraemia. Rate is based on total number of inpatients/patients with confirmed infection per 1000 patient-days. 0.010 Significance To track hospital acquired VRE bacteraemia rates in order to identify and implement 0.008 necessary prevention plans to reduce the risk of infection from spreading. 0.006 Target Ontario Average - 0.00, lower value is desired. 0.004 CHART PLACEHOLDER 0.00, n=0 0.00, n=0 0.00, n=0 0.00, n=0 0.00, n=0 0.00, n=0 0.00, n=0 0.00, n=0 0.00, n=0 0.00, n=0 0.00, n=0 0.00, n=0 0.00, n=0 0.00, n=0 0.00, n=0 0.00, n=0 0.00, n=0 0.00, n=0 0.00, n=0 0.00, n=0 0.00, n=0 0.00, n=0 0.00, n=0 0.00, n=0 0.00, n=0 0.00, n=0 0.00, n=0 0.00, n=0 0.00, n=0 0.00, n=0 Risk Rating 0.002 n/a 0.000 Analysis There have been no reportable cases of VRE bacteraemia despite increased numbers of VRE colonized patients since April 2010. General Campus Birchmount Campus TSH Ontario Average per 1,000 patient-days TSH Rolling 12-month Average Action Plan Initiative Lead Date Initiated Status VRE colonization outbreak over July 2010. Continue with IPAC protocols and ICRT recommendations for E. Lipnicki Apr-10 Completed July 2010 surveillance and outbreak management policies ICRT invited for third party review July 20, 2010- waiting for final recommendations E. Lipnicki Jul-10 Completed Universal screening to be implemented to identify patients colonized with VRE on admission and thus reduce nosocomial spread IPAC Dec-10 In progress Page A10