Tilanne ja näkymät 3/2014 -raportin kuvat
•
0 likes•429 views

Teknologiateollisuuden liikevaihto oli tammi-huhtikuussa hieman pienempi kuin vuosi sitten samaan aikaan. Tilausten kasvu on pysähtynyt. Venäjän tilanne leikkaa jo teknologiateollisuuden vientiä. Suomen talous ei selviä ilman yksityisten investointien merkittävää lisäystä.

Recommended
Recommended
More Related Content
What's hot
What's hot (20)
Similar to Tilanne ja näkymät 3/2014 -raportin kuvat
Similar to Tilanne ja näkymät 3/2014 -raportin kuvat (20)
More from TechFinland
More from TechFinland (20)
Tilanne ja näkymät 3/2014 -raportin kuvat
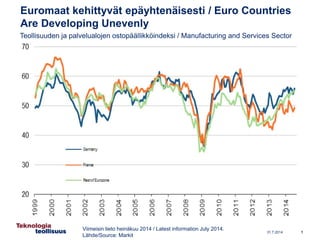
- 1. Euromaat kehittyvät epäyhtenäisesti / Euro Countries Are Developing Unevenly Viimeisin tieto heinäkuu 2014 / Latest information July 2014. Lähde/Source: Markit Teollisuuden ja palvelualojen ostopäällikköindeksi / Manufacturing and Services Sector Purchasing Magers’ Index 31.7.2014 1 50 = ei muutosta edelliskuukaudesta / 50 = no change on previous month
- 2. 31.7.2014 Nykyisellä tuotantokapasiteetilla teollisuustuotanto ja Suomen vienti eivät palaudu 2008 tasolle Tuotantokapasiteetti on vähentynyt 20 % 70 75 80 85 90 95 100 105 110 115 120 125 Teollisuuden tuotantokyky (tuotanto, jos kapasiteetti täyskäytössä) Suomen koko tavara- ja palveluvienti (2008=100) Teollisuuden työpaikat (2008=100) Teollisuuden tuotanto (2008=100) -16% -22% -18% Työpäivä- ja kausivaihtelusta korjatut aikasarjat. Lähde: Tilastokeskus / Kansantalouden tilinpito, Teollisuustuotannon volyymi-indeksi 2 2008 2009 2010 2011 2012 2013 2014 -21%
- 3. Teollisuuden investoinnit huolestuttavalla tasolla 0 1 000 2 000 3 000 4 000 5 000 6 000 7 000 8 000 9 000 10 000 2005 2006 2007 2008 2009 2010 2011 2012 2013 2014e Teollisuus Teknologiateollisuus Teollisuuden kiinteät sekä tutkimus- ja kehittämisinvestoinnit Suomessa Lähde: Tilastokeskus, EK:n investointitiedustelu (kesäkuu 2014) 31.7.2014 3 Milj. euroa, käyvin hinnoin / Million euros, at current prices
- 4. Julkinen velka ja veroaste kasvavat hallitsemattomasti Kustannustaakka on paisunut, siksi julkista sektoria on karsittava 431.7.2014
- 5. 31.7.2014 Teknologiateollisuuden* uudet tilaukset Suomessa Value of New Orders in the Technology Industry* in Finland 0 1 000 2 000 3 000 4 000 5 000 6 000 7 000 8 000 9 000 10 000 11 000 12 000 Yhteensä / Combined Vientiin / Export Kotimaahan / Domestic Milj. euroa, käyvin hinnoin / Million euros, at current prices Lähde/Source: Teknologiateollisuus ry:n tilauskantatiedustelun vastaajayritykset, viimeisin tieto huhti-kesäkuu 2014 / The Federation of Finnish Technology Industries’ order book survey’s respondent companies, latest information April-June 2014 *) Pl. metallien jalostus ja pelialan yritykset / Excluding metals industry and game industry companies. 2005 2006 2007 2008 2009 2010 2011 2012 2013 2014 Muutos / Change: II,2014 / II,2013 II,2014 / I,2014 Vientiin / Export: -1 % +1 % Kotimaahan / Domestic: +3 % -9 % Yhteensä) / Combined: 0 % -1 % 5
- 6. 31.7.2014 0 2 000 4 000 6 000 8 000 10 000 12 000 14 000 16 000 18 000 20 000 22 000 24 000 Vientiin / Export Kotimaahan / Domestic Teknologiateollisuuden* tilauskanta Suomessa Value of Order Books in the Technology Industry* in Finland Milj. euroa, käyvin hinnoin / Million euros, at current prices Lähde/Source: Teknologiateollisuus ry:n tilauskantatiedustelun vastaajayritykset, viimeisin tieto 30.6.2014 / The Federation of Finnish Technology Industries’ order book survey’s respondent companies, latest information 30.6.2014 *) Pl. metallien jalostus ja pelialan yritykset / Excluding metals industry and game industry companies. Yhteensä / Combined Muutos / Change: 30.6.2014 / 30.6.2013 30.6.2014 / 31.3.2014 Vientiin / Export: -10 % -4 % Kotimaahan / Domestic: +2 % 0 % Yhteensä / Combined: -7 % -3 % 2005 2006 2007 2008 2009 2010 2011 2012 2013 2014 6
- 7. Teknologiateollisuuden yritysten saamat tarjouspyynnöt* Tender Requests* Received by Technology Industry Companies Lähde/Source: Teknologiateollisuus ry:n tilauskantatiedustelu, viimeisin kyselyajankohta: heinäkuu 2014 / The Federation of Finnish Technology Industries’ order book survey, latest information: July 2014. ”Onko tarjouspyyntöjen määrässä viime viikkoina näkyvissä oleellista vähenemistä tai lisääntymistä, kun verrataan tilannetta noin kolme kuukautta sitten vallinneeseen tilanteeseen”. Saldoluku = niiden yritysten osuus, joissa tarjouspyyntöjen määrä on lisääntynyt – niiden yritysten määrä, joissa tarjouspyyntöjen määrä on vähentynyt. “Have you experienced a notable increase or decrease in the number of requests for tenders in recent weeks in comparison to the situation three months ago?”. Balance figure = the number of companies receiving more requests - the number of companies receiving less requests -60 -50 -40 -30 -20 -10 0 10 20 30 40 Saldoluku / Balance figure 731.7.2014 2005 2006 2007 2008 2009 2010 2011 2012 2013 2014
- 8. Teknologiateollisuuden henkilöstö Personnel in the Technology Industry 0 20 000 40 000 60 000 80 000 100 000 120 000 140 000 160 000 180 000 200 000 220 000 240 000 260 000 280 000 300 000 320 000 340 000 2005 2006 2007 2008 2009 2010 2011 2012 2013 2014 (30.6) Henkilöstö Suomessa / Personnel in Finland Henkilöstö tytäryrityksissä ulkomailla / Personnel in subsidiaries abroad Lähde / Source: Tilastokeskus, Teknologiateollisuus ry:n henkilöstötiedustelu / Statistics Finland, The Federation of Finnish Technology Industries’ labour force survey Henkilöstöstä noin 13 000 lomautusjärjestelyjen piirissä 30.6.2014 / Some 13 000 of employees affected by temporary or part- time lay-offs 30.6.2014 31.7.2014 8
- 9. 31.7.2014 Elektroniikka- ja sähköteollisuuden uudet tilaukset Suomessa Value of New Orders in the Electronics and Electrotechnical Industry in Finland 0 500 1 000 1 500 2 000 2 500 3 000 3 500 4 000 4 500 5 000 5 500 6 000 6 500 7 000 Yhteensä / Combined Vientiin / Export Kotimaahan / Domestic Milj. euroa, käyvin hinnoin / Million euros, at current prices 2005 2006 2007 2008 2009 2010 2011 2012 2013 2014 Muutos / Change: II,2014 / II,2013 II,2014 / I,2014 Vientiin / Export: -23 % -10 % Kotimaahan / Domestic: +7 % +3 % Yhteensä / Combined: -19 % -8 % Lähde/Source: Teknologiateollisuus ry:n tilauskantatiedustelun vastaajayritykset, viimeisin tieto huhti-kesäkuu 2014 / The Federation of Finnish Technology Industries’ order book survey’s respondent companies, latest information April-June 2014 9
- 10. 31.7.2014 0 500 1 000 1 500 2 000 2 500 3 000 3 500 4 000 4 500 5 000 5 500 6 000 6 500 7 000 7 500 8 000 Vientiin / Export Kotimaahan / Domestic Elektroniikka- ja sähköteollisuuden tilauskanta Suomessa Value of Order Books in the Electronics and Electrotechnical Industry in Finland Yhteensä / Combined Milj. euroa, käyvin hinnoin / Million euros, at current prices Muutos / Change: 30.6.2014 / 30.6.2013 30.6.2014 / 31.3.2014 Vientiin / Export: -23 % -9 % Kotimaahan / Domestic: +8 % +8 % Yhteensä / Combined: -20 % -7 % Lähde/Source: Teknologiateollisuus ry:n tilauskantatiedustelun vastaajayritykset, viimeisin tieto 30.6.2014 / The Federation of Finnish Technology Industries’ order book survey’s respondent companies, latest information 30.6.2014 10 2005 2006 2007 2008 2009 2010 2011 2012 2013 2014
- 11. 31.7.2014 Kone- ja metallituoteteollisuuden uudet tilaukset Suomessa Value of New Orders in the Mechanical Engineering in Finland 0 500 1 000 1 500 2 000 2 500 3 000 3 500 4 000 4 500 Yhteensä / Combined Vientiin / Export Kotimaahan / Domestic Milj. euroa, käyvin hinnoin / Million euros, at current prices 2005 2006 2007 2008 2009 2010 2011 2012 2013 2014 Muutos / Change: II,2014 / II,2013 II,2014 / I,2014 Vientiin / Export: +29 % +14 % Kotimaahan / Domestic: +16 % -3 % Yhteensä / Combined: +26 % +10 % Lähde/Source: Teknologiateollisuus ry:n tilauskantatiedustelun vastaajayritykset, viimeisin tieto huhti-kesäkuu 2014 / The Federation of Finnish Technology Industries’ order book survey’s respondent companies, latest information April-June 2014 11
- 12. 31.7.2014 0 1 000 2 000 3 000 4 000 5 000 6 000 7 000 8 000 9 000 10 000 11 000 12 000 13 000 14 000 15 000 Vientiin / Export Kotimaahan / Domestic Kone- ja metallituoteteollisuuden tilauskanta Suomessa Value of Order Books in the Mechanical Engineering in Finland Yhteensä / Combined Milj. euroa, käyvin hinnoin / Million euros, at current prices Muutos / Change: 30.6.2014 / 30.6.2013 30.6.2014 / 31.3.2014 Vientiin / Export: -3 % -2 % Kotimaahan / Domestic: -1 % -3 % Yhteensä / Combined: -3 % -2 % 2005 2006 2007 2008 2009 2010 2011 2012 2013 2014 Lähde/Source: Teknologiateollisuus ry:n tilauskantatiedustelun vastaajayritykset, viimeisin tieto 30.6.2014 / The Federation of Finnish Technology Industries’ order book survey’s respondent companies, latest information 30.6.2014 12
- 13. Metallien jalostuksen liikevaihto Suomessa Turnover of the Metals Industry in Finland 50 60 70 80 90 100 110 120 130 140 150 160 2005 = 100 2005 2006 2007 2008 2009 2010 2011 2012 2013 2014 Muutos/Change: 1-4,2014 / 1-4,2013, % Lähde/Source: Tilastokeskus / Statistics Finland Kausipuhdistettu liikevaihdon arvoindeksi, viimeisin tieto 4/2014. / Seasonally adjusted turnover index, latest information 4/2014. -7 % 31.7.2014 13
- 14. 50 60 70 80 90 100 110 120 130 2005 = 100 2005 2006 2007 2008 2009 2010 2011 2012 2013 2014 Muutos/Change: 1-5,2014 / 1-5,2013, % +6 % Metallien jalostuksen tuotannon määrä Suomessa Production Volume of the Metals Industry in Finland Kausipuhdistettu volyymi-indeksi, viimeisin tieto 5/2014. / Seasonally adjusted volume index, latest information 5/2014. Lähde/Source: Tilastokeskus / Statistics Finland 31.7.2014 14
- 15. 31.7.2014 Suunnittelu- ja konsultointialan uudet tilaukset Suomessa Value of New Orders in the Consulting Engineering in Finland 0 20 40 60 80 100 120 140 160 180 200 220 240 260 280 300 320 Yhteensä / Combined Vientiin / Export Kotimaahan / Domestic Milj. euroa, käyvin hinnoin / Million euros, at current prices 2005 2006 2007 2008 2009 2010 2011 2012 2013 2014 Muutos / Change: II,2014 / II,2013 II,2014 / I,2014 Vientiin / Export: -12 % -10 % Kotimaahan / Domestic: +20 % -4 % Yhteensä / Combined: +16 % -5 % Lähde/Source: Teknologiateollisuus ry:n tilauskantatiedustelun vastaajayritykset, viimeisin tieto huhti-kesäkuu 2014 / The Federation of Finnish Technology Industries’ order book survey’s respondent companies, latest information April-June 2014 15
- 16. 31.7.2014 0 50 100 150 200 250 300 350 400 450 500 550 Vientiin / Export Kotimaahan / Domestic Suunnittelu- ja konsultointialan tilauskanta Suomessa Value of Order Books in the Consulting Engineering in Finland Yhteensä / Combined Milj. euroa, käyvin hinnoin / Million euros, at current prices Lähde/Source: Teknologiateollisuus ry:n tilauskantatiedustelun vastaajayritykset, viimeisin tieto 30.6.2014 / The Federation of Finnish Technology Industries’ order book survey’s respondent companies, latest information 30.6.2014 2005 2006 2007 2008 2009 2010 2011 2012 2013 2014 Muutos / Change: 30.6.2014 / 30.6.2013 30.6.2014 / 31.3.2014 Vientiin / Export: -3 % +5 % Kotimaahan / Domestic: +14 % +6 % Yhteensä / Combined: +11 % +6 % 16
- 17. 31.7.2014 Tietotekniikka-alan* uudet tilaukset Suomessa Value of New Orders in the Information Technology in Finland 0 50 100 150 200 250 300 350 400 450 500 550 600 650 700 750 800 Milj. euroa, käyvin hinnoin / Million euros, at current prices 2005 2006 2007 2008 2009 2010 2011 2012 2013 2014 Muutos / Change: II,2014 / II,2013 II,2014 / I,2014 Yhteensä / Combined: -15 % -25 % Lähde/Source: Teknologiateollisuus ry:n tilauskantatiedustelun vastaajayritykset, viimeisin tieto huhti-kesäkuu 2014 / The Federation of Finnish Technology Industries’ order book survey’s respondent companies, latest information April-June 2014 17 *) Pl. pelialan yritykset / Excl. game industry companies.
- 18. 31.7.2014 Tietotekniikka-alan* tilauskanta Suomessa Value of Order Books in the Information Technology in Finland 0 100 200 300 400 500 600 700 800 900 1 000 1 100 1 200 1 300 1 400 1 500 1 600 Milj. euroa, käyvin hinnoin / Million euros, at current prices 2007 2008 2009 2010 2011 2012 2013 2014 Muutos / Change: 30.6.2014 / 30.6.2013 30.6.2014 / 31.3.2014 Yhteensä / Combined: 0 % -1 % Lähde/Source: Teknologiateollisuus ry:n tilauskantatiedustelun vastaajayritykset, viimeisin tieto 30.6.2014 / The Federation of Finnish Technology Industries’ order book survey’s respondent companies, latest information 30.6.2014 18 *) Pl. pelialan yritykset / Excl. game industry companies.