SlideShare uma empresa Scribd logo
1 de 20
Blake Taylor                                                                                                                                                                         Austin Board of REALTORS
                                                                             Median Sold Price by Month
                                                                   Dec-08 vs. Dec-10: The median sold price is down 0%


                                                                                  Dec-08 vs. Dec-10
                   Dec-08                                           Dec-10                                         Change                                              %
                   260,000                                          259,900                                         -100                                              -0%


MLS: ACTRIS        Period:   2 years (monthly)           Price:   All                        Construction Type:    All            Bedrooms:    All             Bathrooms:      All         Lot Size: All
Property Types:    Residential: (House, Condo, Townhouse, Manufactured, Half Duplex, Mobile Home, Loft, Residential - Unknown)                                                             Sq Ft:    All
MLS Areas:         SWW


Clarus MarketMetrics®                                                                                     1 of 2                                                                                           01/18/2011
                                                 Information not guaranteed. © 2009-2010 Terradatum and its suppliers and licensors (www.terradatum.com/about/licensors.td).


                  www.TaylorRealEstateAustin.com | www.EarlyBirdAustin.com | Direct: 512.796.4447 | Fax: 512.628.7720 | 1701 Spyglass Dr. Ste. 8 Austin, TX 78746
                                                                                                         1 of 20
Blake Taylor                                                                                                                                                         Austin Board of REALTORS
                                                                   Median Sold Price by Month
                                                          Dec-08 vs. Dec-10: The median sold price is down 0%


Time Period             Median Price            # Units       Average DOM
Dec-10                      259,900                  43                    57
Nov-10                      275,000                  35                    78
Oct-10                      280,000                  39                    83
Sep-10                      262,250                  40                    65
Aug-10                      315,000                  39                    60
Jul-10                      272,500                  58                    42
Jun-10                      297,000                  61                    41
May-10                      281,750                  84                    38
Apr-10                      264,900                  61                    37
Mar-10                      265,850                  48                    44
Feb-10                      274,500                  40                    56
Jan-10                      289,000                  15                    89
Dec-09                      274,000                  45                    88
Nov-09                      287,000                  42                    62
Oct-09                      278,000                  61                    53
Sep-09                      267,000                  65                    57
Aug-09                      271,000                  59                    64
Jul-09                      279,000                  70                    54
Jun-09                      251,500                  67                    64
May-09                      283,000                  67                    74
Apr-09                      258,250                  54                    56
Mar-09                      282,500                  41                    71
Feb-09                      270,000                  29                    69
Jan-09                      227,000                  19                    71
Dec-08                      260,000                  33                    76


Clarus MarketMetrics®                                                                           2 of 2                                                                                01/18/2011
                                       Information not guaranteed. © 2009-2010 Terradatum and its suppliers and licensors (www.terradatum.com/about/licensors.td).


              www.TaylorRealEstateAustin.com | www.EarlyBirdAustin.com | Direct: 512.796.4447 | Fax: 512.628.7720 | 1701 Spyglass Dr. Ste. 8 Austin, TX 78746
                                                                                                     2 of 20
Blake Taylor                                                                                                                                                                          Austin Board of REALTORS
                                                                          Median For Sale vs. Median Sold
         Dec-08 vs. Dec-10: The median price of for sale properties is down 10% and the median price of sold properties is down 0%


                             Dec-08 vs. Dec-10                                                                                                                       Dec-08 vs. Dec-10
    Dec-08              Dec-10                Change                       %                                                                    Dec-08             Dec-10                Change              %
    309,900             279,900               -30,000                    -10%                                                                   260,000            259,900                -100              -0%


MLS: ACTRIS        Period:    2 years (monthly)           Price:   All                        Construction Type:    All             Bedrooms:    All            Bathrooms:      All         Lot Size: All
Property Types:    Residential: (House, Condo, Townhouse, Manufactured, Half Duplex, Mobile Home, Loft, Residential - Unknown)                                                              Sq Ft:    All
MLS Areas:         SWW


Clarus MarketMetrics®                                                                                      1 of 2                                                                                            01/18/2011
                                                  Information not guaranteed. © 2009-2010 Terradatum and its suppliers and licensors (www.terradatum.com/about/licensors.td).


                  www.TaylorRealEstateAustin.com | www.EarlyBirdAustin.com | Direct: 512.796.4447 | Fax: 512.628.7720 | 1701 Spyglass Dr. Ste. 8 Austin, TX 78746
                                                                                                         3 of 20
Blake Taylor                                                                                                                                                          Austin Board of REALTORS
                                                              Median For Sale vs. Median Sold
         Dec-08 vs. Dec-10: The median price of for sale properties is down 10% and the median price of sold properties is down 0%

                             For Sale                # Properties                         Sold                 # Properties                        Price
Time Period                   Median                     For Sale                       Median                        Sold                    Difference
Dec-10                       279,900                            181                    259,900                            43                     -20,000
Nov-10                       284,900                            205                    275,000                            35                       -9,900
Oct-10                       295,950                            229                    280,000                            39                     -15,950
Sep-10                       295,950                            259                    262,250                            40                     -33,700
Aug-10                       289,700                            288                    315,000                            39                      25,300
Jul-10                       299,900                            312                    272,500                            58                     -27,400
Jun-10                       299,900                            310                    297,000                            61                       -2,900
May-10                       300,000                            296                    281,750                            84                     -18,250
Apr-10                       299,994                            320                    264,900                            61                     -35,094
Mar-10                       299,995                            262                    265,850                            48                     -34,145
Feb-10                       295,000                            223                    274,500                            40                     -20,500
Jan-10                       292,250                            190                    289,000                            15                       -3,249
Dec-09                       299,945                            178                    274,000                            45                     -25,945
Nov-09                       299,900                            193                    287,000                            42                     -12,900
Oct-09                       303,750                            220                    278,000                            61                     -25,750
Sep-09                       299,900                            257                    267,000                            65                     -32,900
Aug-09                       299,900                            285                    271,000                            59                     -28,900
Jul-09                       305,000                            297                    279,000                            70                     -26,000
Jun-09                       309,000                            289                    251,500                            67                     -57,500
May-09                       309,000                            293                    283,000                            67                     -26,000
Apr-09                       309,500                            275                    258,250                            54                     -51,250
Mar-09                       299,950                            283                    282,500                            41                     -17,450
Feb-09                       299,900                            233                    270,000                            29                     -29,900
Jan-09                       299,900                            231                    227,000                            19                     -72,900
Dec-08                       309,900                            241                    260,000                            33                     -49,900


Clarus MarketMetrics®                                                                            2 of 2                                                                                01/18/2011
                                        Information not guaranteed. © 2009-2010 Terradatum and its suppliers and licensors (www.terradatum.com/about/licensors.td).


              www.TaylorRealEstateAustin.com | www.EarlyBirdAustin.com | Direct: 512.796.4447 | Fax: 512.628.7720 | 1701 Spyglass Dr. Ste. 8 Austin, TX 78746
                                                                                                     4 of 20
Blake Taylor                                                                                                                                                                         Austin Board of REALTORS
                                                                                 Sold Properties by Month
                                                             Dec-08 vs. Dec-10: The number of Sold properties is up 30%


                                                                                  Dec-08 vs. Dec-10
                   Dec-08                                               Dec-10                                     Change                                             %
                     33                                                   43                                         10                                              +30%


MLS: ACTRIS        Period:   2 years (monthly)           Price:   All                        Construction Type:    All             Bedrooms:    All            Bathrooms:      All         Lot Size: All
Property Types:    Residential: (House, Condo, Townhouse, Manufactured, Half Duplex, Mobile Home, Loft, Residential - Unknown)                                                             Sq Ft:    All
MLS Areas:         SWW


Clarus MarketMetrics®                                                                                     1 of 2                                                                                           01/18/2011
                                                 Information not guaranteed. © 2009-2010 Terradatum and its suppliers and licensors (www.terradatum.com/about/licensors.td).


                  www.TaylorRealEstateAustin.com | www.EarlyBirdAustin.com | Direct: 512.796.4447 | Fax: 512.628.7720 | 1701 Spyglass Dr. Ste. 8 Austin, TX 78746
                                                                                                         5 of 20
Blake Taylor                                                                                                                                                          Austin Board of REALTORS
                                                                       Sold Properties by Month
                                                    Dec-08 vs. Dec-10: The number of Sold properties is up 30%


                                       Full Market                                                Bank Properties                                            Non-Bank Properties
Time Period             # Properties      Median Price         Average DOM              # Properties         % Bank            Median Price           # Properties    % Non-Bank   Median Price
Dec-10                           43             259,900                     57                      0                                                            43        100.0       259,900
Nov-10                           35             275,000                     78                      1             2.9               253,000                      34         97.1       275,500
Oct-10                           39             280,000                     83                      0                                                            39        100.0       280,000
Sep-10                           40             262,250                     65                      2             5.0               282,500                      38         95.0       262,250
Aug-10                           39             315,000                     60                      1             2.6               500,000                      38         97.4       310,000
Jul-10                           58             272,500                     42                      0                                                            58        100.0       272,500
Jun-10                           61             297,000                     41                      1             1.6               425,000                      60         98.4       295,500
May-10                           84             281,750                     38                      2             2.4               246,375                      82         97.6       281,750
Apr-10                           61             264,900                     37                      1             1.6               311,000                      60         98.4       264,600
Mar-10                           48             265,850                     44                      1             2.1               245,000                      47         97.9       267,500
Feb-10                           40             274,500                     56                      1             2.5               352,900                      39         97.5       274,000
Jan-10                           15             289,000                     89                      0                                                            15        100.0       289,000
Dec-09                           45             274,000                     88                      5            11.1               290,000                      40         88.9       273,550
Nov-09                           42             287,000                     62                      0                                                            42        100.0       287,000
Oct-09                           61             278,000                     53                      0                                                            61        100.0       278,000
Sep-09                           65             267,000                     57                      4             6.2               263,532                      61         93.8       267,000
Aug-09                           59             271,000                     64                      0                                                            59        100.0       271,000
Jul-09                           70             279,000                     54                      1             1.4               265,000                      69         98.6       280,000
Jun-09                           67             251,500                     64                      2             3.0               268,552                      65         97.0       250,500
May-09                           67             283,000                     74                      5             7.5               300,000                      62         92.5       279,450
Apr-09                           54             258,250                     56                      4             7.4               242,500                      50         92.6       271,500
Mar-09                           41             282,500                     71                      3             7.3               240,000                      38         92.7       302,500
Feb-09                           29             270,000                     69                      1             3.5               240,000                      28         96.5       271,250
Jan-09                           19             227,000                     71                      0                                                            19        100.0       227,000
Dec-08                           33             260,000                     76                      1             3.0               202,000                      32         97.0       270,000


Clarus MarketMetrics®                                                                            2 of 2                                                                                  01/18/2011
                                        Information not guaranteed. © 2009-2010 Terradatum and its suppliers and licensors (www.terradatum.com/about/licensors.td).


              www.TaylorRealEstateAustin.com | www.EarlyBirdAustin.com | Direct: 512.796.4447 | Fax: 512.628.7720 | 1701 Spyglass Dr. Ste. 8 Austin, TX 78746
                                                                                                     6 of 20
Blake Taylor                                                                                                                                                                         Austin Board of REALTORS
                                                                    Under Contract Properties by Month
                                                    Dec-08 vs. Dec-10: The number of Under Contract properties is up 56%


                                                                                  Dec-08 vs. Dec-10
                   Dec-08                                               Dec-10                                     Change                                             %
                     25                                                   39                                         14                                              +56%


MLS: ACTRIS        Period:   2 years (monthly)           Price:   All                        Construction Type:    All             Bedrooms:    All            Bathrooms:      All         Lot Size: All
Property Types:    Residential: (House, Condo, Townhouse, Manufactured, Half Duplex, Mobile Home, Loft, Residential - Unknown)                                                             Sq Ft:    All
MLS Areas:         SWW


Clarus MarketMetrics®                                                                                     1 of 2                                                                                           01/18/2011
                                                 Information not guaranteed. © 2009-2010 Terradatum and its suppliers and licensors (www.terradatum.com/about/licensors.td).


                  www.TaylorRealEstateAustin.com | www.EarlyBirdAustin.com | Direct: 512.796.4447 | Fax: 512.628.7720 | 1701 Spyglass Dr. Ste. 8 Austin, TX 78746
                                                                                                         7 of 20
Blake Taylor                                                                                                                                                          Austin Board of REALTORS
                                                          Under Contract Properties by Month
                                           Dec-08 vs. Dec-10: The number of Under Contract properties is up 56%


                                       Full Market                                                Bank Properties                                            Non-Bank Properties
Time Period             # Properties      Median Price         Average DOM              # Properties         % Bank            Median Price           # Properties    % Non-Bank   Median Price
Dec-10                           39             274,950                     94                      1             2.6               234,900                      38         97.4       274,975
Nov-10                           37             265,000                     53                      0                                                            37        100.0       265,000
Oct-10                           38             282,500                     72                      0                                                            38        100.0       282,500
Sep-10                           45             269,000                     87                      2             4.4               234,950                      43         95.6       269,900
Aug-10                           39             279,900                     65                      2             5.1               452,500                      37         94.9       279,900
Jul-10                           44             295,992                     52                      0                                                            44        100.0       295,992
Jun-10                           59             275,900                     42                      0                                                            59        100.0       275,900
May-10                           52             299,000                     42                      1             1.9               383,675                      51         98.1       299,000
Apr-10                           81             285,000                     34                      1             1.2               339,900                      80         98.8       282,950
Mar-10                           62             264,950                     43                      2             3.2               231,700                      60         96.8       264,950
Feb-10                           43             254,900                     42                      1             2.3               241,900                      42         97.7       254,932
Jan-10                           44             296,750                     43                      1             2.3               352,900                      43         97.7       296,000
Dec-09                           24             279,000                    118                      1             4.2               299,900                      23         95.8       259,000
Nov-09                           32             262,488                     53                      2             6.2               209,900                      30         93.8       269,988
Oct-09                           51             299,900                     82                      1             2.0               390,000                      50         98.0       294,950
Sep-09                           67             289,900                     53                      2             3.0               309,950                      65         97.0       288,000
Aug-09                           63             275,000                     56                      2             3.2               292,450                      61         96.8       275,000
Jul-09                           61             278,483                     57                      0                                                            61        100.0       278,483
Jun-09                           57             273,900                     58                      2             3.5               261,950                      55         96.5       279,000
May-09                           76             259,950                     62                      1             1.3               262,105                      75         98.7       259,900
Apr-09                           61             284,900                     71                      4             6.6               301,950                      57         93.4       282,500
Mar-09                           59             274,900                     60                      4             6.8               253,500                      55         93.2       275,000
Feb-09                           35             269,999                     79                      3             8.6               224,900                      32         91.4       294,450
Jan-09                           37             284,983                     66                      3             8.1               279,900                      34         91.9       289,942
Dec-08                           25             225,000                     80                      0                                                            25        100.0       225,000


Clarus MarketMetrics®                                                                            2 of 2                                                                                  01/18/2011
                                        Information not guaranteed. © 2009-2010 Terradatum and its suppliers and licensors (www.terradatum.com/about/licensors.td).


              www.TaylorRealEstateAustin.com | www.EarlyBirdAustin.com | Direct: 512.796.4447 | Fax: 512.628.7720 | 1701 Spyglass Dr. Ste. 8 Austin, TX 78746
                                                                                                     8 of 20
Blake Taylor                                                                                                                                                                         Austin Board of REALTORS
                                                                                 New Properties by Month
                                                              Dec-08 vs. Dec-10: The number of New properties is up 8%


                                                                                  Dec-08 vs. Dec-10
                   Dec-08                                               Dec-10                                     Change                                              %
                     36                                                   39                                         3                                                +8%


MLS: ACTRIS        Period:   2 years (monthly)           Price:   All                        Construction Type:    All             Bedrooms:    All            Bathrooms:      All         Lot Size: All
Property Types:    Residential: (House, Condo, Townhouse, Manufactured, Half Duplex, Mobile Home, Loft, Residential - Unknown)                                                             Sq Ft:    All
MLS Areas:         SWW


Clarus MarketMetrics®                                                                                     1 of 2                                                                                           01/18/2011
                                                 Information not guaranteed. © 2009-2010 Terradatum and its suppliers and licensors (www.terradatum.com/about/licensors.td).


                  www.TaylorRealEstateAustin.com | www.EarlyBirdAustin.com | Direct: 512.796.4447 | Fax: 512.628.7720 | 1701 Spyglass Dr. Ste. 8 Austin, TX 78746
                                                                                                         9 of 20
Blake Taylor                                                                                                                                                         Austin Board of REALTORS
                                                                      New Properties by Month
                                                    Dec-08 vs. Dec-10: The number of New properties is up 8%


                            Full Market                                   Bank Properties                                             Non-Bank Properties
Time Period             # Properties     Median Price            # Properties         % Bank              Median Price         # Properties       % Non-Bank          Median Price
Dec-10                           39            255,000                       2             5.1                227,400                     37               94.9           259,500
Nov-10                           52            269,900                       4             7.7                311,450                     48               92.3           264,950
Oct-10                           45            285,000                       0                                                            45             100.0            285,000
Sep-10                           44            296,500                       2             4.5                288,400                     42               95.5           296,500
Aug-10                           47            269,900                       1             2.1                200,000                     46               97.9           269,950
Jul-10                           91            279,950                       3             3.3                219,900                     88               96.7           288,250
Jun-10                           83            275,000                       4             4.8                288,000                     79               95.2           275,000
May-10                           82            299,925                       1             1.2                383,675                     81               98.8           299,900
Apr-10                          137            290,000                       2             1.5                332,450                   135                98.5           290,000
Mar-10                           91            294,950                       1             1.1                339,900                     90               98.9           294,125
Feb-10                           91            299,000                       2             2.2                200,150                     89               97.8           299,950
Jan-10                           71            274,900                       0                                                            71             100.0            274,900
Dec-09                           41            299,990                       4             9.8                272,400                     37               90.2           305,000
Nov-09                           44            282,000                       1             2.3                250,000                     43               97.7           285,000
Oct-09                           52            304,500                       1             1.9                352,900                     51               98.1           300,000
Sep-09                           57            275,000                       2             3.5                252,450                     55               96.5           275,000
Aug-09                           73            279,900                       3             4.1                305,000                     70               95.9           278,450
Jul-09                           88            272,250                       3             3.4                249,900                     85               96.6           275,000
Jun-09                           90            287,000                       0                                                            90             100.0            287,000
May-09                           97            285,000                       4             4.1                342,450                     93               95.9           285,000
Apr-09                           76            288,750                       3             4.0                262,105                     73               96.0           290,000
Mar-09                           98            311,500                       5             5.1                273,900                     93               94.9           316,000
Feb-09                           59            289,000                       2             3.4                229,950                     57               96.6           289,500
Jan-09                           59            299,900                       4             6.8                274,550                     55               93.2           299,900
Dec-08                           36            288,900                       6            16.7                277,900                     30               83.3           322,000


Clarus MarketMetrics®                                                                            2 of 2                                                                               01/18/2011
                                       Information not guaranteed. © 2009-2010 Terradatum and its suppliers and licensors (www.terradatum.com/about/licensors.td).


              www.TaylorRealEstateAustin.com | www.EarlyBirdAustin.com | Direct: 512.796.4447 | Fax: 512.628.7720 | 1701 Spyglass Dr. Ste. 8 Austin, TX 78746
                                                                                                     10 of 20
Blake Taylor                                                                                                                                                                         Austin Board of REALTORS
                                                                            For Sale Properties by Month
                                                        Dec-08 vs. Dec-10: The number of For Sale properties is down 25%


                                                                                  Dec-08 vs. Dec-10
                   Dec-08                                               Dec-10                                     Change                                               %
                    241                                                  181                                         -60                                              -25%


MLS: ACTRIS        Period:   2 years (monthly)           Price:   All                        Construction Type:    All             Bedrooms:    All            Bathrooms:      All         Lot Size: All
Property Types:    Residential: (House, Condo, Townhouse, Manufactured, Half Duplex, Mobile Home, Loft, Residential - Unknown)                                                             Sq Ft:    All
MLS Areas:         SWW


Clarus MarketMetrics®                                                                                     1 of 2                                                                                           01/18/2011
                                                 Information not guaranteed. © 2009-2010 Terradatum and its suppliers and licensors (www.terradatum.com/about/licensors.td).


                  www.TaylorRealEstateAustin.com | www.EarlyBirdAustin.com | Direct: 512.796.4447 | Fax: 512.628.7720 | 1701 Spyglass Dr. Ste. 8 Austin, TX 78746
                                                                                                         11 of 20
Blake Taylor                                                                                                                                                          Austin Board of REALTORS
                                                                  For Sale Properties by Month
                                               Dec-08 vs. Dec-10: The number of For Sale properties is down 25%


                                       Full Market                                                Bank Properties                                            Non-Bank Properties
Time Period             # Properties      Median Price         Average DOM              # Properties         % Bank            Median Price           # Properties    % Non-Bank   Median Price
Dec-10                          181             279,900                    107                      7             3.9               294,900                     174         96.1       279,900
Nov-10                          205             284,900                    112                      6             2.9               311,450                     199         97.1       283,400
Oct-10                          229             295,950                    125                      7             3.1               250,000                     222         96.9       299,000
Sep-10                          259             295,950                    129                     11             4.2               250,000                     248         95.8       299,000
Aug-10                          288             289,700                    129                     13             4.5               244,900                     275         95.5       295,000
Jul-10                          312             299,900                    129                     13             4.2               244,900                     299         95.8       299,950
Jun-10                          310             299,900                    121                     10             3.2               250,000                     300         96.8       299,900
May-10                          296             300,000                    119                      7             2.4               250,000                     289         97.6       300,000
Apr-10                          320             299,994                    106                      8             2.5               294,950                     312         97.5       299,994
Mar-10                          262             299,995                    113                      8             3.0               277,500                     254         97.0       299,995
Feb-10                          223             295,000                    118                      8             3.6               247,450                     215         96.4       298,900
Jan-10                          190             292,250                    127                      7             3.7               305,000                     183         96.3       289,999
Dec-09                          178             299,945                    142                      8             4.5               302,450                     170         95.5       299,945
Nov-09                          193             299,900                    134                      6             3.1               277,500                     187         96.9       299,900
Oct-09                          220             303,750                    131                      7             3.2               350,000                     213         96.8       300,000
Sep-09                          257             299,900                    126                      8             3.1               312,500                     249         96.9       299,900
Aug-09                          285             299,900                    121                      9             3.2               335,000                     276         96.8       299,900
Jul-09                          297             305,000                    117                      8             2.7               327,500                     289         97.3       304,900
Jun-09                          289             309,000                    119                      9             3.1               330,000                     280         96.9       309,000
May-09                          293             309,000                    116                     11             3.8               299,000                     282         96.2       309,000
Apr-09                          275             309,500                    125                     12             4.4               286,950                     263         95.6       310,000
Mar-09                          283             299,950                    122                     15             5.3               275,900                     268         94.7       309,900
Feb-09                          233             299,900                    138                     14             6.0               267,450                     219         94.0       299,900
Jan-09                          231             299,900                    139                     16             6.9               275,450                     215         93.1       301,925
Dec-08                          241             309,900                    151                     12             5.0               275,450                     229         95.0       310,000


Clarus MarketMetrics®                                                                            2 of 2                                                                                  01/18/2011
                                        Information not guaranteed. © 2009-2010 Terradatum and its suppliers and licensors (www.terradatum.com/about/licensors.td).


              www.TaylorRealEstateAustin.com | www.EarlyBirdAustin.com | Direct: 512.796.4447 | Fax: 512.628.7720 | 1701 Spyglass Dr. Ste. 8 Austin, TX 78746
                                                                                                     12 of 20
Blake Taylor                                                                                                                                                                         Austin Board of REALTORS
                                                                            Expired Properties by Month
                                                        Dec-08 vs. Dec-10: The number of Expired properties is down 43%


                                                                                  Dec-08 vs. Dec-10
                   Dec-08                                               Dec-10                                     Change                                               %
                     44                                                   25                                         -19                                              -43%


MLS: ACTRIS        Period:   2 years (monthly)           Price:   All                        Construction Type:    All             Bedrooms:    All            Bathrooms:      All         Lot Size: All
Property Types:    Residential: (House, Condo, Townhouse, Manufactured, Half Duplex, Mobile Home, Loft, Residential - Unknown)                                                             Sq Ft:    All
MLS Areas:         SWW


Clarus MarketMetrics®                                                                                     1 of 2                                                                                           01/18/2011
                                                 Information not guaranteed. © 2009-2010 Terradatum and its suppliers and licensors (www.terradatum.com/about/licensors.td).


                  www.TaylorRealEstateAustin.com | www.EarlyBirdAustin.com | Direct: 512.796.4447 | Fax: 512.628.7720 | 1701 Spyglass Dr. Ste. 8 Austin, TX 78746
                                                                                                         13 of 20
Blake Taylor                                                                                                                                                          Austin Board of REALTORS
                                                                   Expired Properties by Month
                                               Dec-08 vs. Dec-10: The number of Expired properties is down 43%


                                       Full Market                                                Bank Properties                                            Non-Bank Properties
Time Period             # Properties      Median Price         Average DOM             # Properties          % Bank           Median Price           # Properties     % Non-Bank   Median Price
Dec-10                           25             283,400                    108                      0                                                            25        100.0       283,400
Nov-10                           26             299,000                     98                      1             3.9               276,900                      25         96.2       299,000
Oct-10                           38             297,000                    137                      5            13.2               235,000                      33         86.8       319,000
Sep-10                           30             322,200                    107                      2             6.7               263,000                      28         93.3       322,200
Aug-10                           34             277,000                    111                      2             5.9               207,400                      32         94.1       279,400
Jul-10                           27             316,500                    129                      1             3.7               244,900                      26         96.3       320,750
Jun-10                           30             319,000                     90                      0                                                            30        100.0       319,000
May-10                           17             299,100                     61                      0                                                            17        100.0       299,100
Apr-10                           25             324,950                    109                      1             4.0               475,000                      24         96.0       321,975
Mar-10                           17             324,900                    120                      0                                                            17        100.0       324,900
Feb-10                            9             250,000                     56                      0                                                             9        100.0       250,000
Jan-10                           14             284,750                    129                      0                                                            14        100.0       284,750
Dec-09                           35             319,900                     90                      0                                                            35        100.0       319,900
Nov-09                           24             340,000                    108                      0                                                            24        100.0       340,000
Oct-09                           20             329,000                    103                      1             5.0               350,000                      19         95.0       325,000
Sep-09                           22             326,998                    132                      0                                                            22        100.0       326,998
Aug-09                           22             294,950                     86                      1             4.5               349,900                      21         95.5       290,000
Jul-09                           24             321,995                     90                      2             8.3               304,500                      22         91.7       324,445
Jun-09                           23             329,900                     81                      2             8.7               289,950                      21         91.3       329,900
May-09                           18             326,972                     77                      1             5.6               299,000                      17         94.4       329,000
Apr-09                           18             288,950                    100                      1             5.6               275,900                      17         94.4       290,000
Mar-09                           25             299,950                     92                      2             8.0               282,450                      23         92.0       310,000
Feb-09                           13             249,900                    123                      1             7.7               234,900                      12         92.3       249,950
Jan-09                           20             304,950                    117                      1             5.0               215,000                      19         95.0       309,900
Dec-08                           44             350,950                    143                      0                                                            44        100.0       350,950


Clarus MarketMetrics®                                                                            2 of 2                                                                                   01/18/2011
                                        Information not guaranteed. © 2009-2010 Terradatum and its suppliers and licensors (www.terradatum.com/about/licensors.td).


              www.TaylorRealEstateAustin.com | www.EarlyBirdAustin.com | Direct: 512.796.4447 | Fax: 512.628.7720 | 1701 Spyglass Dr. Ste. 8 Austin, TX 78746
                                                                                                     14 of 20
Blake Taylor                                                                                                                                                                          Austin Board of REALTORS
                                                                                Supply & Demand by Month
                   Dec-08 vs. Dec-10: The number of for sale properties is down 25% and the number of sold properties is up 30%


                             Dec-08 vs. Dec-10                                                                                                                       Dec-08 vs. Dec-10
     Dec-08              Dec-10               Change                       %                                                                    Dec-08              Dec-10               Change              %
      241                 181                   -60                      -25%                                                                     33                  43                   10               +30%


MLS: ACTRIS        Period:    2 years (monthly)           Price:   All                        Construction Type:    All             Bedrooms:    All            Bathrooms:      All         Lot Size: All
Property Types:    Residential: (House, Condo, Townhouse, Manufactured, Half Duplex, Mobile Home, Loft, Residential - Unknown)                                                              Sq Ft:    All
MLS Areas:         SWW


Clarus MarketMetrics®                                                                                      1 of 2                                                                                            01/18/2011
                                                  Information not guaranteed. © 2009-2010 Terradatum and its suppliers and licensors (www.terradatum.com/about/licensors.td).


                  www.TaylorRealEstateAustin.com | www.EarlyBirdAustin.com | Direct: 512.796.4447 | Fax: 512.628.7720 | 1701 Spyglass Dr. Ste. 8 Austin, TX 78746
                                                                                                         15 of 20
Blake Taylor                                                                                                                                                           Austin Board of REALTORS
                                                                     Supply & Demand by Month
                Dec-08 vs. Dec-10: The number of for sale properties is down 25% and the number of sold properties is up 30%

                          # Properties              Average DOM                    # Properties               Average DOM
Time Period                   For Sale                   For Sale                         Sold                        Sold
Dec-10                            181                            107                           43                          57
Nov-10                            205                            112                           35                          78
Oct-10                            229                            125                           39                          83
Sep-10                            259                            129                           40                          65
Aug-10                            288                            129                           39                          60
Jul-10                            312                            129                           58                          42
Jun-10                            310                            121                           61                          41
May-10                            296                            119                           84                          38
Apr-10                            320                            106                           61                          37
Mar-10                            262                            113                           48                          44
Feb-10                            223                            118                           40                          56
Jan-10                            190                            127                           15                          89
Dec-09                            178                            142                           45                          88
Nov-09                            193                            134                           42                          62
Oct-09                            220                            131                           61                          53
Sep-09                            257                            126                           65                          57
Aug-09                            285                            121                           59                          64
Jul-09                            297                            117                           70                          54
Jun-09                            289                            119                           67                          64
May-09                            293                            116                           67                          74
Apr-09                            275                            125                           54                          56
Mar-09                            283                            122                           41                          71
Feb-09                            233                            138                           29                          69
Jan-09                            231                            139                           19                          71
Dec-08                            241                            151                           33                          76


Clarus MarketMetrics®                                                                               2 of 2                                                                              01/18/2011
                                         Information not guaranteed. © 2009-2010 Terradatum and its suppliers and licensors (www.terradatum.com/about/licensors.td).


              www.TaylorRealEstateAustin.com | www.EarlyBirdAustin.com | Direct: 512.796.4447 | Fax: 512.628.7720 | 1701 Spyglass Dr. Ste. 8 Austin, TX 78746
                                                                                                     16 of 20
Blake Taylor                                                                                                                                                                         Austin Board of REALTORS
                                                                  The Average Days on Market by Month
                                                               Dec-08 vs. Dec-10: The average days on market is up 18%


                                                                                  Dec-08 vs. Dec-10
                   Dec-08                                               Dec-10                                     Change                                             %
                     80                                                   94                                         14                                              +18%


MLS: ACTRIS        Period:   2 years (monthly)           Price:   All                        Construction Type:    All             Bedrooms:    All            Bathrooms:      All         Lot Size: All
Property Types:    Residential: (House, Condo, Townhouse, Manufactured, Half Duplex, Mobile Home, Loft, Residential - Unknown)                                                             Sq Ft:    All
MLS Areas:         SWW


Clarus MarketMetrics®                                                                                     1 of 2                                                                                           01/18/2011
                                                 Information not guaranteed. © 2009-2010 Terradatum and its suppliers and licensors (www.terradatum.com/about/licensors.td).


                  www.TaylorRealEstateAustin.com | www.EarlyBirdAustin.com | Direct: 512.796.4447 | Fax: 512.628.7720 | 1701 Spyglass Dr. Ste. 8 Austin, TX 78746
                                                                                                         17 of 20
Blake Taylor                                                                                                                                                        Austin Board of REALTORS
                                                     The Average Days on Market by Month
                                                    Dec-08 vs. Dec-10: The average days on market is up 18%


Time Period             Average DOM      # UC Units
Dec-10                           94                39
Nov-10                           53                37
Oct-10                           72                38
Sep-10                           87                45
Aug-10                           65                39
Jul-10                           52                44
Jun-10                           42                59
May-10                           42                52
Apr-10                           34                81
Mar-10                           43                62
Feb-10                           42                43
Jan-10                           43                44
Dec-09                          118                24
Nov-09                           53                32
Oct-09                           82                51
Sep-09                           53                67
Aug-09                           56                63
Jul-09                           57                61
Jun-09                           58                57
May-09                           62                76
Apr-09                           71                61
Mar-09                           60                59
Feb-09                           79                35
Jan-09                           66                37
Dec-08                           80                25


Clarus MarketMetrics®                                                                          2 of 2                                                                                01/18/2011
                                      Information not guaranteed. © 2009-2010 Terradatum and its suppliers and licensors (www.terradatum.com/about/licensors.td).


              www.TaylorRealEstateAustin.com | www.EarlyBirdAustin.com | Direct: 512.796.4447 | Fax: 512.628.7720 | 1701 Spyglass Dr. Ste. 8 Austin, TX 78746
                                                                                                     18 of 20
Blake Taylor                                                                                                                                                                         Austin Board of REALTORS
                                                                             Months Supply of Inventory
                                                  Dec-08 vs. Dec-10: The average months supply of inventory is down 56%


                                                                                  Dec-08 vs. Dec-10
                   Dec-08                                               Dec-10                                     Change                                              %
                    6.9                                                  3.0                                        -3.9                                             -56%


MLS: ACTRIS        Period:   2 years (monthly)           Price:   All                        Construction Type:    All            Bedrooms:    All             Bathrooms:      All         Lot Size: All
Property Types:    Residential: (House, Condo, Townhouse, Manufactured, Half Duplex, Mobile Home, Loft, Residential - Unknown)                                                             Sq Ft:    All
MLS Areas:         SWW


Clarus MarketMetrics®                                                                                     1 of 2                                                                                           01/18/2011
                                                 Information not guaranteed. © 2009-2010 Terradatum and its suppliers and licensors (www.terradatum.com/about/licensors.td).


                  www.TaylorRealEstateAustin.com | www.EarlyBirdAustin.com | Direct: 512.796.4447 | Fax: 512.628.7720 | 1701 Spyglass Dr. Ste. 8 Austin, TX 78746
                                                                                                         19 of 20
Blake Taylor                                                                                                                                                               Austin Board of REALTORS
                                                                         Months Supply of Inventory
                                              Dec-08 vs. Dec-10: The average months supply of inventory is down 56%

                          # Units For Sale          # UC Units                                   UC Average
Time Period             Last Day of Month         During Month                      MSI                DOM
Dec-10                      117                                 39                   3.0                       94
Nov-10                      142                                 37                   3.8                       53
Oct-10                      153                                 38                   4.0                       72
Sep-10                      184                                 45                   4.1                       87
Aug-10                      215                                 39                   5.5                       65
Jul-10                      241                                 44                   5.5                       52
Jun-10                      221                                 59                   3.7                       42
May-10                      227                                 52                   4.4                       42
Apr-10                      214                                 81                   2.6                       34
Mar-10                      183                                 62                   3.0                       43
Feb-10                      171                                 43                   4.0                       42
Jan-10                      132                                 44                   3.0                       43
Dec-09                      119                                 24                   5.0                   118
Nov-09                      137                                 32                   4.3                       53
Oct-09                      149                                 51                   2.9                       82
Sep-09                      168                                 67                   2.5                       53
Aug-09                      200                                 63                   3.2                       56
Jul-09                      212                                 61                   3.5                       57
Jun-09                      209                                 57                   3.7                       58
May-09                      199                                 76                   2.6                       62
Apr-09                      196                                 61                   3.2                       71
Mar-09                      199                                 59                   3.4                       60
Feb-09                      185                                 35                   5.3                       79
Jan-09                      174                                 37                   4.7                       66
Dec-08                      172                                 25                   6.9                       80


Clarus MarketMetrics®                                                                                 2 of 2                                                                                01/18/2011
                                             Information not guaranteed. © 2009-2010 Terradatum and its suppliers and licensors (www.terradatum.com/about/licensors.td).


              www.TaylorRealEstateAustin.com | www.EarlyBirdAustin.com | Direct: 512.796.4447 | Fax: 512.628.7720 | 1701 Spyglass Dr. Ste. 8 Austin, TX 78746
                                                                                                     20 of 20

Mais conteúdo relacionado

Mais procurados

Sww, circle c, western oaks, meridian, avana
Sww, circle c, western oaks, meridian, avanaSww, circle c, western oaks, meridian, avana
Sww, circle c, western oaks, meridian, avanaTaylor Real Estate
 
Area 1a northwest hills, highland park
Area 1a   northwest hills, highland parkArea 1a   northwest hills, highland park
Area 1a northwest hills, highland parkTaylor Real Estate
 
Murphy TX - Housing Market Report - August 2010
Murphy TX - Housing Market Report - August 2010Murphy TX - Housing Market Report - August 2010
Murphy TX - Housing Market Report - August 2010Valarie Littles
 
Area 3 windsor park, delwood, mueller
Area 3   windsor park, delwood, muellerArea 3   windsor park, delwood, mueller
Area 3 windsor park, delwood, muellerTaylor Real Estate
 
Murphy TX - Housing Market Report - November 2010
Murphy TX - Housing Market Report - November 2010Murphy TX - Housing Market Report - November 2010
Murphy TX - Housing Market Report - November 2010Valarie Littles
 
Frisco TX - January 2011 - Housing Market Report
Frisco TX - January 2011 - Housing Market ReportFrisco TX - January 2011 - Housing Market Report
Frisco TX - January 2011 - Housing Market ReportValarie Littles
 
Heath TX - Feb/March 2011 - Housing Market Report
Heath TX - Feb/March 2011 - Housing Market ReportHeath TX - Feb/March 2011 - Housing Market Report
Heath TX - Feb/March 2011 - Housing Market ReportValarie Littles
 
Heath TX - January 2011 - Housing Market Report
Heath TX - January 2011 - Housing Market ReportHeath TX - January 2011 - Housing Market Report
Heath TX - January 2011 - Housing Market ReportValarie Littles
 
2 n, scofield farms, gracy farms, quail creek, lamplight village metrics
2 n, scofield farms, gracy farms, quail creek, lamplight village metrics2 n, scofield farms, gracy farms, quail creek, lamplight village metrics
2 n, scofield farms, gracy farms, quail creek, lamplight village metricsTaylor Real Estate
 
6,7, 78704, travis heights, bouldin creek, barton hills
6,7, 78704, travis heights, bouldin creek, barton hills6,7, 78704, travis heights, bouldin creek, barton hills
6,7, 78704, travis heights, bouldin creek, barton hillsTaylor Real Estate
 
Windsor Park, Delwood, Mueller
Windsor Park, Delwood, MuellerWindsor Park, Delwood, Mueller
Windsor Park, Delwood, MuellerTaylor Real Estate
 
Allen TX - Feb/March 2011 - Housing Market Report
Allen TX - Feb/March 2011 - Housing Market ReportAllen TX - Feb/March 2011 - Housing Market Report
Allen TX - Feb/March 2011 - Housing Market ReportValarie Littles
 
2, allandale, crestview, brentwood metrics
2, allandale, crestview, brentwood metrics2, allandale, crestview, brentwood metrics
2, allandale, crestview, brentwood metricsTaylor Real Estate
 

Mais procurados (20)

Sww, circle c, western oaks, meridian, avana
Sww, circle c, western oaks, meridian, avanaSww, circle c, western oaks, meridian, avana
Sww, circle c, western oaks, meridian, avana
 
Area 1a northwest hills, highland park
Area 1a   northwest hills, highland parkArea 1a   northwest hills, highland park
Area 1a northwest hills, highland park
 
Central Austin Metrics
Central Austin MetricsCentral Austin Metrics
Central Austin Metrics
 
Condos Only
Condos OnlyCondos Only
Condos Only
 
Area 5 east austin
Area 5   east austinArea 5   east austin
Area 5 east austin
 
8 e, 8w, westlake metrics
8 e, 8w, westlake metrics8 e, 8w, westlake metrics
8 e, 8w, westlake metrics
 
Murphy TX - Housing Market Report - August 2010
Murphy TX - Housing Market Report - August 2010Murphy TX - Housing Market Report - August 2010
Murphy TX - Housing Market Report - August 2010
 
Area 3 windsor park, delwood, mueller
Area 3   windsor park, delwood, muellerArea 3   windsor park, delwood, mueller
Area 3 windsor park, delwood, mueller
 
Murphy TX - Housing Market Report - November 2010
Murphy TX - Housing Market Report - November 2010Murphy TX - Housing Market Report - November 2010
Murphy TX - Housing Market Report - November 2010
 
Frisco TX - January 2011 - Housing Market Report
Frisco TX - January 2011 - Housing Market ReportFrisco TX - January 2011 - Housing Market Report
Frisco TX - January 2011 - Housing Market Report
 
1 b, old west austin metrics
1 b, old west austin metrics1 b, old west austin metrics
1 b, old west austin metrics
 
Dt, downtown austin metrics
Dt, downtown austin metricsDt, downtown austin metrics
Dt, downtown austin metrics
 
Heath TX - Feb/March 2011 - Housing Market Report
Heath TX - Feb/March 2011 - Housing Market ReportHeath TX - Feb/March 2011 - Housing Market Report
Heath TX - Feb/March 2011 - Housing Market Report
 
Heath TX - January 2011 - Housing Market Report
Heath TX - January 2011 - Housing Market ReportHeath TX - January 2011 - Housing Market Report
Heath TX - January 2011 - Housing Market Report
 
2 n, scofield farms, gracy farms, quail creek, lamplight village metrics
2 n, scofield farms, gracy farms, quail creek, lamplight village metrics2 n, scofield farms, gracy farms, quail creek, lamplight village metrics
2 n, scofield farms, gracy farms, quail creek, lamplight village metrics
 
6,7, 78704, travis heights, bouldin creek, barton hills
6,7, 78704, travis heights, bouldin creek, barton hills6,7, 78704, travis heights, bouldin creek, barton hills
6,7, 78704, travis heights, bouldin creek, barton hills
 
Windsor Park, Delwood, Mueller
Windsor Park, Delwood, MuellerWindsor Park, Delwood, Mueller
Windsor Park, Delwood, Mueller
 
Allen TX - Feb/March 2011 - Housing Market Report
Allen TX - Feb/March 2011 - Housing Market ReportAllen TX - Feb/March 2011 - Housing Market Report
Allen TX - Feb/March 2011 - Housing Market Report
 
2, allandale, crestview, brentwood metrics
2, allandale, crestview, brentwood metrics2, allandale, crestview, brentwood metrics
2, allandale, crestview, brentwood metrics
 
5, east austin metrics
5, east austin metrics5, east austin metrics
5, east austin metrics
 

Semelhante a Area sww village of western oaks, circle c

Semelhante a Area sww village of western oaks, circle c (15)

Areas 10N, 10S South Austin
Areas 10N, 10S   South AustinAreas 10N, 10S   South Austin
Areas 10N, 10S South Austin
 
Central austin metrics
Central austin metricsCentral austin metrics
Central austin metrics
 
Westlake Metrics
Westlake MetricsWestlake Metrics
Westlake Metrics
 
NW Hills, Highland Park Metrics
NW Hills, Highland Park MetricsNW Hills, Highland Park Metrics
NW Hills, Highland Park Metrics
 
4, hyde park, rosedale metrics
4, hyde park, rosedale metrics4, hyde park, rosedale metrics
4, hyde park, rosedale metrics
 
1 n, jester, lakewood metrics
1 n, jester, lakewood metrics1 n, jester, lakewood metrics
1 n, jester, lakewood metrics
 
Ls, lakeway, bee cave metrics
Ls, lakeway, bee cave metricsLs, lakeway, bee cave metrics
Ls, lakeway, bee cave metrics
 
3, windsor park, delwood, mueller
3, windsor park, delwood, mueller3, windsor park, delwood, mueller
3, windsor park, delwood, mueller
 
W Metrics
W MetricsW Metrics
W Metrics
 
10 n, 10s, south austin metrics
10 n, 10s, south austin metrics10 n, 10s, south austin metrics
10 n, 10s, south austin metrics
 
Ut metrics
Ut metricsUt metrics
Ut metrics
 
Condos only metrics
Condos only metricsCondos only metrics
Condos only metrics
 
1 a, nw hills, highland park, cat mountain
1 a, nw hills, highland park, cat mountain1 a, nw hills, highland park, cat mountain
1 a, nw hills, highland park, cat mountain
 
Rn, steiner ranch, river place metrics
Rn, steiner ranch, river place metricsRn, steiner ranch, river place metrics
Rn, steiner ranch, river place metrics
 
Frisco TX - Housing Market Report - November 2010
Frisco TX - Housing Market Report - November 2010Frisco TX - Housing Market Report - November 2010
Frisco TX - Housing Market Report - November 2010
 

Area sww village of western oaks, circle c

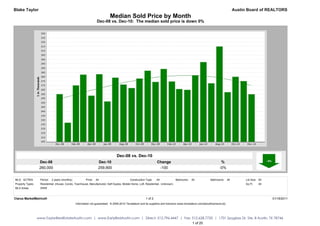
  • 1. Blake Taylor Austin Board of REALTORS Median Sold Price by Month Dec-08 vs. Dec-10: The median sold price is down 0% Dec-08 vs. Dec-10 Dec-08 Dec-10 Change % 260,000 259,900 -100 -0% MLS: ACTRIS Period: 2 years (monthly) Price: All Construction Type: All Bedrooms: All Bathrooms: All Lot Size: All Property Types: Residential: (House, Condo, Townhouse, Manufactured, Half Duplex, Mobile Home, Loft, Residential - Unknown) Sq Ft: All MLS Areas: SWW Clarus MarketMetrics® 1 of 2 01/18/2011 Information not guaranteed. © 2009-2010 Terradatum and its suppliers and licensors (www.terradatum.com/about/licensors.td). www.TaylorRealEstateAustin.com | www.EarlyBirdAustin.com | Direct: 512.796.4447 | Fax: 512.628.7720 | 1701 Spyglass Dr. Ste. 8 Austin, TX 78746 1 of 20
  • 2. Blake Taylor Austin Board of REALTORS Median Sold Price by Month Dec-08 vs. Dec-10: The median sold price is down 0% Time Period Median Price # Units Average DOM Dec-10 259,900 43 57 Nov-10 275,000 35 78 Oct-10 280,000 39 83 Sep-10 262,250 40 65 Aug-10 315,000 39 60 Jul-10 272,500 58 42 Jun-10 297,000 61 41 May-10 281,750 84 38 Apr-10 264,900 61 37 Mar-10 265,850 48 44 Feb-10 274,500 40 56 Jan-10 289,000 15 89 Dec-09 274,000 45 88 Nov-09 287,000 42 62 Oct-09 278,000 61 53 Sep-09 267,000 65 57 Aug-09 271,000 59 64 Jul-09 279,000 70 54 Jun-09 251,500 67 64 May-09 283,000 67 74 Apr-09 258,250 54 56 Mar-09 282,500 41 71 Feb-09 270,000 29 69 Jan-09 227,000 19 71 Dec-08 260,000 33 76 Clarus MarketMetrics® 2 of 2 01/18/2011 Information not guaranteed. © 2009-2010 Terradatum and its suppliers and licensors (www.terradatum.com/about/licensors.td). www.TaylorRealEstateAustin.com | www.EarlyBirdAustin.com | Direct: 512.796.4447 | Fax: 512.628.7720 | 1701 Spyglass Dr. Ste. 8 Austin, TX 78746 2 of 20
  • 3. Blake Taylor Austin Board of REALTORS Median For Sale vs. Median Sold Dec-08 vs. Dec-10: The median price of for sale properties is down 10% and the median price of sold properties is down 0% Dec-08 vs. Dec-10 Dec-08 vs. Dec-10 Dec-08 Dec-10 Change % Dec-08 Dec-10 Change % 309,900 279,900 -30,000 -10% 260,000 259,900 -100 -0% MLS: ACTRIS Period: 2 years (monthly) Price: All Construction Type: All Bedrooms: All Bathrooms: All Lot Size: All Property Types: Residential: (House, Condo, Townhouse, Manufactured, Half Duplex, Mobile Home, Loft, Residential - Unknown) Sq Ft: All MLS Areas: SWW Clarus MarketMetrics® 1 of 2 01/18/2011 Information not guaranteed. © 2009-2010 Terradatum and its suppliers and licensors (www.terradatum.com/about/licensors.td). www.TaylorRealEstateAustin.com | www.EarlyBirdAustin.com | Direct: 512.796.4447 | Fax: 512.628.7720 | 1701 Spyglass Dr. Ste. 8 Austin, TX 78746 3 of 20
  • 4. Blake Taylor Austin Board of REALTORS Median For Sale vs. Median Sold Dec-08 vs. Dec-10: The median price of for sale properties is down 10% and the median price of sold properties is down 0% For Sale # Properties Sold # Properties Price Time Period Median For Sale Median Sold Difference Dec-10 279,900 181 259,900 43 -20,000 Nov-10 284,900 205 275,000 35 -9,900 Oct-10 295,950 229 280,000 39 -15,950 Sep-10 295,950 259 262,250 40 -33,700 Aug-10 289,700 288 315,000 39 25,300 Jul-10 299,900 312 272,500 58 -27,400 Jun-10 299,900 310 297,000 61 -2,900 May-10 300,000 296 281,750 84 -18,250 Apr-10 299,994 320 264,900 61 -35,094 Mar-10 299,995 262 265,850 48 -34,145 Feb-10 295,000 223 274,500 40 -20,500 Jan-10 292,250 190 289,000 15 -3,249 Dec-09 299,945 178 274,000 45 -25,945 Nov-09 299,900 193 287,000 42 -12,900 Oct-09 303,750 220 278,000 61 -25,750 Sep-09 299,900 257 267,000 65 -32,900 Aug-09 299,900 285 271,000 59 -28,900 Jul-09 305,000 297 279,000 70 -26,000 Jun-09 309,000 289 251,500 67 -57,500 May-09 309,000 293 283,000 67 -26,000 Apr-09 309,500 275 258,250 54 -51,250 Mar-09 299,950 283 282,500 41 -17,450 Feb-09 299,900 233 270,000 29 -29,900 Jan-09 299,900 231 227,000 19 -72,900 Dec-08 309,900 241 260,000 33 -49,900 Clarus MarketMetrics® 2 of 2 01/18/2011 Information not guaranteed. © 2009-2010 Terradatum and its suppliers and licensors (www.terradatum.com/about/licensors.td). www.TaylorRealEstateAustin.com | www.EarlyBirdAustin.com | Direct: 512.796.4447 | Fax: 512.628.7720 | 1701 Spyglass Dr. Ste. 8 Austin, TX 78746 4 of 20
  • 5. Blake Taylor Austin Board of REALTORS Sold Properties by Month Dec-08 vs. Dec-10: The number of Sold properties is up 30% Dec-08 vs. Dec-10 Dec-08 Dec-10 Change % 33 43 10 +30% MLS: ACTRIS Period: 2 years (monthly) Price: All Construction Type: All Bedrooms: All Bathrooms: All Lot Size: All Property Types: Residential: (House, Condo, Townhouse, Manufactured, Half Duplex, Mobile Home, Loft, Residential - Unknown) Sq Ft: All MLS Areas: SWW Clarus MarketMetrics® 1 of 2 01/18/2011 Information not guaranteed. © 2009-2010 Terradatum and its suppliers and licensors (www.terradatum.com/about/licensors.td). www.TaylorRealEstateAustin.com | www.EarlyBirdAustin.com | Direct: 512.796.4447 | Fax: 512.628.7720 | 1701 Spyglass Dr. Ste. 8 Austin, TX 78746 5 of 20
  • 6. Blake Taylor Austin Board of REALTORS Sold Properties by Month Dec-08 vs. Dec-10: The number of Sold properties is up 30% Full Market Bank Properties Non-Bank Properties Time Period # Properties Median Price Average DOM # Properties % Bank Median Price # Properties % Non-Bank Median Price Dec-10 43 259,900 57 0 43 100.0 259,900 Nov-10 35 275,000 78 1 2.9 253,000 34 97.1 275,500 Oct-10 39 280,000 83 0 39 100.0 280,000 Sep-10 40 262,250 65 2 5.0 282,500 38 95.0 262,250 Aug-10 39 315,000 60 1 2.6 500,000 38 97.4 310,000 Jul-10 58 272,500 42 0 58 100.0 272,500 Jun-10 61 297,000 41 1 1.6 425,000 60 98.4 295,500 May-10 84 281,750 38 2 2.4 246,375 82 97.6 281,750 Apr-10 61 264,900 37 1 1.6 311,000 60 98.4 264,600 Mar-10 48 265,850 44 1 2.1 245,000 47 97.9 267,500 Feb-10 40 274,500 56 1 2.5 352,900 39 97.5 274,000 Jan-10 15 289,000 89 0 15 100.0 289,000 Dec-09 45 274,000 88 5 11.1 290,000 40 88.9 273,550 Nov-09 42 287,000 62 0 42 100.0 287,000 Oct-09 61 278,000 53 0 61 100.0 278,000 Sep-09 65 267,000 57 4 6.2 263,532 61 93.8 267,000 Aug-09 59 271,000 64 0 59 100.0 271,000 Jul-09 70 279,000 54 1 1.4 265,000 69 98.6 280,000 Jun-09 67 251,500 64 2 3.0 268,552 65 97.0 250,500 May-09 67 283,000 74 5 7.5 300,000 62 92.5 279,450 Apr-09 54 258,250 56 4 7.4 242,500 50 92.6 271,500 Mar-09 41 282,500 71 3 7.3 240,000 38 92.7 302,500 Feb-09 29 270,000 69 1 3.5 240,000 28 96.5 271,250 Jan-09 19 227,000 71 0 19 100.0 227,000 Dec-08 33 260,000 76 1 3.0 202,000 32 97.0 270,000 Clarus MarketMetrics® 2 of 2 01/18/2011 Information not guaranteed. © 2009-2010 Terradatum and its suppliers and licensors (www.terradatum.com/about/licensors.td). www.TaylorRealEstateAustin.com | www.EarlyBirdAustin.com | Direct: 512.796.4447 | Fax: 512.628.7720 | 1701 Spyglass Dr. Ste. 8 Austin, TX 78746 6 of 20
  • 7. Blake Taylor Austin Board of REALTORS Under Contract Properties by Month Dec-08 vs. Dec-10: The number of Under Contract properties is up 56% Dec-08 vs. Dec-10 Dec-08 Dec-10 Change % 25 39 14 +56% MLS: ACTRIS Period: 2 years (monthly) Price: All Construction Type: All Bedrooms: All Bathrooms: All Lot Size: All Property Types: Residential: (House, Condo, Townhouse, Manufactured, Half Duplex, Mobile Home, Loft, Residential - Unknown) Sq Ft: All MLS Areas: SWW Clarus MarketMetrics® 1 of 2 01/18/2011 Information not guaranteed. © 2009-2010 Terradatum and its suppliers and licensors (www.terradatum.com/about/licensors.td). www.TaylorRealEstateAustin.com | www.EarlyBirdAustin.com | Direct: 512.796.4447 | Fax: 512.628.7720 | 1701 Spyglass Dr. Ste. 8 Austin, TX 78746 7 of 20
  • 8. Blake Taylor Austin Board of REALTORS Under Contract Properties by Month Dec-08 vs. Dec-10: The number of Under Contract properties is up 56% Full Market Bank Properties Non-Bank Properties Time Period # Properties Median Price Average DOM # Properties % Bank Median Price # Properties % Non-Bank Median Price Dec-10 39 274,950 94 1 2.6 234,900 38 97.4 274,975 Nov-10 37 265,000 53 0 37 100.0 265,000 Oct-10 38 282,500 72 0 38 100.0 282,500 Sep-10 45 269,000 87 2 4.4 234,950 43 95.6 269,900 Aug-10 39 279,900 65 2 5.1 452,500 37 94.9 279,900 Jul-10 44 295,992 52 0 44 100.0 295,992 Jun-10 59 275,900 42 0 59 100.0 275,900 May-10 52 299,000 42 1 1.9 383,675 51 98.1 299,000 Apr-10 81 285,000 34 1 1.2 339,900 80 98.8 282,950 Mar-10 62 264,950 43 2 3.2 231,700 60 96.8 264,950 Feb-10 43 254,900 42 1 2.3 241,900 42 97.7 254,932 Jan-10 44 296,750 43 1 2.3 352,900 43 97.7 296,000 Dec-09 24 279,000 118 1 4.2 299,900 23 95.8 259,000 Nov-09 32 262,488 53 2 6.2 209,900 30 93.8 269,988 Oct-09 51 299,900 82 1 2.0 390,000 50 98.0 294,950 Sep-09 67 289,900 53 2 3.0 309,950 65 97.0 288,000 Aug-09 63 275,000 56 2 3.2 292,450 61 96.8 275,000 Jul-09 61 278,483 57 0 61 100.0 278,483 Jun-09 57 273,900 58 2 3.5 261,950 55 96.5 279,000 May-09 76 259,950 62 1 1.3 262,105 75 98.7 259,900 Apr-09 61 284,900 71 4 6.6 301,950 57 93.4 282,500 Mar-09 59 274,900 60 4 6.8 253,500 55 93.2 275,000 Feb-09 35 269,999 79 3 8.6 224,900 32 91.4 294,450 Jan-09 37 284,983 66 3 8.1 279,900 34 91.9 289,942 Dec-08 25 225,000 80 0 25 100.0 225,000 Clarus MarketMetrics® 2 of 2 01/18/2011 Information not guaranteed. © 2009-2010 Terradatum and its suppliers and licensors (www.terradatum.com/about/licensors.td). www.TaylorRealEstateAustin.com | www.EarlyBirdAustin.com | Direct: 512.796.4447 | Fax: 512.628.7720 | 1701 Spyglass Dr. Ste. 8 Austin, TX 78746 8 of 20
  • 9. Blake Taylor Austin Board of REALTORS New Properties by Month Dec-08 vs. Dec-10: The number of New properties is up 8% Dec-08 vs. Dec-10 Dec-08 Dec-10 Change % 36 39 3 +8% MLS: ACTRIS Period: 2 years (monthly) Price: All Construction Type: All Bedrooms: All Bathrooms: All Lot Size: All Property Types: Residential: (House, Condo, Townhouse, Manufactured, Half Duplex, Mobile Home, Loft, Residential - Unknown) Sq Ft: All MLS Areas: SWW Clarus MarketMetrics® 1 of 2 01/18/2011 Information not guaranteed. © 2009-2010 Terradatum and its suppliers and licensors (www.terradatum.com/about/licensors.td). www.TaylorRealEstateAustin.com | www.EarlyBirdAustin.com | Direct: 512.796.4447 | Fax: 512.628.7720 | 1701 Spyglass Dr. Ste. 8 Austin, TX 78746 9 of 20
  • 10. Blake Taylor Austin Board of REALTORS New Properties by Month Dec-08 vs. Dec-10: The number of New properties is up 8% Full Market Bank Properties Non-Bank Properties Time Period # Properties Median Price # Properties % Bank Median Price # Properties % Non-Bank Median Price Dec-10 39 255,000 2 5.1 227,400 37 94.9 259,500 Nov-10 52 269,900 4 7.7 311,450 48 92.3 264,950 Oct-10 45 285,000 0 45 100.0 285,000 Sep-10 44 296,500 2 4.5 288,400 42 95.5 296,500 Aug-10 47 269,900 1 2.1 200,000 46 97.9 269,950 Jul-10 91 279,950 3 3.3 219,900 88 96.7 288,250 Jun-10 83 275,000 4 4.8 288,000 79 95.2 275,000 May-10 82 299,925 1 1.2 383,675 81 98.8 299,900 Apr-10 137 290,000 2 1.5 332,450 135 98.5 290,000 Mar-10 91 294,950 1 1.1 339,900 90 98.9 294,125 Feb-10 91 299,000 2 2.2 200,150 89 97.8 299,950 Jan-10 71 274,900 0 71 100.0 274,900 Dec-09 41 299,990 4 9.8 272,400 37 90.2 305,000 Nov-09 44 282,000 1 2.3 250,000 43 97.7 285,000 Oct-09 52 304,500 1 1.9 352,900 51 98.1 300,000 Sep-09 57 275,000 2 3.5 252,450 55 96.5 275,000 Aug-09 73 279,900 3 4.1 305,000 70 95.9 278,450 Jul-09 88 272,250 3 3.4 249,900 85 96.6 275,000 Jun-09 90 287,000 0 90 100.0 287,000 May-09 97 285,000 4 4.1 342,450 93 95.9 285,000 Apr-09 76 288,750 3 4.0 262,105 73 96.0 290,000 Mar-09 98 311,500 5 5.1 273,900 93 94.9 316,000 Feb-09 59 289,000 2 3.4 229,950 57 96.6 289,500 Jan-09 59 299,900 4 6.8 274,550 55 93.2 299,900 Dec-08 36 288,900 6 16.7 277,900 30 83.3 322,000 Clarus MarketMetrics® 2 of 2 01/18/2011 Information not guaranteed. © 2009-2010 Terradatum and its suppliers and licensors (www.terradatum.com/about/licensors.td). www.TaylorRealEstateAustin.com | www.EarlyBirdAustin.com | Direct: 512.796.4447 | Fax: 512.628.7720 | 1701 Spyglass Dr. Ste. 8 Austin, TX 78746 10 of 20
  • 11. Blake Taylor Austin Board of REALTORS For Sale Properties by Month Dec-08 vs. Dec-10: The number of For Sale properties is down 25% Dec-08 vs. Dec-10 Dec-08 Dec-10 Change % 241 181 -60 -25% MLS: ACTRIS Period: 2 years (monthly) Price: All Construction Type: All Bedrooms: All Bathrooms: All Lot Size: All Property Types: Residential: (House, Condo, Townhouse, Manufactured, Half Duplex, Mobile Home, Loft, Residential - Unknown) Sq Ft: All MLS Areas: SWW Clarus MarketMetrics® 1 of 2 01/18/2011 Information not guaranteed. © 2009-2010 Terradatum and its suppliers and licensors (www.terradatum.com/about/licensors.td). www.TaylorRealEstateAustin.com | www.EarlyBirdAustin.com | Direct: 512.796.4447 | Fax: 512.628.7720 | 1701 Spyglass Dr. Ste. 8 Austin, TX 78746 11 of 20
  • 12. Blake Taylor Austin Board of REALTORS For Sale Properties by Month Dec-08 vs. Dec-10: The number of For Sale properties is down 25% Full Market Bank Properties Non-Bank Properties Time Period # Properties Median Price Average DOM # Properties % Bank Median Price # Properties % Non-Bank Median Price Dec-10 181 279,900 107 7 3.9 294,900 174 96.1 279,900 Nov-10 205 284,900 112 6 2.9 311,450 199 97.1 283,400 Oct-10 229 295,950 125 7 3.1 250,000 222 96.9 299,000 Sep-10 259 295,950 129 11 4.2 250,000 248 95.8 299,000 Aug-10 288 289,700 129 13 4.5 244,900 275 95.5 295,000 Jul-10 312 299,900 129 13 4.2 244,900 299 95.8 299,950 Jun-10 310 299,900 121 10 3.2 250,000 300 96.8 299,900 May-10 296 300,000 119 7 2.4 250,000 289 97.6 300,000 Apr-10 320 299,994 106 8 2.5 294,950 312 97.5 299,994 Mar-10 262 299,995 113 8 3.0 277,500 254 97.0 299,995 Feb-10 223 295,000 118 8 3.6 247,450 215 96.4 298,900 Jan-10 190 292,250 127 7 3.7 305,000 183 96.3 289,999 Dec-09 178 299,945 142 8 4.5 302,450 170 95.5 299,945 Nov-09 193 299,900 134 6 3.1 277,500 187 96.9 299,900 Oct-09 220 303,750 131 7 3.2 350,000 213 96.8 300,000 Sep-09 257 299,900 126 8 3.1 312,500 249 96.9 299,900 Aug-09 285 299,900 121 9 3.2 335,000 276 96.8 299,900 Jul-09 297 305,000 117 8 2.7 327,500 289 97.3 304,900 Jun-09 289 309,000 119 9 3.1 330,000 280 96.9 309,000 May-09 293 309,000 116 11 3.8 299,000 282 96.2 309,000 Apr-09 275 309,500 125 12 4.4 286,950 263 95.6 310,000 Mar-09 283 299,950 122 15 5.3 275,900 268 94.7 309,900 Feb-09 233 299,900 138 14 6.0 267,450 219 94.0 299,900 Jan-09 231 299,900 139 16 6.9 275,450 215 93.1 301,925 Dec-08 241 309,900 151 12 5.0 275,450 229 95.0 310,000 Clarus MarketMetrics® 2 of 2 01/18/2011 Information not guaranteed. © 2009-2010 Terradatum and its suppliers and licensors (www.terradatum.com/about/licensors.td). www.TaylorRealEstateAustin.com | www.EarlyBirdAustin.com | Direct: 512.796.4447 | Fax: 512.628.7720 | 1701 Spyglass Dr. Ste. 8 Austin, TX 78746 12 of 20
  • 13. Blake Taylor Austin Board of REALTORS Expired Properties by Month Dec-08 vs. Dec-10: The number of Expired properties is down 43% Dec-08 vs. Dec-10 Dec-08 Dec-10 Change % 44 25 -19 -43% MLS: ACTRIS Period: 2 years (monthly) Price: All Construction Type: All Bedrooms: All Bathrooms: All Lot Size: All Property Types: Residential: (House, Condo, Townhouse, Manufactured, Half Duplex, Mobile Home, Loft, Residential - Unknown) Sq Ft: All MLS Areas: SWW Clarus MarketMetrics® 1 of 2 01/18/2011 Information not guaranteed. © 2009-2010 Terradatum and its suppliers and licensors (www.terradatum.com/about/licensors.td). www.TaylorRealEstateAustin.com | www.EarlyBirdAustin.com | Direct: 512.796.4447 | Fax: 512.628.7720 | 1701 Spyglass Dr. Ste. 8 Austin, TX 78746 13 of 20
  • 14. Blake Taylor Austin Board of REALTORS Expired Properties by Month Dec-08 vs. Dec-10: The number of Expired properties is down 43% Full Market Bank Properties Non-Bank Properties Time Period # Properties Median Price Average DOM # Properties % Bank Median Price # Properties % Non-Bank Median Price Dec-10 25 283,400 108 0 25 100.0 283,400 Nov-10 26 299,000 98 1 3.9 276,900 25 96.2 299,000 Oct-10 38 297,000 137 5 13.2 235,000 33 86.8 319,000 Sep-10 30 322,200 107 2 6.7 263,000 28 93.3 322,200 Aug-10 34 277,000 111 2 5.9 207,400 32 94.1 279,400 Jul-10 27 316,500 129 1 3.7 244,900 26 96.3 320,750 Jun-10 30 319,000 90 0 30 100.0 319,000 May-10 17 299,100 61 0 17 100.0 299,100 Apr-10 25 324,950 109 1 4.0 475,000 24 96.0 321,975 Mar-10 17 324,900 120 0 17 100.0 324,900 Feb-10 9 250,000 56 0 9 100.0 250,000 Jan-10 14 284,750 129 0 14 100.0 284,750 Dec-09 35 319,900 90 0 35 100.0 319,900 Nov-09 24 340,000 108 0 24 100.0 340,000 Oct-09 20 329,000 103 1 5.0 350,000 19 95.0 325,000 Sep-09 22 326,998 132 0 22 100.0 326,998 Aug-09 22 294,950 86 1 4.5 349,900 21 95.5 290,000 Jul-09 24 321,995 90 2 8.3 304,500 22 91.7 324,445 Jun-09 23 329,900 81 2 8.7 289,950 21 91.3 329,900 May-09 18 326,972 77 1 5.6 299,000 17 94.4 329,000 Apr-09 18 288,950 100 1 5.6 275,900 17 94.4 290,000 Mar-09 25 299,950 92 2 8.0 282,450 23 92.0 310,000 Feb-09 13 249,900 123 1 7.7 234,900 12 92.3 249,950 Jan-09 20 304,950 117 1 5.0 215,000 19 95.0 309,900 Dec-08 44 350,950 143 0 44 100.0 350,950 Clarus MarketMetrics® 2 of 2 01/18/2011 Information not guaranteed. © 2009-2010 Terradatum and its suppliers and licensors (www.terradatum.com/about/licensors.td). www.TaylorRealEstateAustin.com | www.EarlyBirdAustin.com | Direct: 512.796.4447 | Fax: 512.628.7720 | 1701 Spyglass Dr. Ste. 8 Austin, TX 78746 14 of 20
  • 15. Blake Taylor Austin Board of REALTORS Supply & Demand by Month Dec-08 vs. Dec-10: The number of for sale properties is down 25% and the number of sold properties is up 30% Dec-08 vs. Dec-10 Dec-08 vs. Dec-10 Dec-08 Dec-10 Change % Dec-08 Dec-10 Change % 241 181 -60 -25% 33 43 10 +30% MLS: ACTRIS Period: 2 years (monthly) Price: All Construction Type: All Bedrooms: All Bathrooms: All Lot Size: All Property Types: Residential: (House, Condo, Townhouse, Manufactured, Half Duplex, Mobile Home, Loft, Residential - Unknown) Sq Ft: All MLS Areas: SWW Clarus MarketMetrics® 1 of 2 01/18/2011 Information not guaranteed. © 2009-2010 Terradatum and its suppliers and licensors (www.terradatum.com/about/licensors.td). www.TaylorRealEstateAustin.com | www.EarlyBirdAustin.com | Direct: 512.796.4447 | Fax: 512.628.7720 | 1701 Spyglass Dr. Ste. 8 Austin, TX 78746 15 of 20
  • 16. Blake Taylor Austin Board of REALTORS Supply & Demand by Month Dec-08 vs. Dec-10: The number of for sale properties is down 25% and the number of sold properties is up 30% # Properties Average DOM # Properties Average DOM Time Period For Sale For Sale Sold Sold Dec-10 181 107 43 57 Nov-10 205 112 35 78 Oct-10 229 125 39 83 Sep-10 259 129 40 65 Aug-10 288 129 39 60 Jul-10 312 129 58 42 Jun-10 310 121 61 41 May-10 296 119 84 38 Apr-10 320 106 61 37 Mar-10 262 113 48 44 Feb-10 223 118 40 56 Jan-10 190 127 15 89 Dec-09 178 142 45 88 Nov-09 193 134 42 62 Oct-09 220 131 61 53 Sep-09 257 126 65 57 Aug-09 285 121 59 64 Jul-09 297 117 70 54 Jun-09 289 119 67 64 May-09 293 116 67 74 Apr-09 275 125 54 56 Mar-09 283 122 41 71 Feb-09 233 138 29 69 Jan-09 231 139 19 71 Dec-08 241 151 33 76 Clarus MarketMetrics® 2 of 2 01/18/2011 Information not guaranteed. © 2009-2010 Terradatum and its suppliers and licensors (www.terradatum.com/about/licensors.td). www.TaylorRealEstateAustin.com | www.EarlyBirdAustin.com | Direct: 512.796.4447 | Fax: 512.628.7720 | 1701 Spyglass Dr. Ste. 8 Austin, TX 78746 16 of 20
  • 17. Blake Taylor Austin Board of REALTORS The Average Days on Market by Month Dec-08 vs. Dec-10: The average days on market is up 18% Dec-08 vs. Dec-10 Dec-08 Dec-10 Change % 80 94 14 +18% MLS: ACTRIS Period: 2 years (monthly) Price: All Construction Type: All Bedrooms: All Bathrooms: All Lot Size: All Property Types: Residential: (House, Condo, Townhouse, Manufactured, Half Duplex, Mobile Home, Loft, Residential - Unknown) Sq Ft: All MLS Areas: SWW Clarus MarketMetrics® 1 of 2 01/18/2011 Information not guaranteed. © 2009-2010 Terradatum and its suppliers and licensors (www.terradatum.com/about/licensors.td). www.TaylorRealEstateAustin.com | www.EarlyBirdAustin.com | Direct: 512.796.4447 | Fax: 512.628.7720 | 1701 Spyglass Dr. Ste. 8 Austin, TX 78746 17 of 20
  • 18. Blake Taylor Austin Board of REALTORS The Average Days on Market by Month Dec-08 vs. Dec-10: The average days on market is up 18% Time Period Average DOM # UC Units Dec-10 94 39 Nov-10 53 37 Oct-10 72 38 Sep-10 87 45 Aug-10 65 39 Jul-10 52 44 Jun-10 42 59 May-10 42 52 Apr-10 34 81 Mar-10 43 62 Feb-10 42 43 Jan-10 43 44 Dec-09 118 24 Nov-09 53 32 Oct-09 82 51 Sep-09 53 67 Aug-09 56 63 Jul-09 57 61 Jun-09 58 57 May-09 62 76 Apr-09 71 61 Mar-09 60 59 Feb-09 79 35 Jan-09 66 37 Dec-08 80 25 Clarus MarketMetrics® 2 of 2 01/18/2011 Information not guaranteed. © 2009-2010 Terradatum and its suppliers and licensors (www.terradatum.com/about/licensors.td). www.TaylorRealEstateAustin.com | www.EarlyBirdAustin.com | Direct: 512.796.4447 | Fax: 512.628.7720 | 1701 Spyglass Dr. Ste. 8 Austin, TX 78746 18 of 20
  • 19. Blake Taylor Austin Board of REALTORS Months Supply of Inventory Dec-08 vs. Dec-10: The average months supply of inventory is down 56% Dec-08 vs. Dec-10 Dec-08 Dec-10 Change % 6.9 3.0 -3.9 -56% MLS: ACTRIS Period: 2 years (monthly) Price: All Construction Type: All Bedrooms: All Bathrooms: All Lot Size: All Property Types: Residential: (House, Condo, Townhouse, Manufactured, Half Duplex, Mobile Home, Loft, Residential - Unknown) Sq Ft: All MLS Areas: SWW Clarus MarketMetrics® 1 of 2 01/18/2011 Information not guaranteed. © 2009-2010 Terradatum and its suppliers and licensors (www.terradatum.com/about/licensors.td). www.TaylorRealEstateAustin.com | www.EarlyBirdAustin.com | Direct: 512.796.4447 | Fax: 512.628.7720 | 1701 Spyglass Dr. Ste. 8 Austin, TX 78746 19 of 20
  • 20. Blake Taylor Austin Board of REALTORS Months Supply of Inventory Dec-08 vs. Dec-10: The average months supply of inventory is down 56% # Units For Sale # UC Units UC Average Time Period Last Day of Month During Month MSI DOM Dec-10 117 39 3.0 94 Nov-10 142 37 3.8 53 Oct-10 153 38 4.0 72 Sep-10 184 45 4.1 87 Aug-10 215 39 5.5 65 Jul-10 241 44 5.5 52 Jun-10 221 59 3.7 42 May-10 227 52 4.4 42 Apr-10 214 81 2.6 34 Mar-10 183 62 3.0 43 Feb-10 171 43 4.0 42 Jan-10 132 44 3.0 43 Dec-09 119 24 5.0 118 Nov-09 137 32 4.3 53 Oct-09 149 51 2.9 82 Sep-09 168 67 2.5 53 Aug-09 200 63 3.2 56 Jul-09 212 61 3.5 57 Jun-09 209 57 3.7 58 May-09 199 76 2.6 62 Apr-09 196 61 3.2 71 Mar-09 199 59 3.4 60 Feb-09 185 35 5.3 79 Jan-09 174 37 4.7 66 Dec-08 172 25 6.9 80 Clarus MarketMetrics® 2 of 2 01/18/2011 Information not guaranteed. © 2009-2010 Terradatum and its suppliers and licensors (www.terradatum.com/about/licensors.td). www.TaylorRealEstateAustin.com | www.EarlyBirdAustin.com | Direct: 512.796.4447 | Fax: 512.628.7720 | 1701 Spyglass Dr. Ste. 8 Austin, TX 78746 20 of 20