SlideShare uma empresa Scribd logo
1 de 20
Blake Taylor                                                                                                                                                                            Taylor Real Estate
                                                                            Median Sold Price by Month
                                                                  Dec-09 vs. Dec-11: The median sold price is down 7%


                                                                                 Dec-09 vs. Dec-11
                  Dec-09                                           Dec-11                                         Change                                              %
                  530,000                                          495,000                                        -35,000                                            -7%


MLS: ACTRIS       Period:   2 years (monthly)           Price:   All                        Construction Type:    All            Bedrooms:       All          Bathrooms:      All   Lot Size: All
Property Types:   Residential: (House, Condo, Townhouse, Half Duplex, Modular)                                                                                                      Sq Ft:    All
MLS Areas:        1B


Clarus MarketMetrics®                                                                                    1 of 2                                                                                     01/04/2012
                                                Information not guaranteed. © 2009-2010 Terradatum and its suppliers and licensors (www.terradatum.com/about/licensors.td).


                               www.TaylorRealEstateAustin.com                |   Direct: 512.796.4447         |   Fax: 512.628.7720          |    2525 Wallingwood Bldg. 7C Austin, TX 78746
                                                                                                                                                 1 of 20
Blake Taylor                                                                                                                                                              Taylor Real Estate
                                                                   Median Sold Price by Month
                                                          Dec-09 vs. Dec-11: The median sold price is down 7%


Time Period             Median Price            # Units       Average DOM
Dec-11                      495,000                  28                    77
Nov-11                      506,250                  22                   133
Oct-11                      490,000                  29                    58
Sep-11                      480,000                  39                    74
Aug-11                      442,000                  53                    76
Jul-11                      505,100                  37                    68
Jun-11                      525,000                  53                    87
May-11                      456,000                  61                    93
Apr-11                      533,500                  47                    59
Mar-11                      530,000                  26                   136
Feb-11                      434,000                  26                   125
Jan-11                      404,875                  26                    86
Dec-10                      470,000                  37                   126
Nov-10                      454,500                  26                    72
Oct-10                      461,250                  30                   105
Sep-10                      460,750                  22                    68
Aug-10                      565,000                  37                    91
Jul-10                      558,500                  40                    67
Jun-10                      580,000                  53                    80
May-10                      520,000                  39                    79
Apr-10                      436,000                  34                    93
Mar-10                      425,000                  36                    78
Feb-10                      520,000                  21                    66
Jan-10                      380,000                  12                    91
Dec-09                      530,000                  33                    99


Clarus MarketMetrics®                                                                           2 of 2                                                                               01/04/2012
                                       Information not guaranteed. © 2009-2010 Terradatum and its suppliers and licensors (www.terradatum.com/about/licensors.td).


                           www.TaylorRealEstateAustin.com           |   Direct: 512.796.4447         |   Fax: 512.628.7720         |    2525 Wallingwood Bldg. 7C Austin, TX 78746
                                                                                                                                       2 of 20
Blake Taylor                                                                                                                                                                               Taylor Real Estate
                                                                        Median For Sale vs. Median Sold
             Dec-09 vs. Dec-11: The median price of for sale properties is up 9% and the median price of sold properties is down 7%


                            Dec-09 vs. Dec-11                                                                                                                       Dec-09 vs. Dec-11
    Dec-09             Dec-11                Change                      %                                                                     Dec-09             Dec-11             Change             %
    587,500            639,000               51,500                     +9%                                                                    530,000            495,000            -35,000           -7%


MLS: ACTRIS       Period:    2 years (monthly)           Price:   All                        Construction Type:    All             Bedrooms:       All         Bathrooms:      All     Lot Size: All
Property Types:   Residential: (House, Condo, Townhouse, Half Duplex, Modular)                                                                                                         Sq Ft:    All
MLS Areas:        1B


Clarus MarketMetrics®                                                                                     1 of 2                                                                                        01/04/2012
                                                 Information not guaranteed. © 2009-2010 Terradatum and its suppliers and licensors (www.terradatum.com/about/licensors.td).


                                www.TaylorRealEstateAustin.com                |   Direct: 512.796.4447         |   Fax: 512.628.7720           |    2525 Wallingwood Bldg. 7C Austin, TX 78746
                                                                                                                                                   3 of 20
Blake Taylor                                                                                                                                                              Taylor Real Estate
                                                             Median For Sale vs. Median Sold
           Dec-09 vs. Dec-11: The median price of for sale properties is up 9% and the median price of sold properties is down 7%

                            For Sale                # Properties                         Sold                 # Properties                        Price
Time Period                  Median                     For Sale                       Median                        Sold                    Difference
Dec-11                      639,000                            201                    495,000                            28                    -144,000
Nov-11                      675,000                            246                    506,250                            22                    -168,750
Oct-11                      657,200                            256                    490,000                            29                    -167,200
Sep-11                      645,000                            269                    480,000                            39                    -165,000
Aug-11                      599,999                            303                    442,000                            53                    -157,999
Jul-11                      595,000                            321                    505,100                            37                     -89,900
Jun-11                      589,625                            318                    525,000                            53                     -64,625
May-11                      585,000                            307                    456,000                            61                    -129,000
Apr-11                      577,000                            320                    533,500                            47                     -43,500
Mar-11                      550,000                            308                    530,000                            26                     -19,999
Feb-11                      532,500                            241                    434,000                            26                     -98,500
Jan-11                      549,000                            258                    404,875                            26                    -144,125
Dec-10                      530,000                            267                    470,000                            37                     -60,000
Nov-10                      565,000                            321                    454,500                            26                    -110,500
Oct-10                      549,000                            356                    461,250                            30                     -87,750
Sep-10                      545,000                            379                    460,750                            22                     -84,250
Aug-10                      565,000                            399                    565,000                            37                            0
Jul-10                      590,000                            421                    558,500                            40                     -31,500
Jun-10                      595,000                            422                    580,000                            53                     -15,000
May-10                      595,000                            405                    520,000                            39                     -75,000
Apr-10                      584,000                            401                    436,000                            34                    -148,000
Mar-10                      584,000                            383                    425,000                            36                    -159,000
Feb-10                      569,900                            315                    520,000                            21                     -49,900
Jan-10                      575,000                            294                    380,000                            12                    -195,000
Dec-09                      587,500                            331                    530,000                            33                     -57,500


Clarus MarketMetrics®                                                                           2 of 2                                                                               01/04/2012
                                       Information not guaranteed. © 2009-2010 Terradatum and its suppliers and licensors (www.terradatum.com/about/licensors.td).


                        www.TaylorRealEstateAustin.com               |   Direct: 512.796.4447        |   Fax: 512.628.7720         |    2525 Wallingwood Bldg. 7C Austin, TX 78746
                                                                                                                                       4 of 20
Blake Taylor                                                                                                                                                                            Taylor Real Estate
                                                                                    Sold Properties by Month
                                                          Dec-09 vs. Dec-11: The number of Sold properties is down 15%


                                                                                    Dec-09 vs. Dec-11
                  Dec-09                                               Dec-11                                     Change                                               %
                    33                                                   28                                         -5                                               -15%


MLS: ACTRIS       Period:   2 years (monthly)           Price:   All                        Construction Type:    All             Bedrooms:       All         Bathrooms:      All   Lot Size: All
Property Types:   Residential: (House, Condo, Townhouse, Half Duplex, Modular)                                                                                                      Sq Ft:    All
MLS Areas:        1B


Clarus MarketMetrics®                                                                                    1 of 2                                                                                     01/04/2012
                                                Information not guaranteed. © 2009-2010 Terradatum and its suppliers and licensors (www.terradatum.com/about/licensors.td).


                               www.TaylorRealEstateAustin.com                   |   Direct: 512.796.4447      |   Fax: 512.628.7720           |    2525 Wallingwood Bldg. 7C Austin, TX 78746
                                                                                                                                                  5 of 20
Blake Taylor                                                                                                                                                                       Taylor Real Estate
                                                                         Sold Properties by Month
                                                  Dec-09 vs. Dec-11: The number of Sold properties is down 15%


                                       Full Market                                                Bank Properties                                            Non-Bank Properties
Time Period             # Properties      Median Price         Average DOM              # Properties          % Bank           Median Price           # Properties    % Non-Bank        Median Price
Dec-11                           28             495,000                     77                      1             3.6             1,463,400                      27         96.4            475,000
Nov-11                           22             506,250                    133                      0                                                            22        100.0            506,250
Oct-11                           29             490,000                     58                      3            10.3               180,000                      26         89.7            504,450
Sep-11                           39             480,000                     74                      1             2.6               385,000                      38         97.4            500,000
Aug-11                           53             442,000                     76                      2             3.8               837,500                      51         96.2            425,000
Jul-11                           37             505,100                     68                      0                                                            37        100.0            505,100
Jun-11                           53             525,000                     87                      0                                                            53        100.0            525,000
May-11                           61             456,000                     93                      3             4.9               306,900                      58         95.1            462,500
Apr-11                           47             533,500                     59                      4             8.5               629,500                      43         91.5            533,500
Mar-11                           26             530,000                    136                      0                                                            26        100.0            530,000
Feb-11                           26             434,000                    125                      3            11.5               144,000                      23         88.5            500,000
Jan-11                           26             404,875                     86                      6            23.1               173,750                      20         76.9            466,650
Dec-10                           37             470,000                    126                      1             2.7               390,000                      36         97.3            485,000
Nov-10                           26             454,500                     72                      1             3.9               140,000                      25         96.2            460,000
Oct-10                           30             461,250                    105                      0                                                            30        100.0            461,250
Sep-10                           22             460,750                     68                      2             9.1               167,860                      20         90.9            465,000
Aug-10                           37             565,000                     91                      2             5.4               274,000                      35         94.6            575,000
Jul-10                           40             558,500                     67                      2             5.0               831,950                      38         95.0            558,500
Jun-10                           53             580,000                     80                      3             5.7               175,800                      50         94.3            594,750
May-10                           39             520,000                     79                      2             5.1               170,000                      37         94.9            535,000
Apr-10                           34             436,000                     93                      1             2.9               150,150                      33         97.1            439,000
Mar-10                           36             425,000                     78                      8            22.2               158,204                      28         77.8            500,000
Feb-10                           21             520,000                     66                      4            19.1               141,000                      17         81.0            682,000
Jan-10                           12             380,000                     91                      3            25.0               151,500                       9         75.0            428,684
Dec-09                           33             530,000                     99                      2             6.1               146,200                      31         93.9            553,500


Clarus MarketMetrics®                                                                            2 of 2                                                                                       01/04/2012
                                        Information not guaranteed. © 2009-2010 Terradatum and its suppliers and licensors (www.terradatum.com/about/licensors.td).


                           www.TaylorRealEstateAustin.com            |   Direct: 512.796.4447           |   Fax: 512.628.7720       |    2525 Wallingwood Bldg. 7C Austin, TX 78746
                                                                                                                                        6 of 20
Blake Taylor                                                                                                                                                                            Taylor Real Estate
                                                                   Under Contract Properties by Month
                                                   Dec-09 vs. Dec-11: The number of Under Contract properties is up 11%


                                                                                    Dec-09 vs. Dec-11
                  Dec-09                                               Dec-11                                     Change                                             %
                    18                                                   20                                         2                                               +11%


MLS: ACTRIS       Period:   2 years (monthly)           Price:   All                        Construction Type:    All             Bedrooms:       All         Bathrooms:      All   Lot Size: All
Property Types:   Residential: (House, Condo, Townhouse, Half Duplex, Modular)                                                                                                      Sq Ft:    All
MLS Areas:        1B


Clarus MarketMetrics®                                                                                    1 of 2                                                                                     01/04/2012
                                                Information not guaranteed. © 2009-2010 Terradatum and its suppliers and licensors (www.terradatum.com/about/licensors.td).


                               www.TaylorRealEstateAustin.com                   |   Direct: 512.796.4447      |   Fax: 512.628.7720           |    2525 Wallingwood Bldg. 7C Austin, TX 78746
                                                                                                                                                  7 of 20
Blake Taylor                                                                                                                                                                       Taylor Real Estate
                                                          Under Contract Properties by Month
                                           Dec-09 vs. Dec-11: The number of Under Contract properties is up 11%


                                       Full Market                                                Bank Properties                                            Non-Bank Properties
Time Period             # Properties      Median Price         Average DOM              # Properties          % Bank           Median Price           # Properties    % Non-Bank        Median Price
Dec-11                           20             474,500                    109                      4            20.0               361,950                      16         80.0            487,000
Nov-11                           29             549,000                     84                      2             6.9               912,000                      27         93.1            549,000
Oct-11                           29             450,000                    108                      0                                                            29        100.0            450,000
Sep-11                           33             599,000                     71                      1             3.0             1,549,000                      32         97.0            599,000
Aug-11                           45             469,000                     74                      3             6.7               170,000                      42         93.3            494,450
Jul-11                           44             455,000                     57                      1             2.3             1,200,000                      43         97.7            450,000
Jun-11                           40             499,500                     69                      0                                                            40        100.0            499,500
May-11                           53             499,900                    102                      1             1.9               494,900                      52         98.1            512,200
Apr-11                           59             524,000                     63                      1             1.7               442,000                      58         98.3            532,000
Mar-11                           48             502,950                    101                      4             8.3               661,700                      44         91.7            472,500
Feb-11                           25             565,000                    133                      2             8.0               198,000                      23         92.0            600,000
Jan-11                           32             567,500                    103                      3             9.4               146,500                      29         90.6            599,000
Dec-10                           28             479,942                    130                      5            17.9               169,000                      23         82.1            520,000
Nov-10                           29             485,000                     90                      2             6.9               273,700                      27         93.1            524,000
Oct-10                           32             472,500                    118                      1             3.1               154,900                      31         96.9            475,000
Sep-10                           29             479,000                     76                      1             3.5               164,900                      28         96.5            479,375
Aug-10                           25             517,000                     55                      2             8.0               263,610                      23         92.0            629,000
Jul-10                           30             567,500                    108                      0                                                            30        100.0            567,500
Jun-10                           42             537,450                     80                      1             2.4               169,900                      41         97.6            545,000
May-10                           44             649,950                     72                      4             9.1               187,000                      40         90.9            662,500
Apr-10                           54             542,000                     73                      4             7.4               175,825                      50         92.6            570,000
Mar-10                           34             482,000                     89                      0                                                            34        100.0            482,000
Feb-10                           33             475,000                     82                      8            24.2               157,450                      25         75.8            575,000
Jan-10                           19             525,000                     70                      4            21.1               132,700                      15         79.0            590,000
Dec-09                           18             551,250                     86                      4            22.2               134,900                      14         77.8            650,000


Clarus MarketMetrics®                                                                            2 of 2                                                                                       01/04/2012
                                        Information not guaranteed. © 2009-2010 Terradatum and its suppliers and licensors (www.terradatum.com/about/licensors.td).


                           www.TaylorRealEstateAustin.com            |   Direct: 512.796.4447           |   Fax: 512.628.7720       |    2525 Wallingwood Bldg. 7C Austin, TX 78746
                                                                                                                                        8 of 20
Blake Taylor                                                                                                                                                                            Taylor Real Estate
                                                                                    New Properties by Month
                                                          Dec-09 vs. Dec-11: The number of New properties is down 48%


                                                                                    Dec-09 vs. Dec-11
                  Dec-09                                               Dec-11                                     Change                                               %
                    40                                                   21                                         -19                                              -48%


MLS: ACTRIS       Period:   2 years (monthly)           Price:   All                        Construction Type:    All             Bedrooms:       All         Bathrooms:      All   Lot Size: All
Property Types:   Residential: (House, Condo, Townhouse, Half Duplex, Modular)                                                                                                      Sq Ft:    All
MLS Areas:        1B


Clarus MarketMetrics®                                                                                    1 of 2                                                                                     01/04/2012
                                                Information not guaranteed. © 2009-2010 Terradatum and its suppliers and licensors (www.terradatum.com/about/licensors.td).


                               www.TaylorRealEstateAustin.com                   |   Direct: 512.796.4447      |   Fax: 512.628.7720           |    2525 Wallingwood Bldg. 7C Austin, TX 78746
                                                                                                                                                  9 of 20
Blake Taylor                                                                                                                                                                    Taylor Real Estate
                                                                        New Properties by Month
                                                 Dec-09 vs. Dec-11: The number of New properties is down 48%


                            Full Market                                   Bank Properties                                              Non-Bank Properties
Time Period             # Properties     Median Price            # Properties         % Bank              Median Price         # Properties       % Non-Bank         Median Price
Dec-11                           21            449,900                       2             9.5                366,950                     19               90.5          510,000
Nov-11                           45            599,999                       0                                                            45             100.0           599,999
Oct-11                           59            599,900                       3             5.1                789,000                     56               94.9          594,900
Sep-11                           49            599,000                       1             2.0              1,549,000                     48               98.0          587,000
Aug-11                           57            549,000                       2             3.5                280,000                     55               96.5          549,900
Jul-11                           66            525,000                       1             1.5                320,000                     65               98.5          525,000
Jun-11                           81            575,000                       2             2.5                343,950                     79               97.5          595,000
May-11                           65            549,900                       1             1.5              1,200,000                     64               98.5          549,450
Apr-11                           82            584,000                       1             1.2              1,199,000                     81               98.8          569,000
Mar-11                          106            570,000                       2             1.9                420,500                    104               98.1          582,000
Feb-11                           46            569,750                       2             4.3                369,950                     44               95.7          594,250
Jan-11                           67            559,000                       3             4.5                319,900                     64               95.5          559,000
Dec-10                           25            489,000                       4            16.0                449,650                     21               84.0          489,000
Nov-10                           42            577,424                       4             9.5                254,450                     38               90.5          589,425
Oct-10                           59            520,000                       3             5.1                245,000                     56               94.9          520,000
Sep-10                           64            488,500                       4             6.2                273,700                     60               93.8          511,000
Aug-10                           56            428,000                       2             3.6                167,060                     54               96.4          439,250
Jul-10                           84            522,450                       4             4.8                342,400                     80               95.2          536,950
Jun-10                           87            595,000                       3             3.5                169,900                     84               96.5          599,000
May-10                           83            599,000                       1             1.2                348,000                     82               98.8          607,000
Apr-10                           95            535,000                       3             3.2                419,900                     92               96.8          540,000
Mar-10                          128            539,500                       4             3.1                184,950                    124               96.9          549,250
Feb-10                           80            506,950                       7             8.8                159,900                     73               91.2          595,000
Jan-10                           52            655,000                       5             9.6                234,900                     47               90.4          699,000
Dec-09                           40            474,950                       3             7.5                248,000                     37               92.5          525,000


Clarus MarketMetrics®                                                                            2 of 2                                                                                   01/04/2012
                                       Information not guaranteed. © 2009-2010 Terradatum and its suppliers and licensors (www.terradatum.com/about/licensors.td).


                           www.TaylorRealEstateAustin.com           |   Direct: 512.796.4447          |    Fax: 512.628.7720       |    2525 Wallingwood Bldg. 7C Austin, TX 78746
                                                                                                                                       10 of 20
Blake Taylor                                                                                                                                                                            Taylor Real Estate
                                                                           For Sale Properties by Month
                                                       Dec-09 vs. Dec-11: The number of For Sale properties is down 39%


                                                                                    Dec-09 vs. Dec-11
                  Dec-09                                               Dec-11                                     Change                                               %
                   331                                                  201                                        -130                                              -39%


MLS: ACTRIS       Period:   2 years (monthly)           Price:   All                        Construction Type:    All             Bedrooms:       All         Bathrooms:      All   Lot Size: All
Property Types:   Residential: (House, Condo, Townhouse, Half Duplex, Modular)                                                                                                      Sq Ft:    All
MLS Areas:        1B


Clarus MarketMetrics®                                                                                    1 of 2                                                                                     01/04/2012
                                                Information not guaranteed. © 2009-2010 Terradatum and its suppliers and licensors (www.terradatum.com/about/licensors.td).


                               www.TaylorRealEstateAustin.com                   |   Direct: 512.796.4447      |   Fax: 512.628.7720           |    2525 Wallingwood Bldg. 7C Austin, TX 78746
                                                                                                                                                  11 of 20
Blake Taylor                                                                                                                                                                       Taylor Real Estate
                                                                  For Sale Properties by Month
                                               Dec-09 vs. Dec-11: The number of For Sale properties is down 39%


                                       Full Market                                                Bank Properties                                            Non-Bank Properties
Time Period             # Properties      Median Price         Average DOM              # Properties          % Bank           Median Price           # Properties    % Non-Bank        Median Price
Dec-11                          201             639,000                    119                      8             4.0               404,000                     193         96.0            669,000
Nov-11                          246             675,000                    109                      8             3.2               527,500                     238         96.8            677,000
Oct-11                          256             657,200                    111                      8             3.1               527,500                     248         96.9            666,750
Sep-11                          269             645,000                    116                      6             2.2               527,500                     263         97.8            649,000
Aug-11                          303             599,999                    112                      8             2.6               394,500                     295         97.4            619,000
Jul-11                          321             595,000                    104                      7             2.2               525,000                     314         97.8            598,000
Jun-11                          318             589,625                    100                      7             2.2               525,000                     311         97.8            595,000
May-11                          307             585,000                    104                      6             1.9               512,450                     301         98.0            589,000
Apr-11                          320             577,000                     97                      6             1.9               468,450                     314         98.1            589,250
Mar-11                          308             550,000                    107                     11             3.6               484,900                     297         96.4            550,000
Feb-11                          241             532,500                    128                     11             4.6               484,900                     230         95.4            549,750
Jan-11                          258             549,000                    132                     15             5.8               319,900                     243         94.2            559,000
Dec-10                          267             530,000                    148                     19             7.1               259,000                     248         92.9            549,000
Nov-10                          321             565,000                    136                     18             5.6               254,450                     303         94.4            569,900
Oct-10                          356             549,000                    135                     15             4.2               248,000                     341         95.8            550,000
Sep-10                          379             545,000                    134                     15             4.0               392,500                     364         96.0            549,000
Aug-10                          399             565,000                    131                     13             3.3               348,000                     386         96.7            572,450
Jul-10                          421             590,000                    120                     12             2.9               449,950                     409         97.2            595,000
Jun-10                          422             595,000                    117                     10             2.4               383,950                     412         97.6            599,000
May-10                          405             595,000                    117                     11             2.7               348,000                     394         97.3            597,000
Apr-10                          401             584,000                    111                     15             3.7               318,500                     386         96.3            599,000
Mar-10                          383             584,000                    117                     12             3.1               217,600                     371         96.9            599,000
Feb-10                          315             569,900                    138                     20             6.3               185,950                     295         93.7            599,900
Jan-10                          294             575,000                    148                     19             6.5               194,000                     275         93.5            599,900
Dec-09                          331             587,500                    148                     21             6.3               170,000                     310         93.7            599,950


Clarus MarketMetrics®                                                                            2 of 2                                                                                       01/04/2012
                                        Information not guaranteed. © 2009-2010 Terradatum and its suppliers and licensors (www.terradatum.com/about/licensors.td).


                           www.TaylorRealEstateAustin.com            |   Direct: 512.796.4447           |   Fax: 512.628.7720       |    2525 Wallingwood Bldg. 7C Austin, TX 78746
                                                                                                                                        12 of 20
Blake Taylor                                                                                                                                                                            Taylor Real Estate
                                                                           Expired Properties by Month
                                                       Dec-09 vs. Dec-11: The number of Expired properties is down 55%


                                                                                    Dec-09 vs. Dec-11
                  Dec-09                                               Dec-11                                     Change                                               %
                    71                                                   32                                         -39                                              -55%


MLS: ACTRIS       Period:   2 years (monthly)           Price:   All                        Construction Type:    All             Bedrooms:       All         Bathrooms:      All   Lot Size: All
Property Types:   Residential: (House, Condo, Townhouse, Half Duplex, Modular)                                                                                                      Sq Ft:    All
MLS Areas:        1B


Clarus MarketMetrics®                                                                                    1 of 2                                                                                     01/04/2012
                                                Information not guaranteed. © 2009-2010 Terradatum and its suppliers and licensors (www.terradatum.com/about/licensors.td).


                               www.TaylorRealEstateAustin.com                   |   Direct: 512.796.4447      |   Fax: 512.628.7720           |    2525 Wallingwood Bldg. 7C Austin, TX 78746
                                                                                                                                                  13 of 20
Blake Taylor                                                                                                                                                                       Taylor Real Estate
                                                                   Expired Properties by Month
                                               Dec-09 vs. Dec-11: The number of Expired properties is down 55%


                                       Full Market                                                Bank Properties                                            Non-Bank Properties
Time Period             # Properties      Median Price         Average DOM             # Properties           % Bank          Median Price           # Properties     % Non-Bank       Median Price
Dec-11                           32             762,500                    142                      0                                                            32        100.0           762,500
Nov-11                           37             795,000                    150                      0                                                            37        100.0           795,000
Oct-11                           26             774,450                    151                      0                                                            26        100.0           774,450
Sep-11                           39             565,000                    164                      0                                                            39        100.0           565,000
Aug-11                           38             700,000                    148                      0                                                            38        100.0           700,000
Jul-11                           31             619,900                    132                      0                                                            31        100.0           619,900
Jun-11                           23             489,000                    126                      1             4.3               414,400                      22         95.7           504,500
May-11                           17             699,000                    106                      0                                                            17        100.0           699,000
Apr-11                           19             635,000                    157                      0                                                            19        100.0           635,000
Mar-11                           22             462,200                    162                      2             9.1               371,950                      20         90.9           464,538
Feb-11                           14             389,000                     77                      0                                                            14        100.0           389,000
Jan-11                           31             675,000                    156                      3             9.7               248,000                      28         90.3           694,325
Dec-10                           48             548,825                    153                      2             4.2               542,450                      46         95.8           548,825
Nov-10                           50             737,000                    158                      1             2.0               649,900                      49         98.0           749,000
Oct-10                           45             499,000                    175                      0                                                            45        100.0           499,000
Sep-10                           53             519,900                    171                      2             3.8               564,000                      51         96.2           519,900
Aug-10                           59             595,000                    124                      0                                                            59        100.0           595,000
Jul-10                           48             574,000                    101                      1             2.1               419,900                      47         97.9           599,000
Jun-10                           43             575,000                    135                      1             2.3               318,500                      42         97.7           609,950
May-10                           26             429,000                    154                      0                                                            26        100.0           429,000
Apr-10                           25             749,575                    135                      1             4.0               350,000                      24         96.0           754,288
Mar-10                           43             635,000                    158                      0                                                            43        100.0           635,000
Feb-10                           27             390,000                    153                      4            14.8               174,900                      23         85.2           488,226
Jan-10                           40             575,000                    128                      2             5.0               204,900                      38         95.0           609,500
Dec-09                           71             660,000                    156                      3             4.2               145,900                      68         95.8           680,000


Clarus MarketMetrics®                                                                            2 of 2                                                                                       01/04/2012
                                        Information not guaranteed. © 2009-2010 Terradatum and its suppliers and licensors (www.terradatum.com/about/licensors.td).


                            www.TaylorRealEstateAustin.com           |   Direct: 512.796.4447           |   Fax: 512.628.7720       |    2525 Wallingwood Bldg. 7C Austin, TX 78746
                                                                                                                                        14 of 20
Blake Taylor                                                                                                                                                                                Taylor Real Estate
                                                                                Supply & Demand by Month
                  Dec-09 vs. Dec-11: The number of for sale properties is down 39% and the number of sold properties is down 15%


                             Dec-09 vs. Dec-11                                                                                                                       Dec-09 vs. Dec-11
     Dec-09             Dec-11                Change                       %                                                                    Dec-09              Dec-11            Change              %
      331                201                   -130                      -39%                                                                     33                  28                -5              -15%


MLS: ACTRIS        Period:    2 years (monthly)           Price:   All                        Construction Type:    All             Bedrooms:       All         Bathrooms:      All     Lot Size: All
Property Types:    Residential: (House, Condo, Townhouse, Half Duplex, Modular)                                                                                                         Sq Ft:    All
MLS Areas:         1B


Clarus MarketMetrics®                                                                                      1 of 2                                                                                        01/04/2012
                                                  Information not guaranteed. © 2009-2010 Terradatum and its suppliers and licensors (www.terradatum.com/about/licensors.td).


                                 www.TaylorRealEstateAustin.com                 |   Direct: 512.796.4447        |   Fax: 512.628.7720           |    2525 Wallingwood Bldg. 7C Austin, TX 78746
                                                                                                                                                    15 of 20
Blake Taylor                                                                                                                                                              Taylor Real Estate
                                                                   Supply & Demand by Month
              Dec-09 vs. Dec-11: The number of for sale properties is down 39% and the number of sold properties is down 15%

                        # Properties              Average DOM                    # Properties                Average DOM
Time Period                 For Sale                   For Sale                         Sold                         Sold
Dec-11                          201                            119                           28                          77
Nov-11                          246                            109                           22                         133
Oct-11                          256                            111                           29                          58
Sep-11                          269                            116                           39                          74
Aug-11                          303                            112                           53                          76
Jul-11                          321                            104                           37                          68
Jun-11                          318                            100                           53                          87
May-11                          307                            104                           61                          93
Apr-11                          320                             97                           47                          59
Mar-11                          308                            107                           26                         136
Feb-11                          241                            128                           26                         125
Jan-11                          258                            132                           26                          86
Dec-10                          267                            148                           37                         126
Nov-10                          321                            136                           26                          72
Oct-10                          356                            135                           30                         105
Sep-10                          379                            134                           22                          68
Aug-10                          399                            131                           37                          91
Jul-10                          421                            120                           40                          67
Jun-10                          422                            117                           53                          80
May-10                          405                            117                           39                          79
Apr-10                          401                            111                           34                          93
Mar-10                          383                            117                           36                          78
Feb-10                          315                            138                           21                          66
Jan-10                          294                            148                           12                          91
Dec-09                          331                            148                           33                          99


Clarus MarketMetrics®                                                                             2 of 2                                                                             01/04/2012
                                       Information not guaranteed. © 2009-2010 Terradatum and its suppliers and licensors (www.terradatum.com/about/licensors.td).


                        www.TaylorRealEstateAustin.com               |   Direct: 512.796.4447         |    Fax: 512.628.7720       |    2525 Wallingwood Bldg. 7C Austin, TX 78746
                                                                                                                                       16 of 20
Blake Taylor                                                                                                                                                                            Taylor Real Estate
                                                                 The Average Days on Market by Month
                                                              Dec-09 vs. Dec-11: The average days on market is up 27%


                                                                                    Dec-09 vs. Dec-11
                  Dec-09                                               Dec-11                                     Change                                             %
                    86                                                  109                                         23                                              +27%


MLS: ACTRIS       Period:   2 years (monthly)           Price:   All                        Construction Type:    All             Bedrooms:       All         Bathrooms:      All   Lot Size: All
Property Types:   Residential: (House, Condo, Townhouse, Half Duplex, Modular)                                                                                                      Sq Ft:    All
MLS Areas:        1B


Clarus MarketMetrics®                                                                                    1 of 2                                                                                     01/04/2012
                                                Information not guaranteed. © 2009-2010 Terradatum and its suppliers and licensors (www.terradatum.com/about/licensors.td).


                               www.TaylorRealEstateAustin.com                   |   Direct: 512.796.4447      |   Fax: 512.628.7720           |    2525 Wallingwood Bldg. 7C Austin, TX 78746
                                                                                                                                                  17 of 20
Blake Taylor                                                                                                                                                              Taylor Real Estate
                                                      The Average Days on Market by Month
                                                     Dec-09 vs. Dec-11: The average days on market is up 27%


Time Period             Average DOM       # UC Units
Dec-11                          109                 20
Nov-11                           84                 29
Oct-11                          108                 29
Sep-11                           71                 33
Aug-11                           74                 45
Jul-11                           57                 44
Jun-11                           69                 40
May-11                          102                 53
Apr-11                           63                 59
Mar-11                          101                 48
Feb-11                          133                 25
Jan-11                          103                 32
Dec-10                          130                 28
Nov-10                           90                 29
Oct-10                          118                 32
Sep-10                           76                 29
Aug-10                           55                 25
Jul-10                          108                 30
Jun-10                           80                 42
May-10                           72                 44
Apr-10                           73                 54
Mar-10                           89                 34
Feb-10                           82                 33
Jan-10                           70                 19
Dec-09                           86                 18


Clarus MarketMetrics®                                                                           2 of 2                                                                               01/04/2012
                                       Information not guaranteed. © 2009-2010 Terradatum and its suppliers and licensors (www.terradatum.com/about/licensors.td).


                            www.TaylorRealEstateAustin.com          |   Direct: 512.796.4447         |   Fax: 512.628.7720         |    2525 Wallingwood Bldg. 7C Austin, TX 78746
                                                                                                                                       18 of 20
Blake Taylor                                                                                                                                                                            Taylor Real Estate
                                                                            Months Supply of Inventory
                                                 Dec-09 vs. Dec-11: The average months supply of inventory is down 45%


                                                                                    Dec-09 vs. Dec-11
                  Dec-09                                               Dec-11                                     Change                                              %
                   13.4                                                 7.4                                        -6.0                                             -45%


MLS: ACTRIS       Period:   2 years (monthly)           Price:   All                        Construction Type:    All            Bedrooms:       All          Bathrooms:      All   Lot Size: All
Property Types:   Residential: (House, Condo, Townhouse, Half Duplex, Modular)                                                                                                      Sq Ft:    All
MLS Areas:        1B


Clarus MarketMetrics®                                                                                    1 of 2                                                                                     01/04/2012
                                                Information not guaranteed. © 2009-2010 Terradatum and its suppliers and licensors (www.terradatum.com/about/licensors.td).


                               www.TaylorRealEstateAustin.com                   |   Direct: 512.796.4447      |   Fax: 512.628.7720          |    2525 Wallingwood Bldg. 7C Austin, TX 78746
                                                                                                                                                 19 of 20
Blake Taylor                                                                                                                                                                    Taylor Real Estate
                                                                         Months Supply of Inventory
                                              Dec-09 vs. Dec-11: The average months supply of inventory is down 45%

                          # Units For Sale          # UC Units                                   UC Average
Time Period             Last Day of Month         During Month                      MSI                DOM
Dec-11                      149                                 20                   7.5                   109
Nov-11                      180                                 29                   6.2                       84
Oct-11                      201                                 29                   6.9                   108
Sep-11                      197                                 33                   6.0                       71
Aug-11                      220                                 45                   4.9                       74
Jul-11                      246                                 44                   5.6                       57
Jun-11                      255                                 40                   6.4                       69
May-11                      237                                 53                   4.5                   102
Apr-11                      242                                 59                   4.1                       63
Mar-11                      238                                 48                   5.0                   101
Feb-11                      202                                 25                   8.1                   133
Jan-11                      195                                 32                   6.1                   103
Dec-10                      191                                 28                   6.8                   130
Nov-10                      242                                 29                   8.3                       90
Oct-10                      279                                 32                   8.7                   118
Sep-10                      297                                 29                  10.2                       76
Aug-10                      315                                 25                  12.6                       55
Jul-10                      343                                 30                  11.4                   108
Jun-10                      337                                 42                   8.0                       80
May-10                      335                                 44                   7.6                       72
Apr-10                      322                                 54                   6.0                       73
Mar-10                      306                                 34                   9.0                       89
Feb-10                      255                                 33                   7.7                       82
Jan-10                      235                                 19                  12.4                       70
Dec-09                      242                                 18                  13.4                       86


Clarus MarketMetrics®                                                                                 2 of 2                                                                               01/04/2012
                                             Information not guaranteed. © 2009-2010 Terradatum and its suppliers and licensors (www.terradatum.com/about/licensors.td).


                             www.TaylorRealEstateAustin.com               |   Direct: 512.796.4447         |    Fax: 512.628.7720        |    2525 Wallingwood Bldg. 7C Austin, TX 78746
                                                                                                                                             20 of 20

Mais conteúdo relacionado

Mais procurados

2, allandale, crestview, brentwood metrics
2, allandale, crestview, brentwood metrics2, allandale, crestview, brentwood metrics
2, allandale, crestview, brentwood metricsTaylor Real Estate
 
2 n, scofield farms, gracy farms, quail creek, lamplight village metrics
2 n, scofield farms, gracy farms, quail creek, lamplight village metrics2 n, scofield farms, gracy farms, quail creek, lamplight village metrics
2 n, scofield farms, gracy farms, quail creek, lamplight village metricsTaylor Real Estate
 
Sww, circle c, western oaks, meridian, avana
Sww, circle c, western oaks, meridian, avanaSww, circle c, western oaks, meridian, avana
Sww, circle c, western oaks, meridian, avanaTaylor Real Estate
 
Areas 6, 7 78704 - Bouldin Creek, Barton Hills, Travis Heights
Areas 6, 7  78704 - Bouldin Creek, Barton Hills, Travis HeightsAreas 6, 7  78704 - Bouldin Creek, Barton Hills, Travis Heights
Areas 6, 7 78704 - Bouldin Creek, Barton Hills, Travis HeightsTaylor Real Estate
 
3, windsor park, delwood, mueller
3, windsor park, delwood, mueller3, windsor park, delwood, mueller
3, windsor park, delwood, muellerTaylor Real Estate
 
Area 1a northwest hills, highland park
Area 1a   northwest hills, highland parkArea 1a   northwest hills, highland park
Area 1a northwest hills, highland parkTaylor Real Estate
 
Area 4 hyde park, shoal creek, rosedale
Area 4   hyde park, shoal creek, rosedaleArea 4   hyde park, shoal creek, rosedale
Area 4 hyde park, shoal creek, rosedaleTaylor Real Estate
 
Area 2 allandale, brentwood, crestview
Area 2   allandale, brentwood, crestviewArea 2   allandale, brentwood, crestview
Area 2 allandale, brentwood, crestviewTaylor Real Estate
 
Heath TX - January 2011 - Housing Market Report
Heath TX - January 2011 - Housing Market ReportHeath TX - January 2011 - Housing Market Report
Heath TX - January 2011 - Housing Market ReportValarie Littles
 
10 n, 10s, south austin metrics
10 n, 10s, south austin metrics10 n, 10s, south austin metrics
10 n, 10s, south austin metricsTaylor Real Estate
 
Area 3 windsor park, delwood, mueller
Area 3   windsor park, delwood, muellerArea 3   windsor park, delwood, mueller
Area 3 windsor park, delwood, muellerTaylor Real Estate
 

Mais procurados (20)

Ls, lakeway, bee cave metrics
Ls, lakeway, bee cave metricsLs, lakeway, bee cave metrics
Ls, lakeway, bee cave metrics
 
2, allandale, crestview, brentwood metrics
2, allandale, crestview, brentwood metrics2, allandale, crestview, brentwood metrics
2, allandale, crestview, brentwood metrics
 
Area 1n jester, lakewood
Area 1n   jester, lakewoodArea 1n   jester, lakewood
Area 1n jester, lakewood
 
2 n, scofield farms, gracy farms, quail creek, lamplight village metrics
2 n, scofield farms, gracy farms, quail creek, lamplight village metrics2 n, scofield farms, gracy farms, quail creek, lamplight village metrics
2 n, scofield farms, gracy farms, quail creek, lamplight village metrics
 
Ut metrics
Ut metricsUt metrics
Ut metrics
 
Sww, circle c, western oaks, meridian, avana
Sww, circle c, western oaks, meridian, avanaSww, circle c, western oaks, meridian, avana
Sww, circle c, western oaks, meridian, avana
 
Areas 6, 7 78704 - Bouldin Creek, Barton Hills, Travis Heights
Areas 6, 7  78704 - Bouldin Creek, Barton Hills, Travis HeightsAreas 6, 7  78704 - Bouldin Creek, Barton Hills, Travis Heights
Areas 6, 7 78704 - Bouldin Creek, Barton Hills, Travis Heights
 
3, windsor park, delwood, mueller
3, windsor park, delwood, mueller3, windsor park, delwood, mueller
3, windsor park, delwood, mueller
 
5, east austin metrics
5, east austin metrics5, east austin metrics
5, east austin metrics
 
Area 1a northwest hills, highland park
Area 1a   northwest hills, highland parkArea 1a   northwest hills, highland park
Area 1a northwest hills, highland park
 
Area 4 hyde park, shoal creek, rosedale
Area 4   hyde park, shoal creek, rosedaleArea 4   hyde park, shoal creek, rosedale
Area 4 hyde park, shoal creek, rosedale
 
Area 2 allandale, brentwood, crestview
Area 2   allandale, brentwood, crestviewArea 2   allandale, brentwood, crestview
Area 2 allandale, brentwood, crestview
 
Area 8e, 8w westlake
Area 8e, 8w   westlakeArea 8e, 8w   westlake
Area 8e, 8w westlake
 
DT Downtown
DT   DowntownDT   Downtown
DT Downtown
 
Condos only metrics
Condos only metricsCondos only metrics
Condos only metrics
 
Heath TX - January 2011 - Housing Market Report
Heath TX - January 2011 - Housing Market ReportHeath TX - January 2011 - Housing Market Report
Heath TX - January 2011 - Housing Market Report
 
10 n, 10s, south austin metrics
10 n, 10s, south austin metrics10 n, 10s, south austin metrics
10 n, 10s, south austin metrics
 
Central Austin Metrics
Central Austin MetricsCentral Austin Metrics
Central Austin Metrics
 
Area 3 windsor park, delwood, mueller
Area 3   windsor park, delwood, muellerArea 3   windsor park, delwood, mueller
Area 3 windsor park, delwood, mueller
 
Area 5 east austin
Area 5   east austinArea 5   east austin
Area 5 east austin
 

Destaque

Destaque (8)

Westlake Metrics
Westlake MetricsWestlake Metrics
Westlake Metrics
 
How To Make A Great Pbj
How To Make A Great PbjHow To Make A Great Pbj
How To Make A Great Pbj
 
Central austin metrics
Central austin metricsCentral austin metrics
Central austin metrics
 
How To Make A Great Pbj
How To Make A Great PbjHow To Make A Great Pbj
How To Make A Great Pbj
 
Area rn steiner, river place
Area rn   steiner, river placeArea rn   steiner, river place
Area rn steiner, river place
 
City Eventions Marketing Capabilities
City Eventions Marketing CapabilitiesCity Eventions Marketing Capabilities
City Eventions Marketing Capabilities
 
UT
UTUT
UT
 
How To Make A Great Pbj
How To Make A Great PbjHow To Make A Great Pbj
How To Make A Great Pbj
 

Semelhante a 1 b, old west austin metrics

Area sww village of western oaks, circle c
Area sww   village of western oaks, circle cArea sww   village of western oaks, circle c
Area sww village of western oaks, circle cTaylor Real Estate
 
NW Hills, Highland Park Metrics
NW Hills, Highland Park MetricsNW Hills, Highland Park Metrics
NW Hills, Highland Park MetricsTaylor Real Estate
 
Addison TX - Housing Market Report - November 2010
Addison TX - Housing Market Report - November 2010Addison TX - Housing Market Report - November 2010
Addison TX - Housing Market Report - November 2010Valarie Littles
 
Heath TX - Housing Market Report - November 2010
Heath TX - Housing Market Report - November 2010Heath TX - Housing Market Report - November 2010
Heath TX - Housing Market Report - November 2010Valarie Littles
 
Murphy TX - Housing Market Report - November 2010
Murphy TX - Housing Market Report - November 2010Murphy TX - Housing Market Report - November 2010
Murphy TX - Housing Market Report - November 2010Valarie Littles
 
Rockwall TX - Housing Market Report - November 2010
Rockwall TX - Housing Market Report - November 2010Rockwall TX - Housing Market Report - November 2010
Rockwall TX - Housing Market Report - November 2010Valarie Littles
 

Semelhante a 1 b, old west austin metrics (8)

Area sww village of western oaks, circle c
Area sww   village of western oaks, circle cArea sww   village of western oaks, circle c
Area sww village of western oaks, circle c
 
NW Hills, Highland Park Metrics
NW Hills, Highland Park MetricsNW Hills, Highland Park Metrics
NW Hills, Highland Park Metrics
 
Addison TX - Housing Market Report - November 2010
Addison TX - Housing Market Report - November 2010Addison TX - Housing Market Report - November 2010
Addison TX - Housing Market Report - November 2010
 
Heath TX - Housing Market Report - November 2010
Heath TX - Housing Market Report - November 2010Heath TX - Housing Market Report - November 2010
Heath TX - Housing Market Report - November 2010
 
Condos Only
Condos OnlyCondos Only
Condos Only
 
Murphy TX - Housing Market Report - November 2010
Murphy TX - Housing Market Report - November 2010Murphy TX - Housing Market Report - November 2010
Murphy TX - Housing Market Report - November 2010
 
Rockwall TX - Housing Market Report - November 2010
Rockwall TX - Housing Market Report - November 2010Rockwall TX - Housing Market Report - November 2010
Rockwall TX - Housing Market Report - November 2010
 
Areas 10N, 10S South Austin
Areas 10N, 10S   South AustinAreas 10N, 10S   South Austin
Areas 10N, 10S South Austin
 

1 b, old west austin metrics

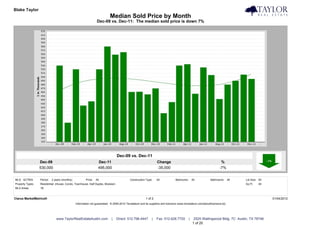
  • 1. Blake Taylor Taylor Real Estate Median Sold Price by Month Dec-09 vs. Dec-11: The median sold price is down 7% Dec-09 vs. Dec-11 Dec-09 Dec-11 Change % 530,000 495,000 -35,000 -7% MLS: ACTRIS Period: 2 years (monthly) Price: All Construction Type: All Bedrooms: All Bathrooms: All Lot Size: All Property Types: Residential: (House, Condo, Townhouse, Half Duplex, Modular) Sq Ft: All MLS Areas: 1B Clarus MarketMetrics® 1 of 2 01/04/2012 Information not guaranteed. © 2009-2010 Terradatum and its suppliers and licensors (www.terradatum.com/about/licensors.td). www.TaylorRealEstateAustin.com | Direct: 512.796.4447 | Fax: 512.628.7720 | 2525 Wallingwood Bldg. 7C Austin, TX 78746 1 of 20
  • 2. Blake Taylor Taylor Real Estate Median Sold Price by Month Dec-09 vs. Dec-11: The median sold price is down 7% Time Period Median Price # Units Average DOM Dec-11 495,000 28 77 Nov-11 506,250 22 133 Oct-11 490,000 29 58 Sep-11 480,000 39 74 Aug-11 442,000 53 76 Jul-11 505,100 37 68 Jun-11 525,000 53 87 May-11 456,000 61 93 Apr-11 533,500 47 59 Mar-11 530,000 26 136 Feb-11 434,000 26 125 Jan-11 404,875 26 86 Dec-10 470,000 37 126 Nov-10 454,500 26 72 Oct-10 461,250 30 105 Sep-10 460,750 22 68 Aug-10 565,000 37 91 Jul-10 558,500 40 67 Jun-10 580,000 53 80 May-10 520,000 39 79 Apr-10 436,000 34 93 Mar-10 425,000 36 78 Feb-10 520,000 21 66 Jan-10 380,000 12 91 Dec-09 530,000 33 99 Clarus MarketMetrics® 2 of 2 01/04/2012 Information not guaranteed. © 2009-2010 Terradatum and its suppliers and licensors (www.terradatum.com/about/licensors.td). www.TaylorRealEstateAustin.com | Direct: 512.796.4447 | Fax: 512.628.7720 | 2525 Wallingwood Bldg. 7C Austin, TX 78746 2 of 20
  • 3. Blake Taylor Taylor Real Estate Median For Sale vs. Median Sold Dec-09 vs. Dec-11: The median price of for sale properties is up 9% and the median price of sold properties is down 7% Dec-09 vs. Dec-11 Dec-09 vs. Dec-11 Dec-09 Dec-11 Change % Dec-09 Dec-11 Change % 587,500 639,000 51,500 +9% 530,000 495,000 -35,000 -7% MLS: ACTRIS Period: 2 years (monthly) Price: All Construction Type: All Bedrooms: All Bathrooms: All Lot Size: All Property Types: Residential: (House, Condo, Townhouse, Half Duplex, Modular) Sq Ft: All MLS Areas: 1B Clarus MarketMetrics® 1 of 2 01/04/2012 Information not guaranteed. © 2009-2010 Terradatum and its suppliers and licensors (www.terradatum.com/about/licensors.td). www.TaylorRealEstateAustin.com | Direct: 512.796.4447 | Fax: 512.628.7720 | 2525 Wallingwood Bldg. 7C Austin, TX 78746 3 of 20
  • 4. Blake Taylor Taylor Real Estate Median For Sale vs. Median Sold Dec-09 vs. Dec-11: The median price of for sale properties is up 9% and the median price of sold properties is down 7% For Sale # Properties Sold # Properties Price Time Period Median For Sale Median Sold Difference Dec-11 639,000 201 495,000 28 -144,000 Nov-11 675,000 246 506,250 22 -168,750 Oct-11 657,200 256 490,000 29 -167,200 Sep-11 645,000 269 480,000 39 -165,000 Aug-11 599,999 303 442,000 53 -157,999 Jul-11 595,000 321 505,100 37 -89,900 Jun-11 589,625 318 525,000 53 -64,625 May-11 585,000 307 456,000 61 -129,000 Apr-11 577,000 320 533,500 47 -43,500 Mar-11 550,000 308 530,000 26 -19,999 Feb-11 532,500 241 434,000 26 -98,500 Jan-11 549,000 258 404,875 26 -144,125 Dec-10 530,000 267 470,000 37 -60,000 Nov-10 565,000 321 454,500 26 -110,500 Oct-10 549,000 356 461,250 30 -87,750 Sep-10 545,000 379 460,750 22 -84,250 Aug-10 565,000 399 565,000 37 0 Jul-10 590,000 421 558,500 40 -31,500 Jun-10 595,000 422 580,000 53 -15,000 May-10 595,000 405 520,000 39 -75,000 Apr-10 584,000 401 436,000 34 -148,000 Mar-10 584,000 383 425,000 36 -159,000 Feb-10 569,900 315 520,000 21 -49,900 Jan-10 575,000 294 380,000 12 -195,000 Dec-09 587,500 331 530,000 33 -57,500 Clarus MarketMetrics® 2 of 2 01/04/2012 Information not guaranteed. © 2009-2010 Terradatum and its suppliers and licensors (www.terradatum.com/about/licensors.td). www.TaylorRealEstateAustin.com | Direct: 512.796.4447 | Fax: 512.628.7720 | 2525 Wallingwood Bldg. 7C Austin, TX 78746 4 of 20
  • 5. Blake Taylor Taylor Real Estate Sold Properties by Month Dec-09 vs. Dec-11: The number of Sold properties is down 15% Dec-09 vs. Dec-11 Dec-09 Dec-11 Change % 33 28 -5 -15% MLS: ACTRIS Period: 2 years (monthly) Price: All Construction Type: All Bedrooms: All Bathrooms: All Lot Size: All Property Types: Residential: (House, Condo, Townhouse, Half Duplex, Modular) Sq Ft: All MLS Areas: 1B Clarus MarketMetrics® 1 of 2 01/04/2012 Information not guaranteed. © 2009-2010 Terradatum and its suppliers and licensors (www.terradatum.com/about/licensors.td). www.TaylorRealEstateAustin.com | Direct: 512.796.4447 | Fax: 512.628.7720 | 2525 Wallingwood Bldg. 7C Austin, TX 78746 5 of 20
  • 6. Blake Taylor Taylor Real Estate Sold Properties by Month Dec-09 vs. Dec-11: The number of Sold properties is down 15% Full Market Bank Properties Non-Bank Properties Time Period # Properties Median Price Average DOM # Properties % Bank Median Price # Properties % Non-Bank Median Price Dec-11 28 495,000 77 1 3.6 1,463,400 27 96.4 475,000 Nov-11 22 506,250 133 0 22 100.0 506,250 Oct-11 29 490,000 58 3 10.3 180,000 26 89.7 504,450 Sep-11 39 480,000 74 1 2.6 385,000 38 97.4 500,000 Aug-11 53 442,000 76 2 3.8 837,500 51 96.2 425,000 Jul-11 37 505,100 68 0 37 100.0 505,100 Jun-11 53 525,000 87 0 53 100.0 525,000 May-11 61 456,000 93 3 4.9 306,900 58 95.1 462,500 Apr-11 47 533,500 59 4 8.5 629,500 43 91.5 533,500 Mar-11 26 530,000 136 0 26 100.0 530,000 Feb-11 26 434,000 125 3 11.5 144,000 23 88.5 500,000 Jan-11 26 404,875 86 6 23.1 173,750 20 76.9 466,650 Dec-10 37 470,000 126 1 2.7 390,000 36 97.3 485,000 Nov-10 26 454,500 72 1 3.9 140,000 25 96.2 460,000 Oct-10 30 461,250 105 0 30 100.0 461,250 Sep-10 22 460,750 68 2 9.1 167,860 20 90.9 465,000 Aug-10 37 565,000 91 2 5.4 274,000 35 94.6 575,000 Jul-10 40 558,500 67 2 5.0 831,950 38 95.0 558,500 Jun-10 53 580,000 80 3 5.7 175,800 50 94.3 594,750 May-10 39 520,000 79 2 5.1 170,000 37 94.9 535,000 Apr-10 34 436,000 93 1 2.9 150,150 33 97.1 439,000 Mar-10 36 425,000 78 8 22.2 158,204 28 77.8 500,000 Feb-10 21 520,000 66 4 19.1 141,000 17 81.0 682,000 Jan-10 12 380,000 91 3 25.0 151,500 9 75.0 428,684 Dec-09 33 530,000 99 2 6.1 146,200 31 93.9 553,500 Clarus MarketMetrics® 2 of 2 01/04/2012 Information not guaranteed. © 2009-2010 Terradatum and its suppliers and licensors (www.terradatum.com/about/licensors.td). www.TaylorRealEstateAustin.com | Direct: 512.796.4447 | Fax: 512.628.7720 | 2525 Wallingwood Bldg. 7C Austin, TX 78746 6 of 20
  • 7. Blake Taylor Taylor Real Estate Under Contract Properties by Month Dec-09 vs. Dec-11: The number of Under Contract properties is up 11% Dec-09 vs. Dec-11 Dec-09 Dec-11 Change % 18 20 2 +11% MLS: ACTRIS Period: 2 years (monthly) Price: All Construction Type: All Bedrooms: All Bathrooms: All Lot Size: All Property Types: Residential: (House, Condo, Townhouse, Half Duplex, Modular) Sq Ft: All MLS Areas: 1B Clarus MarketMetrics® 1 of 2 01/04/2012 Information not guaranteed. © 2009-2010 Terradatum and its suppliers and licensors (www.terradatum.com/about/licensors.td). www.TaylorRealEstateAustin.com | Direct: 512.796.4447 | Fax: 512.628.7720 | 2525 Wallingwood Bldg. 7C Austin, TX 78746 7 of 20
  • 8. Blake Taylor Taylor Real Estate Under Contract Properties by Month Dec-09 vs. Dec-11: The number of Under Contract properties is up 11% Full Market Bank Properties Non-Bank Properties Time Period # Properties Median Price Average DOM # Properties % Bank Median Price # Properties % Non-Bank Median Price Dec-11 20 474,500 109 4 20.0 361,950 16 80.0 487,000 Nov-11 29 549,000 84 2 6.9 912,000 27 93.1 549,000 Oct-11 29 450,000 108 0 29 100.0 450,000 Sep-11 33 599,000 71 1 3.0 1,549,000 32 97.0 599,000 Aug-11 45 469,000 74 3 6.7 170,000 42 93.3 494,450 Jul-11 44 455,000 57 1 2.3 1,200,000 43 97.7 450,000 Jun-11 40 499,500 69 0 40 100.0 499,500 May-11 53 499,900 102 1 1.9 494,900 52 98.1 512,200 Apr-11 59 524,000 63 1 1.7 442,000 58 98.3 532,000 Mar-11 48 502,950 101 4 8.3 661,700 44 91.7 472,500 Feb-11 25 565,000 133 2 8.0 198,000 23 92.0 600,000 Jan-11 32 567,500 103 3 9.4 146,500 29 90.6 599,000 Dec-10 28 479,942 130 5 17.9 169,000 23 82.1 520,000 Nov-10 29 485,000 90 2 6.9 273,700 27 93.1 524,000 Oct-10 32 472,500 118 1 3.1 154,900 31 96.9 475,000 Sep-10 29 479,000 76 1 3.5 164,900 28 96.5 479,375 Aug-10 25 517,000 55 2 8.0 263,610 23 92.0 629,000 Jul-10 30 567,500 108 0 30 100.0 567,500 Jun-10 42 537,450 80 1 2.4 169,900 41 97.6 545,000 May-10 44 649,950 72 4 9.1 187,000 40 90.9 662,500 Apr-10 54 542,000 73 4 7.4 175,825 50 92.6 570,000 Mar-10 34 482,000 89 0 34 100.0 482,000 Feb-10 33 475,000 82 8 24.2 157,450 25 75.8 575,000 Jan-10 19 525,000 70 4 21.1 132,700 15 79.0 590,000 Dec-09 18 551,250 86 4 22.2 134,900 14 77.8 650,000 Clarus MarketMetrics® 2 of 2 01/04/2012 Information not guaranteed. © 2009-2010 Terradatum and its suppliers and licensors (www.terradatum.com/about/licensors.td). www.TaylorRealEstateAustin.com | Direct: 512.796.4447 | Fax: 512.628.7720 | 2525 Wallingwood Bldg. 7C Austin, TX 78746 8 of 20
  • 9. Blake Taylor Taylor Real Estate New Properties by Month Dec-09 vs. Dec-11: The number of New properties is down 48% Dec-09 vs. Dec-11 Dec-09 Dec-11 Change % 40 21 -19 -48% MLS: ACTRIS Period: 2 years (monthly) Price: All Construction Type: All Bedrooms: All Bathrooms: All Lot Size: All Property Types: Residential: (House, Condo, Townhouse, Half Duplex, Modular) Sq Ft: All MLS Areas: 1B Clarus MarketMetrics® 1 of 2 01/04/2012 Information not guaranteed. © 2009-2010 Terradatum and its suppliers and licensors (www.terradatum.com/about/licensors.td). www.TaylorRealEstateAustin.com | Direct: 512.796.4447 | Fax: 512.628.7720 | 2525 Wallingwood Bldg. 7C Austin, TX 78746 9 of 20
  • 10. Blake Taylor Taylor Real Estate New Properties by Month Dec-09 vs. Dec-11: The number of New properties is down 48% Full Market Bank Properties Non-Bank Properties Time Period # Properties Median Price # Properties % Bank Median Price # Properties % Non-Bank Median Price Dec-11 21 449,900 2 9.5 366,950 19 90.5 510,000 Nov-11 45 599,999 0 45 100.0 599,999 Oct-11 59 599,900 3 5.1 789,000 56 94.9 594,900 Sep-11 49 599,000 1 2.0 1,549,000 48 98.0 587,000 Aug-11 57 549,000 2 3.5 280,000 55 96.5 549,900 Jul-11 66 525,000 1 1.5 320,000 65 98.5 525,000 Jun-11 81 575,000 2 2.5 343,950 79 97.5 595,000 May-11 65 549,900 1 1.5 1,200,000 64 98.5 549,450 Apr-11 82 584,000 1 1.2 1,199,000 81 98.8 569,000 Mar-11 106 570,000 2 1.9 420,500 104 98.1 582,000 Feb-11 46 569,750 2 4.3 369,950 44 95.7 594,250 Jan-11 67 559,000 3 4.5 319,900 64 95.5 559,000 Dec-10 25 489,000 4 16.0 449,650 21 84.0 489,000 Nov-10 42 577,424 4 9.5 254,450 38 90.5 589,425 Oct-10 59 520,000 3 5.1 245,000 56 94.9 520,000 Sep-10 64 488,500 4 6.2 273,700 60 93.8 511,000 Aug-10 56 428,000 2 3.6 167,060 54 96.4 439,250 Jul-10 84 522,450 4 4.8 342,400 80 95.2 536,950 Jun-10 87 595,000 3 3.5 169,900 84 96.5 599,000 May-10 83 599,000 1 1.2 348,000 82 98.8 607,000 Apr-10 95 535,000 3 3.2 419,900 92 96.8 540,000 Mar-10 128 539,500 4 3.1 184,950 124 96.9 549,250 Feb-10 80 506,950 7 8.8 159,900 73 91.2 595,000 Jan-10 52 655,000 5 9.6 234,900 47 90.4 699,000 Dec-09 40 474,950 3 7.5 248,000 37 92.5 525,000 Clarus MarketMetrics® 2 of 2 01/04/2012 Information not guaranteed. © 2009-2010 Terradatum and its suppliers and licensors (www.terradatum.com/about/licensors.td). www.TaylorRealEstateAustin.com | Direct: 512.796.4447 | Fax: 512.628.7720 | 2525 Wallingwood Bldg. 7C Austin, TX 78746 10 of 20
  • 11. Blake Taylor Taylor Real Estate For Sale Properties by Month Dec-09 vs. Dec-11: The number of For Sale properties is down 39% Dec-09 vs. Dec-11 Dec-09 Dec-11 Change % 331 201 -130 -39% MLS: ACTRIS Period: 2 years (monthly) Price: All Construction Type: All Bedrooms: All Bathrooms: All Lot Size: All Property Types: Residential: (House, Condo, Townhouse, Half Duplex, Modular) Sq Ft: All MLS Areas: 1B Clarus MarketMetrics® 1 of 2 01/04/2012 Information not guaranteed. © 2009-2010 Terradatum and its suppliers and licensors (www.terradatum.com/about/licensors.td). www.TaylorRealEstateAustin.com | Direct: 512.796.4447 | Fax: 512.628.7720 | 2525 Wallingwood Bldg. 7C Austin, TX 78746 11 of 20
  • 12. Blake Taylor Taylor Real Estate For Sale Properties by Month Dec-09 vs. Dec-11: The number of For Sale properties is down 39% Full Market Bank Properties Non-Bank Properties Time Period # Properties Median Price Average DOM # Properties % Bank Median Price # Properties % Non-Bank Median Price Dec-11 201 639,000 119 8 4.0 404,000 193 96.0 669,000 Nov-11 246 675,000 109 8 3.2 527,500 238 96.8 677,000 Oct-11 256 657,200 111 8 3.1 527,500 248 96.9 666,750 Sep-11 269 645,000 116 6 2.2 527,500 263 97.8 649,000 Aug-11 303 599,999 112 8 2.6 394,500 295 97.4 619,000 Jul-11 321 595,000 104 7 2.2 525,000 314 97.8 598,000 Jun-11 318 589,625 100 7 2.2 525,000 311 97.8 595,000 May-11 307 585,000 104 6 1.9 512,450 301 98.0 589,000 Apr-11 320 577,000 97 6 1.9 468,450 314 98.1 589,250 Mar-11 308 550,000 107 11 3.6 484,900 297 96.4 550,000 Feb-11 241 532,500 128 11 4.6 484,900 230 95.4 549,750 Jan-11 258 549,000 132 15 5.8 319,900 243 94.2 559,000 Dec-10 267 530,000 148 19 7.1 259,000 248 92.9 549,000 Nov-10 321 565,000 136 18 5.6 254,450 303 94.4 569,900 Oct-10 356 549,000 135 15 4.2 248,000 341 95.8 550,000 Sep-10 379 545,000 134 15 4.0 392,500 364 96.0 549,000 Aug-10 399 565,000 131 13 3.3 348,000 386 96.7 572,450 Jul-10 421 590,000 120 12 2.9 449,950 409 97.2 595,000 Jun-10 422 595,000 117 10 2.4 383,950 412 97.6 599,000 May-10 405 595,000 117 11 2.7 348,000 394 97.3 597,000 Apr-10 401 584,000 111 15 3.7 318,500 386 96.3 599,000 Mar-10 383 584,000 117 12 3.1 217,600 371 96.9 599,000 Feb-10 315 569,900 138 20 6.3 185,950 295 93.7 599,900 Jan-10 294 575,000 148 19 6.5 194,000 275 93.5 599,900 Dec-09 331 587,500 148 21 6.3 170,000 310 93.7 599,950 Clarus MarketMetrics® 2 of 2 01/04/2012 Information not guaranteed. © 2009-2010 Terradatum and its suppliers and licensors (www.terradatum.com/about/licensors.td). www.TaylorRealEstateAustin.com | Direct: 512.796.4447 | Fax: 512.628.7720 | 2525 Wallingwood Bldg. 7C Austin, TX 78746 12 of 20
  • 13. Blake Taylor Taylor Real Estate Expired Properties by Month Dec-09 vs. Dec-11: The number of Expired properties is down 55% Dec-09 vs. Dec-11 Dec-09 Dec-11 Change % 71 32 -39 -55% MLS: ACTRIS Period: 2 years (monthly) Price: All Construction Type: All Bedrooms: All Bathrooms: All Lot Size: All Property Types: Residential: (House, Condo, Townhouse, Half Duplex, Modular) Sq Ft: All MLS Areas: 1B Clarus MarketMetrics® 1 of 2 01/04/2012 Information not guaranteed. © 2009-2010 Terradatum and its suppliers and licensors (www.terradatum.com/about/licensors.td). www.TaylorRealEstateAustin.com | Direct: 512.796.4447 | Fax: 512.628.7720 | 2525 Wallingwood Bldg. 7C Austin, TX 78746 13 of 20
  • 14. Blake Taylor Taylor Real Estate Expired Properties by Month Dec-09 vs. Dec-11: The number of Expired properties is down 55% Full Market Bank Properties Non-Bank Properties Time Period # Properties Median Price Average DOM # Properties % Bank Median Price # Properties % Non-Bank Median Price Dec-11 32 762,500 142 0 32 100.0 762,500 Nov-11 37 795,000 150 0 37 100.0 795,000 Oct-11 26 774,450 151 0 26 100.0 774,450 Sep-11 39 565,000 164 0 39 100.0 565,000 Aug-11 38 700,000 148 0 38 100.0 700,000 Jul-11 31 619,900 132 0 31 100.0 619,900 Jun-11 23 489,000 126 1 4.3 414,400 22 95.7 504,500 May-11 17 699,000 106 0 17 100.0 699,000 Apr-11 19 635,000 157 0 19 100.0 635,000 Mar-11 22 462,200 162 2 9.1 371,950 20 90.9 464,538 Feb-11 14 389,000 77 0 14 100.0 389,000 Jan-11 31 675,000 156 3 9.7 248,000 28 90.3 694,325 Dec-10 48 548,825 153 2 4.2 542,450 46 95.8 548,825 Nov-10 50 737,000 158 1 2.0 649,900 49 98.0 749,000 Oct-10 45 499,000 175 0 45 100.0 499,000 Sep-10 53 519,900 171 2 3.8 564,000 51 96.2 519,900 Aug-10 59 595,000 124 0 59 100.0 595,000 Jul-10 48 574,000 101 1 2.1 419,900 47 97.9 599,000 Jun-10 43 575,000 135 1 2.3 318,500 42 97.7 609,950 May-10 26 429,000 154 0 26 100.0 429,000 Apr-10 25 749,575 135 1 4.0 350,000 24 96.0 754,288 Mar-10 43 635,000 158 0 43 100.0 635,000 Feb-10 27 390,000 153 4 14.8 174,900 23 85.2 488,226 Jan-10 40 575,000 128 2 5.0 204,900 38 95.0 609,500 Dec-09 71 660,000 156 3 4.2 145,900 68 95.8 680,000 Clarus MarketMetrics® 2 of 2 01/04/2012 Information not guaranteed. © 2009-2010 Terradatum and its suppliers and licensors (www.terradatum.com/about/licensors.td). www.TaylorRealEstateAustin.com | Direct: 512.796.4447 | Fax: 512.628.7720 | 2525 Wallingwood Bldg. 7C Austin, TX 78746 14 of 20
  • 15. Blake Taylor Taylor Real Estate Supply & Demand by Month Dec-09 vs. Dec-11: The number of for sale properties is down 39% and the number of sold properties is down 15% Dec-09 vs. Dec-11 Dec-09 vs. Dec-11 Dec-09 Dec-11 Change % Dec-09 Dec-11 Change % 331 201 -130 -39% 33 28 -5 -15% MLS: ACTRIS Period: 2 years (monthly) Price: All Construction Type: All Bedrooms: All Bathrooms: All Lot Size: All Property Types: Residential: (House, Condo, Townhouse, Half Duplex, Modular) Sq Ft: All MLS Areas: 1B Clarus MarketMetrics® 1 of 2 01/04/2012 Information not guaranteed. © 2009-2010 Terradatum and its suppliers and licensors (www.terradatum.com/about/licensors.td). www.TaylorRealEstateAustin.com | Direct: 512.796.4447 | Fax: 512.628.7720 | 2525 Wallingwood Bldg. 7C Austin, TX 78746 15 of 20
  • 16. Blake Taylor Taylor Real Estate Supply & Demand by Month Dec-09 vs. Dec-11: The number of for sale properties is down 39% and the number of sold properties is down 15% # Properties Average DOM # Properties Average DOM Time Period For Sale For Sale Sold Sold Dec-11 201 119 28 77 Nov-11 246 109 22 133 Oct-11 256 111 29 58 Sep-11 269 116 39 74 Aug-11 303 112 53 76 Jul-11 321 104 37 68 Jun-11 318 100 53 87 May-11 307 104 61 93 Apr-11 320 97 47 59 Mar-11 308 107 26 136 Feb-11 241 128 26 125 Jan-11 258 132 26 86 Dec-10 267 148 37 126 Nov-10 321 136 26 72 Oct-10 356 135 30 105 Sep-10 379 134 22 68 Aug-10 399 131 37 91 Jul-10 421 120 40 67 Jun-10 422 117 53 80 May-10 405 117 39 79 Apr-10 401 111 34 93 Mar-10 383 117 36 78 Feb-10 315 138 21 66 Jan-10 294 148 12 91 Dec-09 331 148 33 99 Clarus MarketMetrics® 2 of 2 01/04/2012 Information not guaranteed. © 2009-2010 Terradatum and its suppliers and licensors (www.terradatum.com/about/licensors.td). www.TaylorRealEstateAustin.com | Direct: 512.796.4447 | Fax: 512.628.7720 | 2525 Wallingwood Bldg. 7C Austin, TX 78746 16 of 20
  • 17. Blake Taylor Taylor Real Estate The Average Days on Market by Month Dec-09 vs. Dec-11: The average days on market is up 27% Dec-09 vs. Dec-11 Dec-09 Dec-11 Change % 86 109 23 +27% MLS: ACTRIS Period: 2 years (monthly) Price: All Construction Type: All Bedrooms: All Bathrooms: All Lot Size: All Property Types: Residential: (House, Condo, Townhouse, Half Duplex, Modular) Sq Ft: All MLS Areas: 1B Clarus MarketMetrics® 1 of 2 01/04/2012 Information not guaranteed. © 2009-2010 Terradatum and its suppliers and licensors (www.terradatum.com/about/licensors.td). www.TaylorRealEstateAustin.com | Direct: 512.796.4447 | Fax: 512.628.7720 | 2525 Wallingwood Bldg. 7C Austin, TX 78746 17 of 20
  • 18. Blake Taylor Taylor Real Estate The Average Days on Market by Month Dec-09 vs. Dec-11: The average days on market is up 27% Time Period Average DOM # UC Units Dec-11 109 20 Nov-11 84 29 Oct-11 108 29 Sep-11 71 33 Aug-11 74 45 Jul-11 57 44 Jun-11 69 40 May-11 102 53 Apr-11 63 59 Mar-11 101 48 Feb-11 133 25 Jan-11 103 32 Dec-10 130 28 Nov-10 90 29 Oct-10 118 32 Sep-10 76 29 Aug-10 55 25 Jul-10 108 30 Jun-10 80 42 May-10 72 44 Apr-10 73 54 Mar-10 89 34 Feb-10 82 33 Jan-10 70 19 Dec-09 86 18 Clarus MarketMetrics® 2 of 2 01/04/2012 Information not guaranteed. © 2009-2010 Terradatum and its suppliers and licensors (www.terradatum.com/about/licensors.td). www.TaylorRealEstateAustin.com | Direct: 512.796.4447 | Fax: 512.628.7720 | 2525 Wallingwood Bldg. 7C Austin, TX 78746 18 of 20
  • 19. Blake Taylor Taylor Real Estate Months Supply of Inventory Dec-09 vs. Dec-11: The average months supply of inventory is down 45% Dec-09 vs. Dec-11 Dec-09 Dec-11 Change % 13.4 7.4 -6.0 -45% MLS: ACTRIS Period: 2 years (monthly) Price: All Construction Type: All Bedrooms: All Bathrooms: All Lot Size: All Property Types: Residential: (House, Condo, Townhouse, Half Duplex, Modular) Sq Ft: All MLS Areas: 1B Clarus MarketMetrics® 1 of 2 01/04/2012 Information not guaranteed. © 2009-2010 Terradatum and its suppliers and licensors (www.terradatum.com/about/licensors.td). www.TaylorRealEstateAustin.com | Direct: 512.796.4447 | Fax: 512.628.7720 | 2525 Wallingwood Bldg. 7C Austin, TX 78746 19 of 20
  • 20. Blake Taylor Taylor Real Estate Months Supply of Inventory Dec-09 vs. Dec-11: The average months supply of inventory is down 45% # Units For Sale # UC Units UC Average Time Period Last Day of Month During Month MSI DOM Dec-11 149 20 7.5 109 Nov-11 180 29 6.2 84 Oct-11 201 29 6.9 108 Sep-11 197 33 6.0 71 Aug-11 220 45 4.9 74 Jul-11 246 44 5.6 57 Jun-11 255 40 6.4 69 May-11 237 53 4.5 102 Apr-11 242 59 4.1 63 Mar-11 238 48 5.0 101 Feb-11 202 25 8.1 133 Jan-11 195 32 6.1 103 Dec-10 191 28 6.8 130 Nov-10 242 29 8.3 90 Oct-10 279 32 8.7 118 Sep-10 297 29 10.2 76 Aug-10 315 25 12.6 55 Jul-10 343 30 11.4 108 Jun-10 337 42 8.0 80 May-10 335 44 7.6 72 Apr-10 322 54 6.0 73 Mar-10 306 34 9.0 89 Feb-10 255 33 7.7 82 Jan-10 235 19 12.4 70 Dec-09 242 18 13.4 86 Clarus MarketMetrics® 2 of 2 01/04/2012 Information not guaranteed. © 2009-2010 Terradatum and its suppliers and licensors (www.terradatum.com/about/licensors.td). www.TaylorRealEstateAustin.com | Direct: 512.796.4447 | Fax: 512.628.7720 | 2525 Wallingwood Bldg. 7C Austin, TX 78746 20 of 20