SlideShare a Scribd company logo
1 of 4
Download to read offline
Purchasing
Managers’ Index
Cecilia Hermansson. Swedbank. Economic Research Department. Phone +46-8-5859 7720.
Administration. phone +46-8-5859 7740. fax +46-8-5859 3540. e-mail ek.sekr@swedbank.com
Sebastian Bergfelt. SILF. Phone +46-73-944 6450. professionals@silf.se
PMI declines to 60.6 in August 2010 – the rate of increase in
production and new orders has slowed
• The PMI declined to 60.6 in August, compared with 64.2 in July. While the Swedish
manufacturing industry continues to expand, the rate of increase has leveled off compared
with the spring and summer months.
• The component index for industrial production had the greatest negative impact on the
PMI, followed by new orders which rose but at a more moderate rate. The slower rate of
expansion can be seen in both the home and export markets.
• However, companies’ production plans continued to rise somewhat, and a majority of
them expect to expand in the next six months despite signs of weaker global activity.
Moreover, the industrial sector continues to hire new employees. The component index for
employment reached 60.5 – the highest point since 1995.
• The majority of industrial companies are now reporting rising prices for commodities and
intermediate goods, but the decline of the index to 68.5 indicates that the price increases
are slowing down as global economic growth begins to level off.
25
30
35
40
45
50
55
60
65
70
75
94 95 96 97 98 99 2000 2001 2002 2003 2004 2005 2006 2007 2008 2009 2010
PMI Original
Seasonally Adjusted
PMI Original and Seasonally Adjusted
2 (4)
Silf/Swedbanks’ Purchasing Managers’ Index. seasonally adjusted
PMI Components of PMI Other indices Forecast
Total New Produc- Employ- Delivery Export Domestic Back-log Planned
Index orders tion ment times Inventories orders orders of orders Prices Import Production
2007 Jul 60.5 63.0 65.6 54.0 64.4 53.1 62.7 59.7 56.3 67.8 64.1 71.8
Aug 56.8 57.3 58.4 54.9 61.0 52.3 59.2 54.1 55.8 63.0 55.7 70.2
Sep 58.2 62.0 59.2 56.7 59.6 55.0 61.0 56.4 60.0 59.0 58.1 72.1
Oct 59.4 61.0 63.7 57.1 60.2 52.8 59.1 58.9 62.7 62.3 59.0 72.5
Nov 55.1 54.7 57.4 55.7 57.5 53.1 53.3 54.5 53.7 60.4 55.7 69.2
Dec 55.5 57.1 58.3 53.8 55.5 53.1 57.7 55.0 60.2 62.7 56.4 69.7
2008 Jan 54.6 53.6 55.2 55.4 58.2 50.5 54.2 54.5 51.5 65.6 55.7 67.8
Feb 55.7 56.9 60.2 52.5 55.6 52.6 56.1 57.9 57.9 67.5 59.2 64.4
Mar 54.7 56.5 56.8 51.9 57.0 53.5 56.9 51.6 51.5 70.4 56.5 63.9
Apr 50.1 47.1 54.0 48.0 52.0 48.9 46.4 49.7 47.1 69.6 52.1 61.9
May 51.2 51.3 53.4 48.6 51.1 49.0 50.9 50.7 52.0 74.3 56.2 59.9
Jun 50.6 50.3 53.9 47.8 51.8 52.2 52.5 46.7 49.0 75.6 56.2 64.7
Jul 48.6 46.0 53.6 45.5 50.4 53.1 46.6 44.6 42.7 76.8 58.5 58.7
Aug 46.4 42.7 47.8 44.2 51.0 49.1 44.0 43.3 43.0 70.2 51.2 49.5
Sep 42.3 38.7 41.3 42.6 42.5 45.4 40.9 38.0 39.7 55.1 48.7 47.4
Oct 39.0 34.8 39.1 39.8 35.9 45.7 37.0 35.4 36.0 38.2 44.5 39.5
Nov 33.1 26.0 31.0 36.5 31.0 43.6 29.4 25.8 28.1 29.4 37.5 31.8
Dec 32.7 26.1 31.0 33.5 28.6 38.9 26.3 23.3 25.7 27.9 32.3 26.3
2009 Jan 33.8 29.0 33.3 32.1 30.3 41.8 34.2 27.9 25.9 29.1 35.5 32.9
Feb 33.9 28.8 34.0 31.0 28.4 36.6 29.7 30.5 29.7 30.4 33.5 35.8
Mar 36.7 35.1 38.8 31.1 28.0 39.6 39.7 35.5 30.8 27.7 38.5 38.2
Apr 38.8 41.5 39.4 28.3 29.6 35.9 45.3 37.7 39.7 30.6 38.8 42.4
May 43.7 46.4 47.4 31.1 34.2 33.5 47.5 44.1 42.8 32.7 41.0 47.3
Jun 50.5 54.7 55.8 36.0 42.4 34.0 54.4 49.2 47.4 43.3 47.3 55.2
Jul 54.3 60.5 61.0 40.3 44.4 38.4 56.4 58.1 54.1 46.9 51.0 59.1
Aug 52.4 57.8 56.1 40.6 46.4 40.4 61.1 50.1 54.3 52.6 50.7 61.7
Sep 55.9 59.2 60.5 45.0 53.7 40.6 61.1 55.0 54.0 54.5 55.7 63.3
Oct 56.7 60.8 61.7 43.8 56.2 41.6 60.7 55.8 58.9 56.7 55.8 62.2
Nov 56.0 57.9 59.0 48.7 55.0 41.3 59.7 53.6 53.6 59.8 57.0 62.2
Dec 58.2 63.7 59.7 49.5 56.3 42.7 58.1 66.3 56.6 57.3 59.0 67.4
2010 Jan 61.7 66.8 70.2 49.6 61.5 48.3 62.3 64.8 62.6 61.2 61.3 69.5
Feb 61.5 67.5 65.3 55.0 61.4 53.6 62.7 63.6 64.2 61.3 59.7 68.1
Mar 61.1 63.8 63.7 54.9 67.0 50.2 62.3 58.9 60.6 65.7 62.3 69.6
Apr 64.0 68.1 66.3 56.6 68.3 46.0 64.6 63.2 62.5 75.6 60.3 77.5
May 66.0 68.8 71.0 60.1 71.5 50.7 62.6 64.1 64.3 71.0 59.9 73.0
Jun 62.4 61.1 66.8 60.3 69.2 50.4 57.4 60.1 60.9 71.1 59.5 73.1
Jul 64.2 67.3 72.2 56.3 66.4 51.4 61.4 63.2 63.4 70.9 60.9 72.0
Aug 60.6 61.8 61.9 60.5 64.5 52.0 57.4 58.7 59.7 68.5 56.1 72.4
3 (4)
Silf/Swedbanks’ Purchasing Managers’ Index
PMI Components of PMI Other indices Forecast
Total New- Produc- Employ- Delivery Export Domestic Back-log Planned
Index orders tion ment times Inventories orders orders of orders Prices Import Production
2007 Jul 55.7 56.6 54.1 54.1 65.8 54.9 58.6 53.7 54.5 66.0 58.7 70.5
Aug 59.9 61.7 64.5 55.7 62.6 53.1 61.7 58.8 60.9 62.7 58.1 72.4
Sep 59.4 62.2 61.9 57.7 61.5 54.6 60.5 58.2 59.5 60.6 59.4 71.1
Oct 58.5 58.6 62.8 56.4 60.6 51.3 56.3 57.6 58.4 62.7 57.4 69.9
Nov 53.3 51.2 55.0 54.7 55.9 50.9 50.3 52.4 49.1 58.3 54.2 67.1
Dec 51.8 51.7 52.6 51.2 52.1 49.7 53.4 50.3 54.9 59.4 53.8 68.6
2008 Jan 52.7 52.3 52.6 52.9 54.4 48.9 53.8 52.0 50.6 64.6 54.7 68.9
Feb 56.5 59.9 61.4 51.5 53.6 51.5 59.5 59.2 60.5 67.5 59.7 66.5
Mar 56.0 59.4 59.6 51.2 56.5 54.4 59.3 52.9 54.4 71.3 58.3 65.8
Apr 51.9 49.4 57.2 49.4 52.7 50.0 47.9 51.5 49.1 73.0 53.7 63.6
May 52.5 52.7 55.3 50.3 52.7 51.0 51.9 52.0 54.0 77.5 57.9 59.7
Jun 52.9 53.4 57.4 50.3 53.7 55.5 55.0 49.7 50.7 76.0 58.0 62.5
Jul 43.8 39.6 42.1 45.6 51.8 54.9 42.5 38.6 40.9 75.0 53.1 57.4
Aug 49.3 46.7 53.6 44.7 52.7 49.7 46.2 47.7 47.7 69.9 53.4 51.0
Sep 43.2 38.5 43.4 43.4 44.0 44.7 40.1 39.3 38.8 55.6 49.7 45.8
Oct 37.7 31.9 37.8 38.9 35.7 44.0 33.8 33.6 31.3 36.6 42.5 36.0
Nov 30.7 21.8 27.9 35.2 28.8 41.1 25.7 22.9 22.9 25.3 35.3 28.8
Dec 28.6 20.2 24.8 30.6 24.6 35.1 21.5 17.9 19.9 22.9 28.9 24.3
2009 Jan 31.7 27.6 30.5 29.4 26.3 40.1 34.0 25.2 24.7 26.9 34.0 33.9
Feb 34.8 32.0 35.3 29.9 26.3 35.2 33.1 32.1 32.5 29.7 33.7 38.2
Mar 38.3 38.7 42.1 30.5 27.5 40.5 42.8 37.5 34.2 28.2 40.6 40.7
Apr 41.1 44.8 43.2 29.7 30.6 36.8 47.8 40.4 42.6 34.1 40.6 45.1
May 45.8 49.0 50.3 33.1 36.5 35.3 49.6 46.6 45.9 36.5 43.2 48.3
Jun 53.9 59.4 60.8 39.1 45.5 37.3 58.3 53.5 50.3 45.1 50.0 54.6
Jul 50.7 55.7 51.3 40.8 46.9 40.7 53.5 53.6 53.1 47.4 47.3 59.2
Aug 56.2 62.9 62.9 41.9 49.3 41.5 64.6 55.3 60.2 54.5 53.9 64.7
Sep 57.7 59.9 63.6 46.7 56.6 40.4 61.2 57.1 54.0 57.0 57.8 62.9
Oct 56.1 58.6 61.1 43.6 57.2 40.4 58.1 54.7 55.0 56.8 54.7 59.6
Nov 53.9 53.8 56.1 48.1 53.5 39.3 56.1 50.8 48.5 56.9 55.4 59.5
Dec 54.2 57.9 53.5 47.2 52.8 39.3 61.6 52.8 50.8 52.8 56.0 65.7
2010 Jan 59.7 65.4 67.7 47.2 57.9 49.2 61.7 62.3 61.5 59.4 60.1 70.6
Feb 62.2 70.4 66.3 54.3 59.4 52.9 65.5 65.0 66.9 60.6 59.8 70.2
Mar 62.4 66.7 66.4 54.5 66.6 51.4 64.8 60.3 63.4 66.1 64.2 71.6
Apr 66.0 70.9 69.6 58.0 69.2 46.8 66.6 65.4 64.9 79.3 61.7 79.9
May 67.8 70.8 73.6 62.1 73.6 52.5 64.0 66.1 66.9 74.4 61.6 73.4
Jun 65.3 64.9 71.2 63.2 71.8 53.6 60.4 63.7 63.2 72.5 61.6 72.0
Jul 60.3 62.1 62.4 56.3 68.2 53.6 58.0 58.4 62.1 70.8 56.8 71.6
Aug 63.9 66.3 68.0 61.5 66.7 53.0 60.4 63.4 65.1 69.7 58.7 75.0
4 (4)
Silf/Swedbank’s
Purchasing Managers’ Index
- objectives and methodology
History Silf (earlier I&L) and Swedbank AB. publ. (at that time Sparbanken Sweden)
make the first joint – internal – calculation of the “Purchasing Managers’ Index” for
the five indexes (PMI) in December 1994. Exactly one year later, the index was
publicly announced for the first time. In Sweden the Purchasing Managers’ Index
is known as the ICI index. The model for PMI is the ISM index (Institute for Supply
Management, formerly known as the NAPM index) – one of the most highly
regarded and well-recognized economic indicators in the United States. The ISM
index has existed since 1931 in the form of its predecessor, the NAPM index.
Participants About 200 purchasing managers in the manufacturing industry.
Publication First weekday of each month. 8:30 am.
Analysis Period Comparison with previous month.
Composition of PMI (%) New orders (within the company) 30
Production (within the company) 25
Employment (within the company) 20
Suppliers’ Delivery Times 15
Inventories (purchased material) 10
Other leading indicators New Export Orders
(not included in PMI) New Domestic Orders
Backlog of Orders
Suppliers’ commodity and intermediate goods prices
Imports
Production Plans next six months
Other questions Reason for higher/lower inventories level
Important commodities and intermediate goods with rising/falling prices
Objective Quick economic indicator
Simple statistics
Statistics with relatively short publication intervals
Constant contact with well-informed professional group
Calculation According to “diffusion index”. Positive changes are noted in percent for the five
sub indexes. The percentage of unchanged replies, multiplied by 0.5, is added to
this figure. Then the different sub indexes are weighted as described above to
reach the total index. The Purchasing Managers’ Index does not indicate activity
levels but rather monthly changes in industrial activity.
“Break-even” The dividing line between growth and decline – in line with US praxis – has been
drawn at a total index of 50. However, this boundary or “neutral growth zone”
should not be applied excessively. Rather, “Break-even” at 50 indicates a target
value.
We believe we have used reliable sources and procedures to generate and analyze the Purchasing Managers’ Index (PMI –
in Sweden ICI). However, Swedbank AB (publ) and SILF (earlier Organisationen för Inköp och Logistik, /I&L/ – The
Organization for Purchasing and Logistics) cannot guarantee the accuracy or completeness of the analyses and cannot be
responsible for any errors or omissions in the basic data or processing thereof. The reader should base any decisions on
other background material as well.
Swedbank AB (publ), SILF. their employees, and other coworkers accept no liability whatsoever for any direct or
consequential loss or injury of any kind arising from any errors or omissions in the analyses presented in the Purchasing
Managers’ Index.

More Related Content

More from Swedbank

Swedbank corporate presentation April 25 2017
Swedbank corporate presentation April 25 2017Swedbank corporate presentation April 25 2017
Swedbank corporate presentation April 25 2017Swedbank
 
Swedbank foretagspresentation 25 april 2017
Swedbank foretagspresentation 25 april 2017Swedbank foretagspresentation 25 april 2017
Swedbank foretagspresentation 25 april 2017Swedbank
 
Delårsrapport kv1 2017
Delårsrapport kv1 2017Delårsrapport kv1 2017
Delårsrapport kv1 2017Swedbank
 
Interim report q1 2017
Interim report q1 2017Interim report q1 2017
Interim report q1 2017Swedbank
 
Year end report 2016
Year end report 2016Year end report 2016
Year end report 2016Swedbank
 
Bokslutskommuniké 2016
Bokslutskommuniké 2016Bokslutskommuniké 2016
Bokslutskommuniké 2016Swedbank
 
Swedbank företagspresentation, 2 februari 2017
Swedbank företagspresentation, 2 februari 2017Swedbank företagspresentation, 2 februari 2017
Swedbank företagspresentation, 2 februari 2017Swedbank
 
Swedbank corporate presentation, February 2 2017
Swedbank corporate presentation, February 2 2017Swedbank corporate presentation, February 2 2017
Swedbank corporate presentation, February 2 2017Swedbank
 
Swedbank företagspresentation, 25 oktober 2016
Swedbank företagspresentation, 25 oktober 2016Swedbank företagspresentation, 25 oktober 2016
Swedbank företagspresentation, 25 oktober 2016Swedbank
 
Swedbank Corporate Presentation, June 30 2016
Swedbank Corporate Presentation, June 30 2016Swedbank Corporate Presentation, June 30 2016
Swedbank Corporate Presentation, June 30 2016Swedbank
 
Swedbank företagspresentation, 30 juni 2016
Swedbank företagspresentation, 30 juni 2016Swedbank företagspresentation, 30 juni 2016
Swedbank företagspresentation, 30 juni 2016Swedbank
 
Swedbank corporate presentation Q1, 2016
Swedbank corporate presentation Q1, 2016Swedbank corporate presentation Q1, 2016
Swedbank corporate presentation Q1, 2016Swedbank
 
Swedbank företagspresentation kvartal 1, 2016.
Swedbank företagspresentation kvartal 1, 2016.Swedbank företagspresentation kvartal 1, 2016.
Swedbank företagspresentation kvartal 1, 2016.Swedbank
 
Swedbank corporate presentation Q4, 2015
Swedbank corporate presentation Q4, 2015Swedbank corporate presentation Q4, 2015
Swedbank corporate presentation Q4, 2015Swedbank
 
Swedbank företagspresentation kvartal 4,2015
Swedbank företagspresentation kvartal 4,2015Swedbank företagspresentation kvartal 4,2015
Swedbank företagspresentation kvartal 4,2015Swedbank
 
Year end report 2015
Year end report 2015Year end report 2015
Year end report 2015Swedbank
 
Bokslutskommuniké 2015
Bokslutskommuniké 2015Bokslutskommuniké 2015
Bokslutskommuniké 2015Swedbank
 
Swedbank Företagspresentation, September 2015
Swedbank Företagspresentation, September 2015Swedbank Företagspresentation, September 2015
Swedbank Företagspresentation, September 2015Swedbank
 
Swedbank Corporate Presentation, September 2015
Swedbank Corporate Presentation, September 2015Swedbank Corporate Presentation, September 2015
Swedbank Corporate Presentation, September 2015Swedbank
 
Swedbank's third quarter 2015 results
Swedbank's third quarter 2015 resultsSwedbank's third quarter 2015 results
Swedbank's third quarter 2015 resultsSwedbank
 

More from Swedbank (20)

Swedbank corporate presentation April 25 2017
Swedbank corporate presentation April 25 2017Swedbank corporate presentation April 25 2017
Swedbank corporate presentation April 25 2017
 
Swedbank foretagspresentation 25 april 2017
Swedbank foretagspresentation 25 april 2017Swedbank foretagspresentation 25 april 2017
Swedbank foretagspresentation 25 april 2017
 
Delårsrapport kv1 2017
Delårsrapport kv1 2017Delårsrapport kv1 2017
Delårsrapport kv1 2017
 
Interim report q1 2017
Interim report q1 2017Interim report q1 2017
Interim report q1 2017
 
Year end report 2016
Year end report 2016Year end report 2016
Year end report 2016
 
Bokslutskommuniké 2016
Bokslutskommuniké 2016Bokslutskommuniké 2016
Bokslutskommuniké 2016
 
Swedbank företagspresentation, 2 februari 2017
Swedbank företagspresentation, 2 februari 2017Swedbank företagspresentation, 2 februari 2017
Swedbank företagspresentation, 2 februari 2017
 
Swedbank corporate presentation, February 2 2017
Swedbank corporate presentation, February 2 2017Swedbank corporate presentation, February 2 2017
Swedbank corporate presentation, February 2 2017
 
Swedbank företagspresentation, 25 oktober 2016
Swedbank företagspresentation, 25 oktober 2016Swedbank företagspresentation, 25 oktober 2016
Swedbank företagspresentation, 25 oktober 2016
 
Swedbank Corporate Presentation, June 30 2016
Swedbank Corporate Presentation, June 30 2016Swedbank Corporate Presentation, June 30 2016
Swedbank Corporate Presentation, June 30 2016
 
Swedbank företagspresentation, 30 juni 2016
Swedbank företagspresentation, 30 juni 2016Swedbank företagspresentation, 30 juni 2016
Swedbank företagspresentation, 30 juni 2016
 
Swedbank corporate presentation Q1, 2016
Swedbank corporate presentation Q1, 2016Swedbank corporate presentation Q1, 2016
Swedbank corporate presentation Q1, 2016
 
Swedbank företagspresentation kvartal 1, 2016.
Swedbank företagspresentation kvartal 1, 2016.Swedbank företagspresentation kvartal 1, 2016.
Swedbank företagspresentation kvartal 1, 2016.
 
Swedbank corporate presentation Q4, 2015
Swedbank corporate presentation Q4, 2015Swedbank corporate presentation Q4, 2015
Swedbank corporate presentation Q4, 2015
 
Swedbank företagspresentation kvartal 4,2015
Swedbank företagspresentation kvartal 4,2015Swedbank företagspresentation kvartal 4,2015
Swedbank företagspresentation kvartal 4,2015
 
Year end report 2015
Year end report 2015Year end report 2015
Year end report 2015
 
Bokslutskommuniké 2015
Bokslutskommuniké 2015Bokslutskommuniké 2015
Bokslutskommuniké 2015
 
Swedbank Företagspresentation, September 2015
Swedbank Företagspresentation, September 2015Swedbank Företagspresentation, September 2015
Swedbank Företagspresentation, September 2015
 
Swedbank Corporate Presentation, September 2015
Swedbank Corporate Presentation, September 2015Swedbank Corporate Presentation, September 2015
Swedbank Corporate Presentation, September 2015
 
Swedbank's third quarter 2015 results
Swedbank's third quarter 2015 resultsSwedbank's third quarter 2015 results
Swedbank's third quarter 2015 results
 

Recently uploaded

The Core Functions of the Bangko Sentral ng Pilipinas
The Core Functions of the Bangko Sentral ng PilipinasThe Core Functions of the Bangko Sentral ng Pilipinas
The Core Functions of the Bangko Sentral ng PilipinasCherylouCamus
 
NO1 WorldWide Love marriage specialist baba ji Amil Baba Kala ilam powerful v...
NO1 WorldWide Love marriage specialist baba ji Amil Baba Kala ilam powerful v...NO1 WorldWide Love marriage specialist baba ji Amil Baba Kala ilam powerful v...
NO1 WorldWide Love marriage specialist baba ji Amil Baba Kala ilam powerful v...Amil baba
 
Call Girls Near Me WhatsApp:+91-9833363713
Call Girls Near Me WhatsApp:+91-9833363713Call Girls Near Me WhatsApp:+91-9833363713
Call Girls Near Me WhatsApp:+91-9833363713Sonam Pathan
 
Stock Market Brief Deck FOR 4/17 video.pdf
Stock Market Brief Deck FOR 4/17 video.pdfStock Market Brief Deck FOR 4/17 video.pdf
Stock Market Brief Deck FOR 4/17 video.pdfMichael Silva
 
NO1 Certified Ilam kala Jadu Specialist Expert In Bahawalpur, Sargodha, Sialk...
NO1 Certified Ilam kala Jadu Specialist Expert In Bahawalpur, Sargodha, Sialk...NO1 Certified Ilam kala Jadu Specialist Expert In Bahawalpur, Sargodha, Sialk...
NO1 Certified Ilam kala Jadu Specialist Expert In Bahawalpur, Sargodha, Sialk...Amil Baba Dawood bangali
 
Economic Risk Factor Update: April 2024 [SlideShare]
Economic Risk Factor Update: April 2024 [SlideShare]Economic Risk Factor Update: April 2024 [SlideShare]
Economic Risk Factor Update: April 2024 [SlideShare]Commonwealth
 
Authentic No 1 Amil Baba In Pakistan Authentic No 1 Amil Baba In Karachi No 1...
Authentic No 1 Amil Baba In Pakistan Authentic No 1 Amil Baba In Karachi No 1...Authentic No 1 Amil Baba In Pakistan Authentic No 1 Amil Baba In Karachi No 1...
Authentic No 1 Amil Baba In Pakistan Authentic No 1 Amil Baba In Karachi No 1...First NO1 World Amil baba in Faisalabad
 
Bladex Earnings Call Presentation 1Q2024
Bladex Earnings Call Presentation 1Q2024Bladex Earnings Call Presentation 1Q2024
Bladex Earnings Call Presentation 1Q2024Bladex
 
Current Economic situation of Pakistan .pptx
Current Economic situation of Pakistan .pptxCurrent Economic situation of Pakistan .pptx
Current Economic situation of Pakistan .pptxuzma244191
 
(办理原版一样)QUT毕业证昆士兰科技大学毕业证学位证留信学历认证成绩单补办
(办理原版一样)QUT毕业证昆士兰科技大学毕业证学位证留信学历认证成绩单补办(办理原版一样)QUT毕业证昆士兰科技大学毕业证学位证留信学历认证成绩单补办
(办理原版一样)QUT毕业证昆士兰科技大学毕业证学位证留信学历认证成绩单补办fqiuho152
 
(办理学位证)加拿大萨省大学毕业证成绩单原版一比一
(办理学位证)加拿大萨省大学毕业证成绩单原版一比一(办理学位证)加拿大萨省大学毕业证成绩单原版一比一
(办理学位证)加拿大萨省大学毕业证成绩单原版一比一S SDS
 
The Triple Threat | Article on Global Resession | Harsh Kumar
The Triple Threat | Article on Global Resession | Harsh KumarThe Triple Threat | Article on Global Resession | Harsh Kumar
The Triple Threat | Article on Global Resession | Harsh KumarHarsh Kumar
 
House of Commons ; CDC schemes overview document
House of Commons ; CDC schemes overview documentHouse of Commons ; CDC schemes overview document
House of Commons ; CDC schemes overview documentHenry Tapper
 
Stock Market Brief Deck for "this does not happen often".pdf
Stock Market Brief Deck for "this does not happen often".pdfStock Market Brief Deck for "this does not happen often".pdf
Stock Market Brief Deck for "this does not happen often".pdfMichael Silva
 
Economics, Commerce and Trade Management: An International Journal (ECTIJ)
Economics, Commerce and Trade Management: An International Journal (ECTIJ)Economics, Commerce and Trade Management: An International Journal (ECTIJ)
Economics, Commerce and Trade Management: An International Journal (ECTIJ)ECTIJ
 
Classical Theory of Macroeconomics by Adam Smith
Classical Theory of Macroeconomics by Adam SmithClassical Theory of Macroeconomics by Adam Smith
Classical Theory of Macroeconomics by Adam SmithAdamYassin2
 
Lundin Gold April 2024 Corporate Presentation v4.pdf
Lundin Gold April 2024 Corporate Presentation v4.pdfLundin Gold April 2024 Corporate Presentation v4.pdf
Lundin Gold April 2024 Corporate Presentation v4.pdfAdnet Communications
 
call girls in Nand Nagri (DELHI) 🔝 >༒9953330565🔝 genuine Escort Service 🔝✔️✔️
call girls in  Nand Nagri (DELHI) 🔝 >༒9953330565🔝 genuine Escort Service 🔝✔️✔️call girls in  Nand Nagri (DELHI) 🔝 >༒9953330565🔝 genuine Escort Service 🔝✔️✔️
call girls in Nand Nagri (DELHI) 🔝 >༒9953330565🔝 genuine Escort Service 🔝✔️✔️9953056974 Low Rate Call Girls In Saket, Delhi NCR
 

Recently uploaded (20)

The Core Functions of the Bangko Sentral ng Pilipinas
The Core Functions of the Bangko Sentral ng PilipinasThe Core Functions of the Bangko Sentral ng Pilipinas
The Core Functions of the Bangko Sentral ng Pilipinas
 
NO1 WorldWide Love marriage specialist baba ji Amil Baba Kala ilam powerful v...
NO1 WorldWide Love marriage specialist baba ji Amil Baba Kala ilam powerful v...NO1 WorldWide Love marriage specialist baba ji Amil Baba Kala ilam powerful v...
NO1 WorldWide Love marriage specialist baba ji Amil Baba Kala ilam powerful v...
 
Call Girls Near Me WhatsApp:+91-9833363713
Call Girls Near Me WhatsApp:+91-9833363713Call Girls Near Me WhatsApp:+91-9833363713
Call Girls Near Me WhatsApp:+91-9833363713
 
Stock Market Brief Deck FOR 4/17 video.pdf
Stock Market Brief Deck FOR 4/17 video.pdfStock Market Brief Deck FOR 4/17 video.pdf
Stock Market Brief Deck FOR 4/17 video.pdf
 
NO1 Certified Ilam kala Jadu Specialist Expert In Bahawalpur, Sargodha, Sialk...
NO1 Certified Ilam kala Jadu Specialist Expert In Bahawalpur, Sargodha, Sialk...NO1 Certified Ilam kala Jadu Specialist Expert In Bahawalpur, Sargodha, Sialk...
NO1 Certified Ilam kala Jadu Specialist Expert In Bahawalpur, Sargodha, Sialk...
 
Economic Risk Factor Update: April 2024 [SlideShare]
Economic Risk Factor Update: April 2024 [SlideShare]Economic Risk Factor Update: April 2024 [SlideShare]
Economic Risk Factor Update: April 2024 [SlideShare]
 
Authentic No 1 Amil Baba In Pakistan Authentic No 1 Amil Baba In Karachi No 1...
Authentic No 1 Amil Baba In Pakistan Authentic No 1 Amil Baba In Karachi No 1...Authentic No 1 Amil Baba In Pakistan Authentic No 1 Amil Baba In Karachi No 1...
Authentic No 1 Amil Baba In Pakistan Authentic No 1 Amil Baba In Karachi No 1...
 
Bladex Earnings Call Presentation 1Q2024
Bladex Earnings Call Presentation 1Q2024Bladex Earnings Call Presentation 1Q2024
Bladex Earnings Call Presentation 1Q2024
 
🔝+919953056974 🔝young Delhi Escort service Pusa Road
🔝+919953056974 🔝young Delhi Escort service Pusa Road🔝+919953056974 🔝young Delhi Escort service Pusa Road
🔝+919953056974 🔝young Delhi Escort service Pusa Road
 
Current Economic situation of Pakistan .pptx
Current Economic situation of Pakistan .pptxCurrent Economic situation of Pakistan .pptx
Current Economic situation of Pakistan .pptx
 
(办理原版一样)QUT毕业证昆士兰科技大学毕业证学位证留信学历认证成绩单补办
(办理原版一样)QUT毕业证昆士兰科技大学毕业证学位证留信学历认证成绩单补办(办理原版一样)QUT毕业证昆士兰科技大学毕业证学位证留信学历认证成绩单补办
(办理原版一样)QUT毕业证昆士兰科技大学毕业证学位证留信学历认证成绩单补办
 
(办理学位证)加拿大萨省大学毕业证成绩单原版一比一
(办理学位证)加拿大萨省大学毕业证成绩单原版一比一(办理学位证)加拿大萨省大学毕业证成绩单原版一比一
(办理学位证)加拿大萨省大学毕业证成绩单原版一比一
 
The Triple Threat | Article on Global Resession | Harsh Kumar
The Triple Threat | Article on Global Resession | Harsh KumarThe Triple Threat | Article on Global Resession | Harsh Kumar
The Triple Threat | Article on Global Resession | Harsh Kumar
 
House of Commons ; CDC schemes overview document
House of Commons ; CDC schemes overview documentHouse of Commons ; CDC schemes overview document
House of Commons ; CDC schemes overview document
 
Stock Market Brief Deck for "this does not happen often".pdf
Stock Market Brief Deck for "this does not happen often".pdfStock Market Brief Deck for "this does not happen often".pdf
Stock Market Brief Deck for "this does not happen often".pdf
 
Economics, Commerce and Trade Management: An International Journal (ECTIJ)
Economics, Commerce and Trade Management: An International Journal (ECTIJ)Economics, Commerce and Trade Management: An International Journal (ECTIJ)
Economics, Commerce and Trade Management: An International Journal (ECTIJ)
 
Classical Theory of Macroeconomics by Adam Smith
Classical Theory of Macroeconomics by Adam SmithClassical Theory of Macroeconomics by Adam Smith
Classical Theory of Macroeconomics by Adam Smith
 
Monthly Economic Monitoring of Ukraine No 231, April 2024
Monthly Economic Monitoring of Ukraine No 231, April 2024Monthly Economic Monitoring of Ukraine No 231, April 2024
Monthly Economic Monitoring of Ukraine No 231, April 2024
 
Lundin Gold April 2024 Corporate Presentation v4.pdf
Lundin Gold April 2024 Corporate Presentation v4.pdfLundin Gold April 2024 Corporate Presentation v4.pdf
Lundin Gold April 2024 Corporate Presentation v4.pdf
 
call girls in Nand Nagri (DELHI) 🔝 >༒9953330565🔝 genuine Escort Service 🔝✔️✔️
call girls in  Nand Nagri (DELHI) 🔝 >༒9953330565🔝 genuine Escort Service 🔝✔️✔️call girls in  Nand Nagri (DELHI) 🔝 >༒9953330565🔝 genuine Escort Service 🔝✔️✔️
call girls in Nand Nagri (DELHI) 🔝 >༒9953330565🔝 genuine Escort Service 🔝✔️✔️
 

Purchasing Managers’ Index - Report - 2010 August

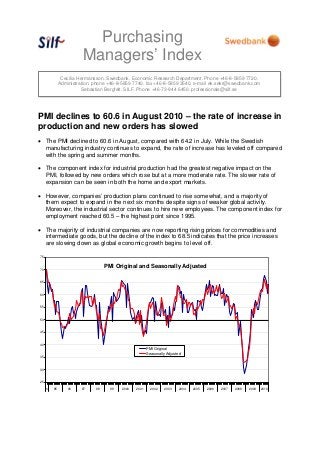
  • 1. Purchasing Managers’ Index Cecilia Hermansson. Swedbank. Economic Research Department. Phone +46-8-5859 7720. Administration. phone +46-8-5859 7740. fax +46-8-5859 3540. e-mail ek.sekr@swedbank.com Sebastian Bergfelt. SILF. Phone +46-73-944 6450. professionals@silf.se PMI declines to 60.6 in August 2010 – the rate of increase in production and new orders has slowed • The PMI declined to 60.6 in August, compared with 64.2 in July. While the Swedish manufacturing industry continues to expand, the rate of increase has leveled off compared with the spring and summer months. • The component index for industrial production had the greatest negative impact on the PMI, followed by new orders which rose but at a more moderate rate. The slower rate of expansion can be seen in both the home and export markets. • However, companies’ production plans continued to rise somewhat, and a majority of them expect to expand in the next six months despite signs of weaker global activity. Moreover, the industrial sector continues to hire new employees. The component index for employment reached 60.5 – the highest point since 1995. • The majority of industrial companies are now reporting rising prices for commodities and intermediate goods, but the decline of the index to 68.5 indicates that the price increases are slowing down as global economic growth begins to level off. 25 30 35 40 45 50 55 60 65 70 75 94 95 96 97 98 99 2000 2001 2002 2003 2004 2005 2006 2007 2008 2009 2010 PMI Original Seasonally Adjusted PMI Original and Seasonally Adjusted
  • 2. 2 (4) Silf/Swedbanks’ Purchasing Managers’ Index. seasonally adjusted PMI Components of PMI Other indices Forecast Total New Produc- Employ- Delivery Export Domestic Back-log Planned Index orders tion ment times Inventories orders orders of orders Prices Import Production 2007 Jul 60.5 63.0 65.6 54.0 64.4 53.1 62.7 59.7 56.3 67.8 64.1 71.8 Aug 56.8 57.3 58.4 54.9 61.0 52.3 59.2 54.1 55.8 63.0 55.7 70.2 Sep 58.2 62.0 59.2 56.7 59.6 55.0 61.0 56.4 60.0 59.0 58.1 72.1 Oct 59.4 61.0 63.7 57.1 60.2 52.8 59.1 58.9 62.7 62.3 59.0 72.5 Nov 55.1 54.7 57.4 55.7 57.5 53.1 53.3 54.5 53.7 60.4 55.7 69.2 Dec 55.5 57.1 58.3 53.8 55.5 53.1 57.7 55.0 60.2 62.7 56.4 69.7 2008 Jan 54.6 53.6 55.2 55.4 58.2 50.5 54.2 54.5 51.5 65.6 55.7 67.8 Feb 55.7 56.9 60.2 52.5 55.6 52.6 56.1 57.9 57.9 67.5 59.2 64.4 Mar 54.7 56.5 56.8 51.9 57.0 53.5 56.9 51.6 51.5 70.4 56.5 63.9 Apr 50.1 47.1 54.0 48.0 52.0 48.9 46.4 49.7 47.1 69.6 52.1 61.9 May 51.2 51.3 53.4 48.6 51.1 49.0 50.9 50.7 52.0 74.3 56.2 59.9 Jun 50.6 50.3 53.9 47.8 51.8 52.2 52.5 46.7 49.0 75.6 56.2 64.7 Jul 48.6 46.0 53.6 45.5 50.4 53.1 46.6 44.6 42.7 76.8 58.5 58.7 Aug 46.4 42.7 47.8 44.2 51.0 49.1 44.0 43.3 43.0 70.2 51.2 49.5 Sep 42.3 38.7 41.3 42.6 42.5 45.4 40.9 38.0 39.7 55.1 48.7 47.4 Oct 39.0 34.8 39.1 39.8 35.9 45.7 37.0 35.4 36.0 38.2 44.5 39.5 Nov 33.1 26.0 31.0 36.5 31.0 43.6 29.4 25.8 28.1 29.4 37.5 31.8 Dec 32.7 26.1 31.0 33.5 28.6 38.9 26.3 23.3 25.7 27.9 32.3 26.3 2009 Jan 33.8 29.0 33.3 32.1 30.3 41.8 34.2 27.9 25.9 29.1 35.5 32.9 Feb 33.9 28.8 34.0 31.0 28.4 36.6 29.7 30.5 29.7 30.4 33.5 35.8 Mar 36.7 35.1 38.8 31.1 28.0 39.6 39.7 35.5 30.8 27.7 38.5 38.2 Apr 38.8 41.5 39.4 28.3 29.6 35.9 45.3 37.7 39.7 30.6 38.8 42.4 May 43.7 46.4 47.4 31.1 34.2 33.5 47.5 44.1 42.8 32.7 41.0 47.3 Jun 50.5 54.7 55.8 36.0 42.4 34.0 54.4 49.2 47.4 43.3 47.3 55.2 Jul 54.3 60.5 61.0 40.3 44.4 38.4 56.4 58.1 54.1 46.9 51.0 59.1 Aug 52.4 57.8 56.1 40.6 46.4 40.4 61.1 50.1 54.3 52.6 50.7 61.7 Sep 55.9 59.2 60.5 45.0 53.7 40.6 61.1 55.0 54.0 54.5 55.7 63.3 Oct 56.7 60.8 61.7 43.8 56.2 41.6 60.7 55.8 58.9 56.7 55.8 62.2 Nov 56.0 57.9 59.0 48.7 55.0 41.3 59.7 53.6 53.6 59.8 57.0 62.2 Dec 58.2 63.7 59.7 49.5 56.3 42.7 58.1 66.3 56.6 57.3 59.0 67.4 2010 Jan 61.7 66.8 70.2 49.6 61.5 48.3 62.3 64.8 62.6 61.2 61.3 69.5 Feb 61.5 67.5 65.3 55.0 61.4 53.6 62.7 63.6 64.2 61.3 59.7 68.1 Mar 61.1 63.8 63.7 54.9 67.0 50.2 62.3 58.9 60.6 65.7 62.3 69.6 Apr 64.0 68.1 66.3 56.6 68.3 46.0 64.6 63.2 62.5 75.6 60.3 77.5 May 66.0 68.8 71.0 60.1 71.5 50.7 62.6 64.1 64.3 71.0 59.9 73.0 Jun 62.4 61.1 66.8 60.3 69.2 50.4 57.4 60.1 60.9 71.1 59.5 73.1 Jul 64.2 67.3 72.2 56.3 66.4 51.4 61.4 63.2 63.4 70.9 60.9 72.0 Aug 60.6 61.8 61.9 60.5 64.5 52.0 57.4 58.7 59.7 68.5 56.1 72.4
  • 3. 3 (4) Silf/Swedbanks’ Purchasing Managers’ Index PMI Components of PMI Other indices Forecast Total New- Produc- Employ- Delivery Export Domestic Back-log Planned Index orders tion ment times Inventories orders orders of orders Prices Import Production 2007 Jul 55.7 56.6 54.1 54.1 65.8 54.9 58.6 53.7 54.5 66.0 58.7 70.5 Aug 59.9 61.7 64.5 55.7 62.6 53.1 61.7 58.8 60.9 62.7 58.1 72.4 Sep 59.4 62.2 61.9 57.7 61.5 54.6 60.5 58.2 59.5 60.6 59.4 71.1 Oct 58.5 58.6 62.8 56.4 60.6 51.3 56.3 57.6 58.4 62.7 57.4 69.9 Nov 53.3 51.2 55.0 54.7 55.9 50.9 50.3 52.4 49.1 58.3 54.2 67.1 Dec 51.8 51.7 52.6 51.2 52.1 49.7 53.4 50.3 54.9 59.4 53.8 68.6 2008 Jan 52.7 52.3 52.6 52.9 54.4 48.9 53.8 52.0 50.6 64.6 54.7 68.9 Feb 56.5 59.9 61.4 51.5 53.6 51.5 59.5 59.2 60.5 67.5 59.7 66.5 Mar 56.0 59.4 59.6 51.2 56.5 54.4 59.3 52.9 54.4 71.3 58.3 65.8 Apr 51.9 49.4 57.2 49.4 52.7 50.0 47.9 51.5 49.1 73.0 53.7 63.6 May 52.5 52.7 55.3 50.3 52.7 51.0 51.9 52.0 54.0 77.5 57.9 59.7 Jun 52.9 53.4 57.4 50.3 53.7 55.5 55.0 49.7 50.7 76.0 58.0 62.5 Jul 43.8 39.6 42.1 45.6 51.8 54.9 42.5 38.6 40.9 75.0 53.1 57.4 Aug 49.3 46.7 53.6 44.7 52.7 49.7 46.2 47.7 47.7 69.9 53.4 51.0 Sep 43.2 38.5 43.4 43.4 44.0 44.7 40.1 39.3 38.8 55.6 49.7 45.8 Oct 37.7 31.9 37.8 38.9 35.7 44.0 33.8 33.6 31.3 36.6 42.5 36.0 Nov 30.7 21.8 27.9 35.2 28.8 41.1 25.7 22.9 22.9 25.3 35.3 28.8 Dec 28.6 20.2 24.8 30.6 24.6 35.1 21.5 17.9 19.9 22.9 28.9 24.3 2009 Jan 31.7 27.6 30.5 29.4 26.3 40.1 34.0 25.2 24.7 26.9 34.0 33.9 Feb 34.8 32.0 35.3 29.9 26.3 35.2 33.1 32.1 32.5 29.7 33.7 38.2 Mar 38.3 38.7 42.1 30.5 27.5 40.5 42.8 37.5 34.2 28.2 40.6 40.7 Apr 41.1 44.8 43.2 29.7 30.6 36.8 47.8 40.4 42.6 34.1 40.6 45.1 May 45.8 49.0 50.3 33.1 36.5 35.3 49.6 46.6 45.9 36.5 43.2 48.3 Jun 53.9 59.4 60.8 39.1 45.5 37.3 58.3 53.5 50.3 45.1 50.0 54.6 Jul 50.7 55.7 51.3 40.8 46.9 40.7 53.5 53.6 53.1 47.4 47.3 59.2 Aug 56.2 62.9 62.9 41.9 49.3 41.5 64.6 55.3 60.2 54.5 53.9 64.7 Sep 57.7 59.9 63.6 46.7 56.6 40.4 61.2 57.1 54.0 57.0 57.8 62.9 Oct 56.1 58.6 61.1 43.6 57.2 40.4 58.1 54.7 55.0 56.8 54.7 59.6 Nov 53.9 53.8 56.1 48.1 53.5 39.3 56.1 50.8 48.5 56.9 55.4 59.5 Dec 54.2 57.9 53.5 47.2 52.8 39.3 61.6 52.8 50.8 52.8 56.0 65.7 2010 Jan 59.7 65.4 67.7 47.2 57.9 49.2 61.7 62.3 61.5 59.4 60.1 70.6 Feb 62.2 70.4 66.3 54.3 59.4 52.9 65.5 65.0 66.9 60.6 59.8 70.2 Mar 62.4 66.7 66.4 54.5 66.6 51.4 64.8 60.3 63.4 66.1 64.2 71.6 Apr 66.0 70.9 69.6 58.0 69.2 46.8 66.6 65.4 64.9 79.3 61.7 79.9 May 67.8 70.8 73.6 62.1 73.6 52.5 64.0 66.1 66.9 74.4 61.6 73.4 Jun 65.3 64.9 71.2 63.2 71.8 53.6 60.4 63.7 63.2 72.5 61.6 72.0 Jul 60.3 62.1 62.4 56.3 68.2 53.6 58.0 58.4 62.1 70.8 56.8 71.6 Aug 63.9 66.3 68.0 61.5 66.7 53.0 60.4 63.4 65.1 69.7 58.7 75.0
  • 4. 4 (4) Silf/Swedbank’s Purchasing Managers’ Index - objectives and methodology History Silf (earlier I&L) and Swedbank AB. publ. (at that time Sparbanken Sweden) make the first joint – internal – calculation of the “Purchasing Managers’ Index” for the five indexes (PMI) in December 1994. Exactly one year later, the index was publicly announced for the first time. In Sweden the Purchasing Managers’ Index is known as the ICI index. The model for PMI is the ISM index (Institute for Supply Management, formerly known as the NAPM index) – one of the most highly regarded and well-recognized economic indicators in the United States. The ISM index has existed since 1931 in the form of its predecessor, the NAPM index. Participants About 200 purchasing managers in the manufacturing industry. Publication First weekday of each month. 8:30 am. Analysis Period Comparison with previous month. Composition of PMI (%) New orders (within the company) 30 Production (within the company) 25 Employment (within the company) 20 Suppliers’ Delivery Times 15 Inventories (purchased material) 10 Other leading indicators New Export Orders (not included in PMI) New Domestic Orders Backlog of Orders Suppliers’ commodity and intermediate goods prices Imports Production Plans next six months Other questions Reason for higher/lower inventories level Important commodities and intermediate goods with rising/falling prices Objective Quick economic indicator Simple statistics Statistics with relatively short publication intervals Constant contact with well-informed professional group Calculation According to “diffusion index”. Positive changes are noted in percent for the five sub indexes. The percentage of unchanged replies, multiplied by 0.5, is added to this figure. Then the different sub indexes are weighted as described above to reach the total index. The Purchasing Managers’ Index does not indicate activity levels but rather monthly changes in industrial activity. “Break-even” The dividing line between growth and decline – in line with US praxis – has been drawn at a total index of 50. However, this boundary or “neutral growth zone” should not be applied excessively. Rather, “Break-even” at 50 indicates a target value. We believe we have used reliable sources and procedures to generate and analyze the Purchasing Managers’ Index (PMI – in Sweden ICI). However, Swedbank AB (publ) and SILF (earlier Organisationen för Inköp och Logistik, /I&L/ – The Organization for Purchasing and Logistics) cannot guarantee the accuracy or completeness of the analyses and cannot be responsible for any errors or omissions in the basic data or processing thereof. The reader should base any decisions on other background material as well. Swedbank AB (publ), SILF. their employees, and other coworkers accept no liability whatsoever for any direct or consequential loss or injury of any kind arising from any errors or omissions in the analyses presented in the Purchasing Managers’ Index.