The Abortion pills for sale in Qatar@Doha [+27737758557] []Deira Dubai Kuwait
Purchasing Managers' Index January 2012
1. Purchasing Managers Index February 1, 2012
PMI rises to 51.4 in January 2012 – slightly warmer
economic breezes in industry
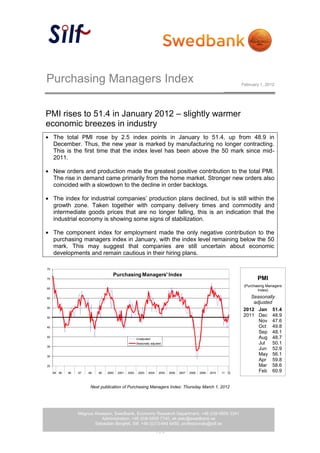
The total PMI rose by 2.5 index points in January to 51.4, up from 48.9 in
December. Thus, the new year is marked by manufacturing no longer contracting.
This is the first time that the index level has been above the 50 mark since mid-
2011.
New orders and production made the greatest positive contribution to the total PMI.
The rise in demand came primarily from the home market. Stronger new orders also
coincided with a slowdown to the decline in order backlogs.
The index for industrial companies’ production plans declined, but is still within the
growth zone. Taken together with company delivery times and commodity and
intermediate goods prices that are no longer falling, this is an indication that the
industrial economy is showing some signs of stabilization.
The component index for employment made the only negative contribution to the
purchasing managers index in January, with the index level remaining below the 50
mark. This may suggest that companies are still uncertain about economic
developments and remain cautious in their hiring plans.
75
Purchasing Managers' Index
70 PMI
(Purchasing Managers
65
Index)
60 Seasonally
adjusted
55
2012 Jan 51.4
50
2011 Dec 48.9
Nov 47.6
45 Oct 49.8
Sep 48.1
40
Unadjusted Aug 48.7
Seasonally adjusted Jul 50.1
35
Jun 52.9
30
May 56.1
Apr 59.8
25 Mar 58.6
94 95 96 97 98 99 2000 2001 2002 2003 2004 2005 2006 2007 2008 2009 2010 11 12
Feb 60.9
jan 61,5
Next publication of Purchasing Managers Index: Thursday March 1, 2012
apr 64,0
Magnus Alvesson, Swedbank, Economic Research Department, +46 (0)8-5859 3341
Administration, +46 (0)8-5859 7740, ek.sekr@swedbank.se
Sebastian Bergfelt, Silf, +46 (0)73-944 6450, professionals@silf.se
1 (4)