Swedbank Commodity Price Index Falls on Economic Uncertainty
•
0 gostou•262 visualizações

Energy & Commodities, No.8 - October 25, 2011

Recomendados
Recomendados
Mais conteúdo relacionado
Mais procurados
Mais procurados (20)
Destaque
Destaque (7)
Semelhante a Swedbank Commodity Price Index Falls on Economic Uncertainty
Semelhante a Swedbank Commodity Price Index Falls on Economic Uncertainty (18)
Mais de Swedbank
Mais de Swedbank (20)
Último
Último (20)
Swedbank Commodity Price Index Falls on Economic Uncertainty
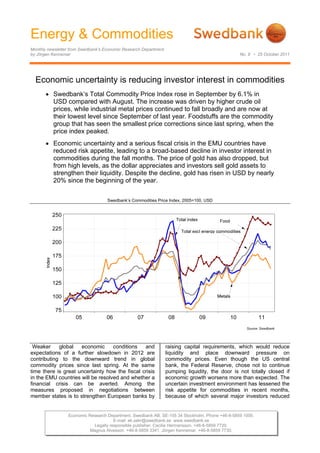
- 1. Energy & Commodities Monthly newsletter from Swedbank’s Economic Research Department by Jörgen Kennemar No. 8 • 25 October 2011 Economic uncertainty is reducing investor interest in commodities Swedbank’s Total Commodity Price Index rose in September by 6.1% in USD compared with August. The increase was driven by higher crude oil prices, while industrial metal prices continued to fall broadly and are now at their lowest level since September of last year. Foodstuffs are the commodity group that has seen the smallest price corrections since last spring, when the price index peaked. Economic uncertainty and a serious fiscal crisis in the EMU countries have reduced risk appetite, leading to a broad-based decline in investor interest in commodities during the fall months. The price of gold has also dropped, but from high levels, as the dollar appreciates and investors sell gold assets to strengthen their liquidity. Despite the decline, gold has risen in USD by nearly 20% since the beginning of the year. Swedbank’s Commodities Price Index, 2005=100, USD Weaker global economic conditions and raising capital requirements, which would reduce expectations of a further slowdown in 2012 are liquidity and place downward pressure on contributing to the downward trend in global commodity prices. Even though the US central commodity prices since last spring. At the same bank, the Federal Reserve, chose not to continue time there is great uncertainty how the fiscal crisis pumping liquidity, the door is not totally closed if in the EMU countries will be resolved and whether a economic growth worsens more than expected. The financial crisis can be averted. Among the uncertain investment environment has lessened the measures proposed in negotiations between risk appetite for commodities in recent months, member states is to strengthen European banks by because of which several major investors reduced Economic Research Department. Swedbank AB. SE-105 34 Stockholm. Phone +46-8-5859 1000. E-mail: ek.sekr@swedbank.se www.swedbank.se Legally responsible publisher: Cecilia Hermansson. +46-8-5859 7720. Magnus Alvesson. +46-8-5859 3341. Jörgen Kennemar. +46-8-5859 7730.
- 2. Energy & Commodities Monthly newsletter from Swedbank’s Economic Research Department, continued No. 8 • 25 October 2011 their exposure in September. Since April of last Aluminium is the base metal with the most stable year, Swedbank’s Total Commodity Price Index has price trend and the most modest price decline since fallen by 11% in USD and by slightly over 7% in the beginning of the year. euro, though it is still at higher levels than last year. Metal price trend, 1 January 2011=100 Swedbank’s Total Commodity Price Index rose by 6.1% in September after declining 5.1% in the previous month. The volatile trend between these two months is largely due to the price of crude oil. In June-October Brent crude oil fluctuated around USD 105-120 a barrel, raising the question of whether financial flows or fundamental factors are contributing to the price variations. Because of the economic slowdown, global oil consumption is now is expected to rise by 1 million barrels this year, compared with last spring’s forecast of 1.4 million barrels. This compares with an increase of 3.2 million barrels last year, which was an effect of the 2009 recession. At the same time the oil market is facing relatively tight supply conditions. In 2011 oil inventories have begun to decline at the same time We expect demand for metals to slow as global that consumption in emerging economies continues growth and the rate of investment decelerates in to rise at a rapid rate. 2011 and 2012. The decisive factor for future metal prices is whether emerging economies, led by Global oil production and consumption, % change China, can adjust to weaker demand from the US and Europe. A major decline in Asia would have a marked impact on the commodity market, where China accounts for slightly over 40% of global metal consumption. GDP growth during the third quarter was 9.1%, a high level but lower than in preceding quarters. As yet there are no explicit signs of a major slowdown in metal consumption. There are also expectations that Chinese austerity policies are nearing an end, especially considering the current global uncertainty, which should raise the price of industrial metals. This requires lower Chinese inflation, however, which in September was still at the upper end of the government’s target range. Insufficient capacity expansion and strikes in several commodity-producing countries could also Broad price decline for industrial metals as limit the decline in metal prices. Chilean copper industrial activity slows production, which represents just over one third of the global total, has decreased in 2011 due to Swedbank’s Commodity Price Index excluding production disruptions and poor weather conditions. energy commodities is clearly trending lower and in September fell for the second consecutive month. A The price of iron ore, which is set quarterly based further decline in prices in October has put the on actual spot prices, has fluctuated less than index, adjusted for energy commodities, at its industrial metals that are priced daily on global lowest level in over 12 months. The biggest price markets. Steel production plays a critical role in this decline in recent months has been in economically respect, and iron ore is an important ingredient in sensitive industrial metals. They co-vary well with producing steel. During the first nine months of the the purchasing managers index, which is falling in year global steel production rose by slightly over 8% the US, Europe and China. At the time of writing the compared with the same period last year, with USD prices of nickel, zinc and copper are 25-30% China accounting for around half of global steel lower than the beginning of the year. The price production. decline for metals is occurring at the same time that inventories are rising, with lead and zinc inventories reaching new record levels in September. 2 (4)
- 3. Energy & Commodities Monthly newsletter from Swedbank’s Economic Research Department, continued No. 8 • 25 October 2011 Supply shortages are keeping food prices nominal terms at just over USD 1 900 per troy high ounce. Since then the price in USD has fallen by 13%, but gold still remains among the metals with Global food prices remain at historically high levels the strongest gains this year at nearly 20%. The despite weaker growth prospects. Lower than revaluation this fall is partly attributable to slower expected food production in several major liquidity growth in the global financial markets and commodity-producing countries and a growing partly to the Fed’s decision not to continue its population in already densely populated countries quantitative easing. Higher capital adequacy ratios are constraining food supplies. Until the end of and tighter capital requirements to invest in gold August the food price index was at a higher level contracts are also lowering the price of gold. We than three years ago. It wasn’t until September that believe that the biggest price gains for gold are prices began to fall, but remain 20% higher than a probably behind us. As long as global imbalances year ago in USD. In the US, which is the world's continue, however, gold will remain high with the largest exporter of grain and soybeans, production potential to rise further. Not until monetary policy is is expected to be lower than planned due to tightened will there be consistent downward extensive flooding. Already low grain inventories are pressure on the price of gold, which we do not pushing the prices of wheat, barley and corn higher foresee in the next 1-2 years. than we previously predicted. Extensive ethanol production is another reason for the price increase. Price trend for gold and industrial metals Consequently, higher food production is needed to meet growing global demand. Tight food supplies tend to lead to increased speculation, especially when cyclical commodities such as oil and metals face greater uncertainty. Devastating flooding in Thailand, the world's largest exporter of rice, raises the risk that inflation could accelerate, especially in economies where rice is a household staple. Estimates show that Thai rice production could be 20% lower in 2011, which would drive up global prices. Gold’s investment status is put to the test Investor interest in gold escalated in July and August, when the price reach new record levels in 3 (4)
- 4. Energy & Commodities Monthly newsletter from Swedbank’s Economic Research Department, continued No. 8 • 25 October 2011 Swedbank Commodity Index - US$ - Swedbank Commodity Index - SKr - Basis 2000 = 1oo 26-10-11 Basis 2000 = 1oo 26-10-11 7.2011 8.2011 9.2011 7.2011 8.2011 9.2011 T otal index 365.4 346.9 368.0 T otal index 253.4 241.3 268.8 Per cent change month ago 1.5 -5.1 6.1 Per cent change month ago 2.3 -4.8 11.4 Per cent change year ago 38.0 28.5 34.7 Per cent change year ago 18.8 12.8 28.4 T otal index exclusive energy 320.3 316.7 308.4 T otal index exclusive energy 222.1 220.3 225.3 Per cent change month ago 0.0 -1.1 -2.6 Per cent change month ago 0.8 -0.8 2.3 Per cent change year ago 25.0 19.2 12.6 Per cent change year ago 7.6 4.7 7.4 Food, tropical beverages 300.7 303.1 298.3 Food, tropical beverages 208.5 210.9 217.9 Per cent change month ago -0.3 0.8 -1.6 Per cent change month ago 0.5 1.1 3.3 Per cent change year ago 33.2 29.5 21.3 Per cent change year ago 14.7 13.7 15.6 Cereals 288.5 309.3 306.1 Cereals 200.1 215.2 223.6 Per cent change month ago -6.0 7.2 -1.0 Per cent change month ago -5.2 7.5 3.9 Per cent change year ago 49.2 43.5 27.5 Per cent change year ago 28.4 26.0 21.5 T ropical beverages and tobacco 323.9 322.2 317.4 T ropical beverages and tobacco 224.6 224.1 231.8 Per cent change month ago 1.6 -0.5 -1.5 Per cent change month ago 2.4 -0.2 3.4 Per cent change year ago 30.1 27.1 20.0 Per cent change year ago 12.0 11.5 14.4 Coffee 209.7 211.4 212.2 Coffee 145.4 147.1 155.0 Per cent change month ago -2.2 0.8 0.4 Per cent change month ago -1.4 1.1 5.4 Per cent change year ago 36.7 34.2 29.7 Per cent change year ago 17.7 17.8 23.6 Oilseeds and oil 258.5 257.7 251.9 Oilseeds and oil 179.3 179.3 184.0 Per cent change month ago -1.0 -0.3 -2.3 Per cent change month ago -0.2 0.0 2.6 Per cent change year ago 31.4 26.2 20.1 Per cent change year ago 13.1 10.8 14.5 Industrial raw materials 326.0 320.6 311.3 Industrial raw materials 226.1 223.0 227.4 Per cent change month ago 0.1 -1.7 -2.9 Per cent change month ago 0.8 -1.3 2.0 Per cent change year ago 23.0 16.7 10.5 Per cent change year ago 5.9 2.5 5.3 Agricultural raw materials 202.9 201.8 195.6 Agricultural raw materials 140.7 140.4 142.9 Per cent change month ago -1.6 -0.5 -3.1 Per cent change month ago -0.9 -0.2 1.8 Per cent change year ago 21.6 18.2 11.8 Per cent change year ago 4.7 3.8 6.5 Cotton 107.3 103.6 105.3 Cotton 74.4 72.1 76.9 Per cent change month ago -31.1 -3.4 1.6 Per cent change month ago -30.6 -3.1 6.7 Per cent change year ago 35.8 19.6 8.8 Per cent change year ago 16.9 5.0 3.7 Softwood 154.8 153.8 148.6 Softwood 107.4 107.0 108.5 Per cent change month ago -0.6 -0.6 -3.4 Per cent change month ago 0.2 -0.3 1.4 Per cent change year ago 3.8 2.5 -0.4 Per cent change year ago -10.6 -10.0 -5.1 W oodpulp 1017.6 994.2 967.2 W oodpulp 705.7 691.6 706.5 Per cent change month ago -0.1 -2.3 -2.7 Per cent change month ago 0.7 -2.0 2.1 Per cent change year ago 4.0 1.8 -0.5 Per cent change year ago -10.5 -10.6 -5.2 N on-ferrous metals 290.6 273.5 257.2 Non-ferrous metals 201.5 190.3 187.9 Per cent change month ago 2.7 -5.9 -6.0 Per cent change month ago 3.5 -5.6 -1.3 Per cent change year ago 35.3 17.6 5.5 Per cent change year ago 16.5 3.3 0.5 Copper 9618.8 9043.0 8314.3 Copper 6670.4 6290.8 6073.1 Per cent change month ago 6.2 -6.0 -8.1 Per cent change month ago 7.1 -5.7 -3.5 Per cent change year ago 42.8 24.2 7.9 Per cent change year ago 23.0 9.0 2.8 Aluminium 2512.0 2389.4 2296.3 Aluminium 1742.0 1662.2 1677.3 Per cent change month ago -1.5 -4.9 -3.9 Per cent change month ago -0.8 -4.6 0.9 Per cent change year ago 26.4 13.1 6.2 Per cent change year ago 8.8 -0.7 1.2 Lead 2682.0 2407.0 2297.9 Lead 1859.9 1674.4 1678.5 Per cent change month ago 6.6 -10.3 -4.5 Per cent change month ago 7.4 -10.0 0.2 Per cent change year ago 46.0 16.2 5.2 Per cent change year ago 25.7 2.0 0.3 Z inc 2390.0 2211.0 2076.4 Z inc 1657.4 1538.1 1516.7 Per cent change month ago 7.2 -7.5 -6.1 Per cent change month ago 8.0 -7.2 -1.4 Per cent change year ago 29.7 8.2 -3.5 Per cent change year ago 11.6 -5.0 -8.0 Nickel 23726.3 22044.0 20388.5 Nickel 16453.7 15335.0 14892.5 Per cent change month ago 6.3 -7.1 -7.5 Per cent change month ago 7.1 -6.8 -2.9 Per cent change year ago 21.6 3.2 -9.9 Per cent change year ago 4.7 -9.4 -14.2 Iron ore, steel scrap 740.3 757.0 759.8 Iron ore, steel scrap 513.4 526.6 555.0 Per cent change month ago -1.6 2.3 0.4 Per cent change month ago -0.8 2.6 5.4 Per cent change year ago 12.5 14.8 14.8 Per cent change year ago -3.1 0.8 9.4 Energy raw materials 385.4 360.3 394.5 Energy raw materials 267.3 250.6 288.1 Per cent change month ago 2.1 -6.5 9.5 Per cent change month ago 2.9 -6.2 15.0 Per cent change year ago 43.5 32.5 44.6 Per cent change year ago 23.5 16.3 37.8 Coking coal 459.8 460.9 465.7 Coking coal 318.9 320.6 340.2 Per cent change month ago 0.2 0.2 1.0 Per cent change month ago 1.0 0.6 6.1 Per cent change year ago 26.8 34.8 31.3 Per cent change year ago 9.2 18.3 25.1 Crude oil 382.0 355.7 391.2 Crude oil 264.9 247.4 285.7 Per cent change month ago 2.2 -6.9 10.0 Per cent change month ago 3.0 -6.6 15.5 Per cent change year ago 44.5 32.4 45.4 Per cent change year ago 24.4 16.2 38.6 Source : SW EDBAN K and HW W A-Institute for Economic Research Hamburg Source : SW ED BAN K and HW W A-Institute for Economic Research H amburg Swedbank Economic Research Department Swedbank’s monthly Energy & Commodities newsletter is published as a service to our customers. We believe that we have used reliable sources and methods in the preparation SE-105 34 Stockholm, Sweden of the analyses reported in this publication. However, we cannot guarantee the accuracy or Phone +46-8-5859 7740 completeness of the report and cannot be held responsible for any error or omission in the ek.sekr@swedbank.se underlying material or its use. Readers are encouraged to base any (investment) decisions www.swedbank.se on other material as well. Neither Swedbank nor its employees may be held responsible for Legally responsible publisher losses or damages, direct or indirect, owing to any errors or omissions in Swedbank’s Cecilia Hermansson, +46-88-5859 7720 monthly Energy & Commodities newsletter. Magnus Alvesson, +46-8-5859 3341 Jörgen Kennemar, +46-8-5859 7730 4 (4)