Energy & Commodities, 2010 regarding March
•
0 gostou•244 visualizações

This document is a monthly newsletter from Swedbank's Economic Research Department discussing commodity prices and trends. The key points are: 1) Global commodity prices increased broadly in March, with metals seeing the biggest gains. Food prices continued falling for the second month. 2) Rapidly rising commodity prices, especially for iron ore and steel, will test the strength of the global economic recovery as companies face higher costs. 3) Commodity price increases are being driven by strong demand in Asia and expansive economic policies, but budget issues and overheating concerns in emerging markets may lead prices to cool later in the year.

Recomendados
Recomendados
Mais conteúdo relacionado
Mais procurados
Mais procurados (20)
Destaque
Semelhante a Energy & Commodities, 2010 regarding March
Semelhante a Energy & Commodities, 2010 regarding March (20)
Mais de Swedbank
Mais de Swedbank (20)
Último
Último (20)
Energy & Commodities, 2010 regarding March
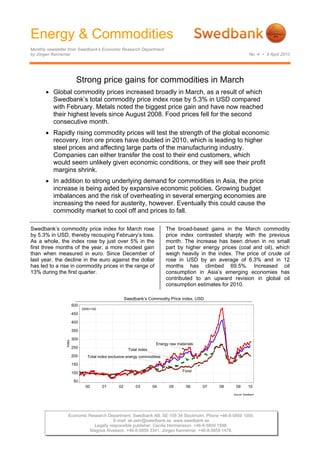
- 1. Energy & Commodities Monthly newsletter from Swedbank’s Economic Research Department by Jörgen Kennemar No. 4 • 9 April 2010 Economic Research Department. Swedbank AB. SE-105 34 Stockholm. Phone +46-8-5859 1000. E-mail: ek.sekr@swedbank.se www.swedbank.se Legally responsible publisher: Cecilia Hermansson. +46-8-5859 1588. Magnus Alvesson. +46-8-5859 3341. Jörgen Kennemar. +46-8-5859 1478. Strong price gains for commodities in March • Global commodity prices increased broadly in March, as a result of which Swedbank’s total commodity price index rose by 5.3% in USD compared with February. Metals noted the biggest price gain and have now reached their highest levels since August 2008. Food prices fell for the second consecutive month. • Rapidly rising commodity prices will test the strength of the global economic recovery. Iron ore prices have doubled in 2010, which is leading to higher steel prices and affecting large parts of the manufacturing industry. Companies can either transfer the cost to their end customers, which would seem unlikely given economic conditions, or they will see their profit margins shrink. • In addition to strong underlying demand for commodities in Asia, the price increase is being aided by expansive economic policies. Growing budget imbalances and the risk of overheating in several emerging economies are increasing the need for austerity, however. Eventually this could cause the commodity market to cool off and prices to fall. Swedbank’s commodity price index for March rose by 5.3% in USD, thereby recouping February’s loss. As a whole, the index rose by just over 5% in the first three months of the year, a more modest gain than when measured in euro. Since December of last year, the decline in the euro against the dollar has led to a rise in commodity prices in the range of 13% during the first quarter. The broad-based gains in the March commodity price index contrasted sharply with the previous month. The increase has been driven in no small part by higher energy prices (coal and oil), which weigh heavily in the index. The price of crude oil rose in USD by an average of 6.3% and in 12 months has climbed 69.5%. Increased oil consumption in Asia’s emerging economies has contributed to an upward revision in global oil consumption estimates for 2010. Swedbank’s Commodity Price index, USD Source: Swedbank 00 01 02 03 04 05 06 07 08 09 10 Index 50 100 150 200 250 300 350 400 450 500 Total index exclusive energy commodities Total index Food Energy raw materials 2000=100
- 2. Energy & Commodities Monthly newsletter from Swedbank’s Economic Research Department, continued No. 4 • 9 April 2010 2 (4) Expansion in Asia is driving up crude oil prices OPEC’s decision on 17 March to maintain current oil production levels is not expected to jeopardise the global economic recovery, at the same time that there is still an oil surplus. Crude prices of around 70-80 dollars a barrel are also considered a level where new capacity can be profitable, especially in countries where extraction costs are high. A continued expansion in Asia and more signs of an economic recovery in the U.S., the world’s largest oil consumer, could push oil prices higher. Expectations of higher crude prices are reflected in futures prices, where crude (Brent) for delivery in December 2010 was priced at the time of writing at nearly 90 dollar a barrel, compared with a spot price of 84 dollars. This means that oil prices are at a higher level than our average forecast of 75 dollars a barrel this year. Too high an oil price could put the recovery at risk. The fear of an overheated Chinese economy still remains, which could lead to more cutbacks than announced so far. In other words, there is a risk that the rising trend in oil prices could be broken when the impact of austerity measures becomes evident. It is still too early to revise our oil forecast upward, but there will be enough reason if global oil demand continues to grow. The price rise for coal, which is an important energy source as well as an input good for the steel industry, has been considerably more modest than for crude. In March the price rose by 1.2%, and since energy resources bottomed out in December 2008 it has risen by 18% in USD compared with 90% for crude. We expect the price of coal to continue to rise in the year ahead, particularly considering the agreements that have been reached by the world’s largest mining companies and steelmakers to double the price of coal. Since coal is an essential global energy resource, especially in Asia, higher prices will lead to higher commodity costs for energy producers and eventually rising energy prices for businesses and households. Rising metal prices and lower inventories The price of non-ferrous metals rose by no less than 9% in March after falling by just over 7% in February. The price decline in the previous month was partly due to concerns that overshadowed the commodity market in connection with the austerity package announced by Chinese authorities to slow its economic expansion. Continued strong growth numbers from the Middle Kingdom are instead contributing to a rise in metal prices. A clear turnaround probably is also a sign of renewed interest in commodities among financial investors. The price increase for metals is also the result of the expansive economic policies still maintained by most industrial countries and emerging economies. Price index for Non-ferrous metals, USD Source:Swedbank 90 91 92 93 94 95 96 97 98 99 00 01 02 03 04 05 06 07 08 09 Index 50 75 100 125 150 175 200 225 250 275 300 325 2000=100 Nickel posted the largest gain in March (19%), followed by copper (9.2%), aluminium (7.6%) and zinc (5.5%). Even if the price of lead rose by a modest 1.9%, the price level has climbed by slightly over 75% in one year. With few exceptions the price trend for metals has uniformly pointed upward from the beginning of 2009, and the price index for industrial metals is now at its highest level since August 2008. This means that metal prices have now returned to nearly 80% of their 2007 peak, despite that the global economy is still growing below its potential. In our global economic outlook from March we revised our GDP growth estimate upward for emerging economies, which account for most of the global growth increase we anticipate in 2010-2011. The industrialisation and urbanisation process that these countries are undergoing will keep commodity demand strong. Demand for metals is expected to rise among OECD countries as well following the major slowdown in 2009. The slower inventory build-up for copper, zinc and nickel is a sign of fundamentally stronger demand. Industrial production, annual change (%) Source: Reuters EcoWin 00 01 02 03 04 05 06 07 08 09 10 %-change -40 -30 -20 -10 0 10 20 30 40 Japan South Korea EMU-region US China Commodity prices are also affected by the fact that some sectors of the market are dominated by a handful of players, which creates a risk that industry leaders could engage in price collusion. This
- 3. Energy & Commodities Monthly newsletter from Swedbank’s Economic Research Department, continued No. 4 • 9 April 2010 3 (4) applies, for example, to the production of oil, as well as to iron ore. Copper is also an example, where Chile accounts for over a third of global extraction. It is estimated that the three largest mining companies, based in Brazil and Australia, account for no less than 70-75% of global iron ore trade. In March the world’s largest mining companies and Asia’s steel producers agreed to raise iron ore prices in 2010 from 60 dollars to 110-120 dollars per ton, which will lead to significantly higher commodity costs for the steel industry. In addition to higher production costs, global steel demand is expected to grow, which would indicate higher steel prices in the year ahead. Due to a sluggish global recovery, particularly in the OECD countries, the price increases are expected to be limited. Rising commodity prices will test the strength of global industry. Companies that are dependent on steel for their production will especially feel the effects if underlying demand remains brittle. Retreat in food prices continues Along with coal, food is the commodity group that has posted the weakest price gains in Swedbank’s commodity index in the last year. In March food prices fell by 4.6% compared with the previous month, with grain prices down for the third consecutive month. Price development for Food and Agricultural raw materials, USD Cereals Agricultural raw materials Food Source: Swedbank 00 01 02 03 04 05 06 07 08 09 10 2000=100 50 100 150 200 250 300 350 In addition to the weak economy, several food categories are under pressure from excess supply, particularly in the case of grains following last year’s record harvests. If the grain crop planned in the U.S. this year is realised, as American surveys show, there is a risk of further price declines unless the global economy grows more than expected. A downward price trend at the same time that production costs for fuels and fertilizer are rising reduces the incentive to increase food production, however. Weather-related factors could also quickly affect the balance between supply and demand in the short term. Agricultural products, which include pulp, lumber and cotton, have posted a stronger price trend. Pulp prices have risen in the last year and in March were slightly over 50% higher than the previous year. High global demand and shrinking inventories in connection with production stoppages in Finland and Chile are driving up prices. In the short term pulp prices could rise further if constrained supply conditions continue. Jörgen Kennemar
- 4. Energy & Commodities Monthly newsletter from Swedbank’s Economic Research Department, continued No. 4 • 9 April 2010 4 (4) Swedbank Commodity Index - US$ - Basis 2000 = 1oo 07-04-10 1.2010 2.2010 3.2010 Total index 260,6 251,3 264,6 Per cent change month ago 3,6 -3,6 5,3 Per cent change year ago 63,3 62,7 60,7 Total index exclusive energy 224,6 216,1 223,3 Per cent change month ago 2,2 -3,8 3,3 Per cent change year ago 41,3 38,8 42,2 Food, tropical beverages 228,8 218,2 208,1 Per cent change month ago 0,8 -4,7 -4,6 Per cent change year ago 20,8 17,2 14,0 Cereals 197,3 187,7 185,6 Per cent change month ago -3,6 -4,9 -1,1 Per cent change year ago -4,4 -4,4 -7,0 Tropical beverages and tobacco 255,7 243,3 225,6 Per cent change month ago 3,9 -4,8 -7,3 Per cent change year ago 39,3 31,2 24,7 Coffee 126,9 123,4 125,3 Per cent change month ago 1,5 -2,8 1,5 Per cent change year ago 17,1 14,7 18,3 Oilseeds and oil 191,4 183,8 184,9 Per cent change month ago -4,5 -4,0 0,6 Per cent change year ago 0,2 1,5 5,7 Industrial raw materials 223,4 215,5 227,7 Per cent change month ago 2,7 -3,5 5,6 Per cent change year ago 48,8 46,7 52,2 Agricultural raw materials 158,7 157,7 164,3 Per cent change month ago 1,1 -0,6 4,2 Per cent change year ago 44,5 50,8 57,2 Cotton 71,9 74,5 81,3 Per cent change month ago -3,7 3,6 9,1 Per cent change year ago 46,4 63,0 88,6 Softwood 138,6 136,4 140,8 Per cent change month ago -0,9 -1,6 3,2 Per cent change year ago 28,3 33,2 36,6 Woodpulp 814,4 840,2 877,7 Per cent change month ago 2,3 3,2 4,5 Per cent change year ago 31,7 42,3 51,7 Non-ferrous metals 237,0 219,7 239,8 Per cent change month ago 5,1 -7,3 9,1 Per cent change year ago 89,8 80,7 86,8 Copper 7385,6 6835,4 7462,4 Per cent change month ago 6,1 -7,4 9,2 Per cent change year ago 129,3 106,3 99,1 Aluminium 2235,2 2048,9 2205,6 Per cent change month ago 2,5 -8,3 7,6 Per cent change year ago 57,5 54,5 65,2 Lead 2367,7 2131,4 2171,7 Per cent change month ago 1,9 -10,0 1,9 Per cent change year ago 109,2 92,2 75,4 Zinc 2434,1 2155,2 2274,7 Per cent change month ago 2,9 -11,5 5,5 Per cent change year ago 105,0 93,9 87,0 Nickel 18434,6 18872,4 22453,4 Per cent change month ago 8,5 2,4 19,0 Per cent change year ago 63,1 81,4 131,6 Iron ore, steel scrap 350,1 351,5 355,5 Per cent change month ago 0,0 0,4 1,1 Per cent change year ago 8,1 7,8 9,5 Energy raw materials 276,6 266,9 283,0 Per cent change month ago 4,1 -3,5 6,0 Per cent change year ago 72,9 73,4 68,4 Coking coal 365,4 347,9 352,1 Per cent change month ago 19,4 -4,8 1,2 Per cent change year ago 16,5 23,3 51,2 Crude oil 272,5 263,2 279,8 Per cent change month ago 3,3 -3,4 6,3 Per cent change year ago 78,2 77,7 69,5 Source : SWEDBANK and HWWA-Institute for Economic Research Hamburg Swedbank Commodity Index - SEK - Basis 2000 = 1oo 07-04-10 1.2010 2.2010 3.2010 Total index 202,2 198,3 205,9 Per cent change month ago 3,6 -1,9 3,9 Per cent change year ago 44,3 38,4 34,6 Total index exclusive energy 174,3 170,5 173,8 Per cent change month ago 2,2 -2,2 1,9 Per cent change year ago 24,9 18,2 19,1 Food, tropical beverages 177,6 172,2 161,9 Per cent change month ago 0,8 -3,1 -5,9 Per cent change year ago 6,7 -0,3 -4,5 Cereals 153,1 148,1 144,4 Per cent change month ago -3,6 -3,3 -2,5 Per cent change year ago -15,5 -18,6 -22,1 Tropical beverages and tobacco 198,4 192,0 175,6 Per cent change month ago 3,9 -3,3 -8,6 Per cent change year ago 23,1 11,7 4,4 Coffee 98,5 97,4 97,5 Per cent change month ago 1,5 -1,1 0,1 Per cent change year ago 3,4 -2,4 -0,9 Oilseeds and oil 148,5 145,0 143,9 Per cent change month ago -4,5 -2,4 -0,8 Per cent change year ago -11,5 -13,6 -11,5 Industrial raw materials 173,3 170,1 177,2 Per cent change month ago 2,7 -1,9 4,2 Per cent change year ago 31,5 24,9 27,5 Agricultural raw materials 123,2 124,4 127,9 Per cent change month ago 1,1 1,0 2,8 Per cent change year ago 27,7 28,3 31,7 Cotton 55,8 58,8 63,3 Per cent change month ago -3,7 5,4 7,6 Per cent change year ago 29,4 38,7 58,0 Softwood 107,6 107,6 109,6 Per cent change month ago -0,9 0,1 1,8 Per cent change year ago 13,4 13,4 14,4 Woodpulp 632,0 663,0 683,1 Per cent change month ago 2,3 4,9 3,0 Per cent change year ago 16,4 21,1 27,1 Non-ferrous metals 183,9 173,4 186,6 Per cent change month ago 5,1 -5,7 7,6 Per cent change year ago 67,7 53,8 56,4 Copper 5731,9 5394,0 5807,7 Per cent change month ago 6,1 -5,9 7,7 Per cent change year ago 102,7 75,5 66,7 Aluminium 1734,7 1616,8 1716,5 Per cent change month ago 2,5 -6,8 6,2 Per cent change year ago 39,2 31,5 38,3 Lead 1837,5 1682,0 1690,1 Per cent change month ago 1,9 -8,5 0,5 Per cent change year ago 84,9 63,6 46,9 Zinc 1889,1 1700,7 1770,3 Per cent change month ago 2,9 -10,0 4,1 Per cent change year ago 81,2 65,0 56,6 Nickel 14306,9 14892,8 17474,6 Per cent change month ago 8,5 4,1 17,3 Per cent change year ago 44,1 54,4 94,0 Iron ore, steel scrap 271,7 277,4 276,7 Per cent change month ago 0,0 2,1 -0,3 Per cent change year ago -4,5 -8,3 -8,3 Energy raw materials 214,6 210,6 220,2 Per cent change month ago 4,1 -1,9 4,6 Per cent change year ago 52,8 47,5 41,0 Coking coal 283,6 274,5 274,0 Per cent change month ago 19,4 -3,2 -0,2 Per cent change year ago 2,9 5,0 26,6 Crude oil 211,5 207,7 217,8 Per cent change month ago 3,3 -1,8 4,8 Per cent change year ago 57,5 51,3 41,9 Source : SWEDBANK and HWWA-Institute for Economic Research Hamburg Swedbank Economic Research Department SE-105 34 Stockholm, Sweden Phone +46-8-5859 1028 ek.sekr@swedbank.se www.swedbank.se Legally responsible publisher Cecilia Hermansson, +46-88-5859 1588. Magnus Alvesson, +46-8-5859 3341 Jörgen Kennemar, +46-8-5859 1478 Swedbank’s monthly Energy & Commodities newsletter is published as a service to our customers. We believe that we have used reliable sources and methods in the preparation of the analyses reported in this publication. However, we cannot guarantee the accuracy or completeness of the report and cannot be held responsible for any error or omission in the underlying material or its use. Readers are encouraged to base any (investment) decisions on other material as well. Neither Swedbank nor its employees may be held responsible for losses or damages, direct or indirect, owing to any errors or omissions in Swedbank’s monthly Energy & Commodities newsletter.