
Recomendados
Mais conteúdo relacionado
Semelhante a Iyer_39x29
Semelhante a Iyer_39x29 (20)
Iyer_39x29
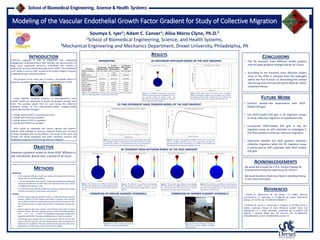
- 1. School of Biomedical Engineering, Science & Health Systems Modeling of the Vascular Endothelial Growth Factor Gradient for Study of Collective Migration Soumya S. Iyer1; Adam C. Canver1; Alisa Morss Clyne, Ph.D.² 1School of Biomedical Engineering, Science, and Health Systems, ²Mechanical Engineering and Mechanics Department, Drexel University, Philadelphia, PA INTRODUCTION OBJECTIVE Develop a gradient model to show VEGF diffusion in the microfluidic device over a period of 24 hours. METHODS Collective migration is vital to endothelial cells undergoing angiogenesis, endothelialization after stenting, and vascularization of large tissue engineered constructs. Endothelial cells’ motility is affected by vascular endothelial growth factor (VEGF). The endothelial cells’ ability to react to VEGF sensed by the cellular integrin receptors is dependent upon substrate stiffness. The purpose of this study was to model a microfluidic device to generate a gradient that was formed by sustained release of VEGF. Using COMSOL modeling software, a time-dependent mass transfer model was developed to predict the gradient strength over time. This gradient would then be used during the collective migration studies on four mechanically-tunable, collagen-coated polyacrylamide (PA) hydrogels: 1. soft gel without VEGF or a gradient (control) 2. soft gel with VEGF and a gradient 3. stiff gel without VEGF or a gradient 4. stiff gel with VEGF and a gradient VEGF would be integrated into sodium alginate and heparin- alginate (H/A) hydrogels to observe sustained release over 24 hours on these hydrogels with varying stiffness. The results of this study will validate the overall hypothesis that stiffer substrates enhance the endothelial response to VEGF during collective migration. MODELING • A 2D stationary diffusion model was produced to determine the initial release rate for the VEGF gradient. • A 1D time-dependent mass transfer model was designed to graphically represent the diffusion of VEGF down one channel of the micro device on COMSOL Multiphysics® 4.0a. • A 2D transient mass diffusion model was created to express the change in VEGF concentration in the device over 24 hours. TESTING • 4% (w/v) sodium alginate gels were made in a 500 mM calcium chloride solution. Aliquots of that solution were taken at specific times. Bovine serum albumin (BSA) was loaded into the gels and then measured with the nanodrop device to define BSA protein concentration change over time.¹ • Heparin-alginate gels were made in the chemical hood with 1% (w/v) heparin solution, 1% (w/v) alginate solution, 0.031 M ethylenediamine, and 0.33 M 1-ethyl-3-(3-dimethylaminopropyl)-carbodiimide hydrochloride (EDAC). They were stabilized over a 3-day time period. • The H/A gels were washed with a 2.5 mM calcium chloride and 143 mM sodium chloride solution, and with distilled water before being freeze- dried with the lyophilizer.² BSA was loaded into the gels after they were lyophilized to conduct BSA protein concentration studies. RESULTS CONCLUSIONS FUTURE WORK ACKNOWLEDGEMENTS REFERENCES PARAMETERS 2D STATIONARY DIFFUSION MODEL OF THE VEGF GRADIENT 1D TIME-DEPENDENT MASS TRANSFER MODEL OF THE VEGF GRADIENT 2D TRANSIENT MASS DIFFUSION MODEL OF THE VEGF GRADIENT FORMATION OF SODIUM ALGINATE HYDROGELS FORMATION OF HEPARIN-ALGINATE HYDROGELS Parameters 2D Stationary Diffusion Model 1D Time- Dependent Mass Transfer Model 2D Transient Mass Diffusion Model Diffusion Coefficient 9.4 x 10⁻⁷ cm²/s 9.4 x 10⁻⁷ cm²/s 9.4 x 10⁻⁷ cm²/s Length -- 7 mm. -- Maximum Time -- 24 hours 24 hours VEGF Concentration at the Source 100 mol/m³ 100 mol/m³ 100 mol/m³ VEGF Concentration at the Sink 0 mol/m³ 0 mol/m³ 0 mol/m³ Source (radius) 0.5 mm. 0.5 mm. 0.5 mm. Sink (radius) 2 mm. 2 mm. 2 mm. Channel Length 2 mm. 2 mm. 2 mm. Channel Width 0.3 mm. 0.3 mm. 0.3 mm. Stationary Diffusion Model: VEGF Gradient Length(mm.) Width (mm.) Figure 1. The table above consists of all the parameters used for each model since the certain parameters varied based on the model. Figure 2. A simplified 2-dimensional source/sink model was produced, which is independent of time and assumes infinite an infinite source. The dimensions of the model are identical to the actual device, which are listed in Figure 1. Figure 3. VEGF release down the channel of the microfluidic device was graphed to express how the gradient only reaches the beginning of the channel. A distance of 0 mm. indicates the start of the source and 7 mm. indicates the end of the sink. 0 5 10 15 20 25 0 6 12 18 24 GradientStrength(mM/mm) Diffusion Time (hours) VEGF Gradient Strength over 24 Hours Figure 4. The 1D time-dependent mass transfer model displays the change in concentration against the distance over one-hour intervals for 24 hours only down the channel. It can be determined that the concentration of VEGF is sustained for a greater distance at 24 hours than at 0 hours. Figure 5. The graph of the gradient strength of VEGF over 24 hours shows that the strength is greatest at the 5-hour time point (red point). It gradually decreases from 24 mM/mm to 17 mM/mm. This indicates that the gradient should at least be sustained for 5 hours. Width (mm.) Width (mm.) Width (mm.)Width (mm.) Figure 6. The transient mass diffusion model presents the initial VEGF gradient (t=0 s). VEGF would be loaded into the source and would be ready to release down the channel. Figure 7. The transient mass diffusion model displays the VEGF gradient at t=18000 s (5 hours). This time point is when the gradient strength peaks, as shown in Figure 5. Figure 8. The transient mass diffusion model displays the VEGF gradient at t=28800 s (8 hours). It illustrates that most of the VEGF has left the source and the channel, and is starting to release into the sink. Figure 9. The transient mass diffusion model illustrates the VEGF gradient at t=86400 s (24 hours). This is the last time point in this model, and it is seen that VEGF has diffused into the infinite sink. Figure 10. The sodium alginate gel (bottom of the tube) is washed with distilled water. Figure 11. The H/A gel (midway in the tube) is washed with a calcium chloride and sodium chloride solution. • The 2D transient mass diffusion model predicts that the peak gradient strength will be at 5 hours. • According to the transient mass diffusion model, most of the VEGF is released from the hydrogels within the first 8 hours so decreasing the release rate during that time period would allow for better sustained release. • Conduct release-rate experiments with VEGF- loaded H/A gels. • Use VEGF-loaded H/A gels in 2D migration assays to study collective migration of endothelial cells. • Incorporate VEGF-loaded H/A gels in the 2D migration assay on soft substrates to investigate if the VEGF gradient enhances collective migration. • Determine whether the VEGF gradient improves collective migration when the 2D migration assay is performed on stiff substrates with VEGF-loaded H/A gels. We would like to thank the S.T.A.R. Scholars Program for funding and providing this opportunity for research. We would also like to thank Gary Tang for providing training in cell culture techniques. ¹ Tanaka, H., Matsumura, M. and Veliky, I. A. (1984), Diffusion characteristics of substrates in Ca-alginate gel beads. Biotechnol. Bioeng., 26: 53–58. doi: 10.1002/bit.260260111 ² Tanihara, M., Suzuki, Y., Yamamoto, E., Noguchi, A. and Mizushima, Y. (2001), Sustained release of basic fibroblast growth factor and angiogenesis in a novel covalently crosslinked gel of heparin and alginate. J. Biomed. Mater. Res., 56: 216–221. doi: 10.1002/1097- 4636(200108)56:2<216::AID-JBM1086>3.0.CO;2-N