(Paper) "Comparisons of Paper-book and E-book by the scale of carbon footprint" for Asian Symposium on Printing Technology
•
1 gostou•501 visualizações


Recomendados
Mais conteúdo relacionado
Mais de Shimizu Printing Inc.
Mais de Shimizu Printing Inc. (20)
Último
Último (20)
(Paper) "Comparisons of Paper-book and E-book by the scale of carbon footprint" for Asian Symposium on Printing Technology
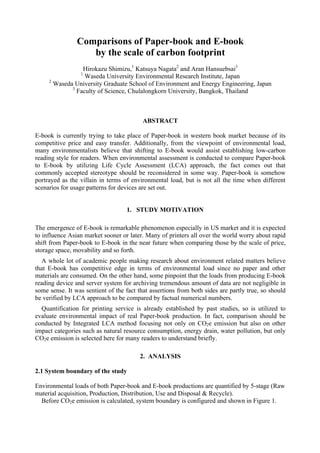
- 1. Comparisons of Paper-book and E-book by the scale of carbon footprint Hirokazu Shimizu,1 Katsuya Nagata2 and Aran Hansuebsai3 1 Waseda University Environmental Research Institute, Japan 2 Waseda University Graduate School of Environment and Energy Engineering, Japan 3 Faculty of Science, Chulalongkorn University, Bangkok, Thailand ABSTRACT E-book is currently trying to take place of Paper-book in western book market because of its competitive price and easy transfer. Additionally, from the viewpoint of environmental load, many environmentalists believe that shifting to E-book would assist establishing low-carbon reading style for readers. When environmental assessment is conducted to compare Paper-book to E-book by utilizing Life Cycle Assessment (LCA) approach, the fact comes out that commonly accepted stereotype should be reconsidered in some way. Paper-book is somehow portrayed as the villain in terms of environmental load, but is not all the time when different scenarios for usage patterns for devices are set out. 1. STUDY MOTIVATION The emergence of E-book is remarkable phenomenon especially in US market and it is expected to influence Asian market sooner or later. Many of printers all over the world worry about rapid shift from Paper-book to E-book in the near future when comparing those by the scale of price, storage space, movability and so forth. A whole lot of academic people making research about environment related matters believe that E-book has competitive edge in terms of environmental load since no paper and other materials are consumed. On the other hand, some pinpoint that the loads from producing E-book reading device and server system for archiving tremendous amount of data are not negligible in some sense. It was sentient of the fact that assertions from both sides are partly true, so should be verified by LCA approach to be compared by factual numerical numbers. Quantification for printing service is already established by past studies, so is utilized to evaluate environmental impact of real Paper-book production. In fact, comparison should be conducted by Integrated LCA method focusing not only on CO2e emission but also on other impact categories such as natural resource consumption, energy drain, water pollution, but only CO2e emission is selected here for many readers to understand briefly. 2. ANALYSIS 2.1 System boundary of the study Environmental loads of both Paper-book and E-book productions are quantified by 5-stage (Raw material acquisition, Production, Distribution, Use and Disposal & Recycle). Before CO2e emission is calculated, system boundary is configured and shown in Figure 1.
- 2. Figure 1. System boundary of Paper-book and E-book 2.2 Carbon calculation of Paper-book The specification of Paper-book is a bit modified from the real one since it was not published yet as of this moment, but is faithfully cited at maximum as a case study for comparison use. Calculation consists of Material, Data creation, Printing & Book binding, Distribution and Disposal/Recycle based on 5-stage of system boundary shown in Figure 1. The stage for “Use” is not considered for Paper-book since no additional electricity is used for reading except for lighting and air-conditioning. The load from “Material” is major one because around two thirds of total load comes from it. Among materials, paper has significant impact since it occupies almost 60% as a whole. Whereas, ink and printing plate has no mighty impact though those items are representatives of printing itself. Other items, which are additive for dampening solution, glues for perfect binding, polypropylene for cover lamination, have too small impacts to change calculation result. “Data creation” is precisely investigated this time because it is usually difficult for a printer to trace back in detail. Every single load from a meeting for brainstorming at publisher, all writing/designing/editing/image-editing works and photographing including transportation is checked over at great length. “Printing & Bookbinding” can be quantified without difficulty because all production facilities are visible, but “Distribution” is cannot because it is invisible for a printer. So on that point, it is necessary to set up the scenario here; it is assumed that 6-subscription agent, including one agent handling mail order, are selected to distribute books all over Japan. It is summarized as diagram in Figure 2. Figure 2. Fictional scenario for distributing 5000 books
- 3. “Disposal/Recycle” is partly quantified based on scenarios; one is disposal ratio vs. recycle ratio of books after consumers purchase (22% vs. 78%) and the other is returned ratio of the books (40% returned to publisher’s warehouse on the way of outbound route) after selling those for several month at bookstores. Carbon calculation for Paper-book covering all items is summarized in Table 1. Table 1. CO2e calculation for Paper-book
- 4. 2.3 Carbon calculation of E-book A book in this case study is not fully digitalized for E-book in practical, so is assumed to be the one for comparison purpose here. There are several kinds of devices, which can be used as E-book readers, but only “iPad” created by Apple is selected here because of its popularity all over the world. Carbon calculation per E-book is achieved in Table 2. Table 2. CO2e calculation for E-book “Data creation” is exactly the same as the process of Paper-book, so the figure is divided by 3000 downloads which is the same as the number of sold for Paper-book. “Data management” is the process for data modification to adjust existing data for E-book format and data verification to check newly adjusted data. “ICT hosting service” is referenced from carbon footprint certified service by Nihon Unysis. It is supposed that data size for E-book is 1MB and storage for server system is 50GB, so the load for E-Book is extremely small and ignorable based on data size of E-book and storage size shown above. “iPad” is selected as a device to read E-book even though there are different kinds of devices right now. The main reason is that Apple published Environmental Report of main products on their web site, such as MacBook/iPad/iPhone, to disclose detailed data of CO2e emission throughout life cycles whereas no competitors put before the public. As a result, CO2e emission per E-book is calculated to compare it to Paper-book. Paper-book (579g-CO2e/book) is around much more than E-book (277g-CO2e/book) when iPad is used 2- hour every day all year long. The reason why the time to use iPad is defined as 2-hour a day is that Apple simply publicizes “intensive daily use of product” to explain usage hours. So, it is assumed that 2-hour use a day can fit to heavy use and set as basic scenario. And then, question arises if all users of iPad are using it for full of 2-hour every single day or not when utilizing it secondarily to assist main computer. It will be variation factor for sensitivity analysis in the next section. 2.4 Sensitivity Analysis It is quite difficult to average iPad usage hours per day, so different scenarios are set out for sensitivity analysis purpose. As mentioned above, it is uncertain that how many hours of iPad use is set as precondition by Apple, so division process for total CO2e emission of iPad without considering prerequisite of usage hours might be inadequacy. However, there is no mean for detail checking, therefore CO2e emission of iPad is calculated for different scenarios drawn from basic scenario. For basic scenario, 2-hour use per day for iPad is set, and then 1.0-hour/0.75hour (45- minute)/0.50 (30-minute) usage hours per day are configured for sensitivity analysis. The loads to use iPad from different scenarios are calculated and other loads are added to draw the result for reading E-books to be compared. The loads from E-book device for different scenarios are calculated based on Apple’s environmental report and final calculation for E-book is summarized in Table 3 and in Figure 3 respectively.
- 5. Table 3. CO2e calculation for E-book device Figure 3. Sensitivity analysis based on iPad usage hours per day As explained in previous section, E-book is superior to Paper-book by basic scenario, but it is not by Scenario-2 and Scenario-3, namely it is inferior to Paper-book when using iPad for 45- mimnute a day or less. When iPad is used for 30-minute a day, it could be common for many users, CO2e emission of E-book is more than triple of Paper-book. On the other hand, when iPad is used for 2.0-hour a day, it might be exactly the case for quite a few users; CO2e emission of E-book is less than half of Paper-book. Calculation range goes beyond much more than imaginings by different scenarios; a scenario for E-book device usage can determine environmental impact of E-book. 3. CONCLUSION AND DISCUSSION By utilizing simplified LCA method, the fact that E-book always performs better than Paper- book can throw doubt on commonly accepted myth among environmentalists. It is obvious that key element to determine the load for E-book comes from the load of device; averaged hours of device usage should be investigated precisely to solidify the result for comparisons in terms of environmental load. It might not be so important to work on detailed
- 6. studies of “Data management” to convert printing data to E-book and “Server operation” to store data since serious commitment to scrutinize the loads could not influence the result. What should be done for comparison of Paper-book and E-book is that figuring out how to average usage hours of E-book devices to read books by extensive survey. ACKNOWLEDGEMENTS I wish to express my sincere gratitude to my academic supervisor, Professor Katsuya Nagata at Waseda University Graduate School of Environment and Energy Engineering for helpful suggestions and valuable advices during my research. I also would like to thank Associate Professor Dr. Aran Hansuebsai at Chulalongkorn University for inspiring my research for years. REFERENCES Hirokazu Shimizu. 2009. Establishment of quantitative assessment for Printing Service. Journal of Printing Science and Technology 46 (6): 26-35 Hirokazu Shimizu, and Katsuya Nagata. 2010. Comparison of Life-cycle CO2 emissions for Paper-Based Books and Electronic Books. Journal of Printing Science and Technology 47 (2): 19-29 Hirokazu Shimizu, and Katsuya Nagata. 2010. Integrated Life cycle Assessment (LCA) Approach for Printing Service by Using Environmental Load Point (ELP) Method. Journal of Printing Science and Technology 47 (3): 39-47 Hirokazu Shimizu, and Katsuya Nagata, and Aran Hansuebsai. 2011. Integrated Life cycle Assessment (LCA) for Printing Service in an emerging country. Proceedings of EcoDesign 2011 International Symposium: 283-288 Nihon Unisys. 2012. ICT hosting service. Available online, http://www.unisys.co.jp/services/ict/cloud- computing2.html#gict_h2-20. Accessed: August 14, 2012 Apple Inc. 2012. iPad Environmental report. Apple and the environment. Available online, http://images.apple.com/environment/reports/docs/iPad_Product_Environmental_Report_March20 12.pdf. Accessed: August 14, 2012 Address: Hirokazu Shimizu, Waseda University Environmental Research Institute E-mail: hstav@asagi.waseda.jp