SlideShare a Scribd company logo
1 of 58
FLORIDA JOBS by Industry*
    * Because most industries experienced job declines in the economic downturn that began in 2007, some of the job growth projected in this
    forecast includes the recapturing of jobs lost since that time.

    Duval County

         Industry                                                                                   Employment                Annual Change
        Code      Title                                                                    2010                  2018        Total        Percent

                  Total, All Industries                                                   482,400                544,226      7,728            1.60

         11       Agriculture, Forestry, Fishing and Hunting                                   234                  218           -2           -0.85

         111      Crop Production                                                              151                  148            0           -0.25
         112      Animal Production                                                             14                    8           -1           -5.36
         113      Forestry and Logging                                                          23                   23            0            0.00
         114      Fishing, Hunting and Trapping                                                 11                   10            0           -1.14

         21       Mining                                                                           69                   81        2            2.17
         212      Mining (except Oil and Gas)                                                      62                   69        1            1.41

         23       Construction                                                              22,627                29,157        816            3.61

         236      Construction of Buildings                                                  4,429                 5,728        162            3.67
         237      Heavy and Civil Engineering Construction                                   3,571                 4,292         90            2.52
         238      Specialty Trade Contractors                                               14,627                19,137        564            3.85


Source: Florida Agency for Workforce Innovation, Labor Market Statistics Center - September 2010                                                       1
FLORIDA JOBS by Industry*
    * Because most industries experienced job declines in the economic downturn that began in 2007, some of the job growth projected in this
    forecast includes the recapturing of jobs lost since that time.

    Duval County

         Industry                                                                                  Employment                Annual Change
        Code      Title                                                                    2010                 2018        Total        Percent

                  Manufacturing                                                             22,501              24,632         266             1.18

                  Durable Goods Manufacturing                                               13,367              15,930         320              2.40
         321      Wood Product Manufacturing                                                   508                 591          10              2.04
         327      Nonmetallic Mineral Product Manufacturing                                  1,293               1,422          16              1.25
         331      Primary Metal Manufacturing                                                  545                 575           4              0.69
         332      Fabricated Metal Product Manufacturing                                     2,194               2,814          78              3.53
         333      Machinery Manufacturing                                                      912               1,017          13              1.44
         334      Computer and Electronic Product Manufacturing                                445                 332         -14             -3.17
         335      Electrical Equipment and Appliance Manufacturing                             370                 435           8              2.20
         336      Transportation Equipment Manufacturing                                     2,873               3,806         117              4.06
         337      Furniture and Related Product Manufacturing                                  503                 409         -12             -2.34
         339      Miscellaneous Manufacturing                                                3,724               4,529         101              2.70

                  Non-Durable Goods Manufacturing                                            9,134               8,702          -54            -0.59
         311      Food Manufacturing                                                         1,617               1,465          -19            -1.18
         312      Beverage and Tobacco Product Manufacturing                                 2,722               2,600          -15            -0.56
         314      Textile Product Mills                                                         88                 114            3             3.69
         315      Apparel Manufacturing                                                        100                 120            2             2.50
         322      Paper Manufacturing                                                        1,614               1,626            2             0.09
         323      Printing and Related Support Activities                                      941                 751          -24            -2.52
         324      Petroleum and Coal Products Manufacturing                                    216                 208           -1            -0.46
         325      Chemical Manufacturing                                                     1,158               1,047          -14            -1.20
         326      Plastics and Rubber Products Manufacturing                                   625                 714           11             1.78


Source: Florida Agency for Workforce Innovation, Labor Market Statistics Center - September 2010                                                       2
FLORIDA JOBS by Industry*
    * Because most industries experienced job declines in the economic downturn that began in 2007, some of the job growth projected in this
    forecast includes the recapturing of jobs lost since that time.

    Duval County

         Industry                                                                                  Employment                Annual Change
        Code      Title                                                                    2010                 2018        Total        Percent

                  Trade, Transportation, and Utilities                                      96,711              109,018      1,538             1.59

         22       Utilities                                                                    236                  228         -1             -0.42
         42       Wholesale Trade                                                           22,200               26,179        497              2.24
         423      Merchant Wholesalers, Durable Goods                                       12,046               14,803        345              2.86
         424      Merchant Wholesalers, Nondurable Goods                                     7,232                8,072        105              1.45
         425      Wholesale Electronic Markets and Agents and Brokers                        2,922                3,304         48              1.63

         44       Retail Trade                                                              49,269               54,653        673              1.37
         441      Motor Vehicle and Parts Dealers                                            7,246                8,044        100              1.38
         442      Furniture and Home Furnishings Stores                                      1,519                1,853         42              2.75
         443      Electronics and Appliance Stores                                           1,826                2,313         61              3.33
         444      Building Material and Garden Supply Stores                                 3,652                4,029         47              1.29
         445      Food and Beverage Stores                                                   8,699                9,064         46              0.52
         446      Health and Personal Care Stores                                            2,760                3,097         42              1.53
         447      Gasoline Stations                                                          2,343                2,153        -24             -1.01
         448      Clothing and Clothing Accessories Stores                                   6,029                7,104        134              2.23
         451      Sporting Goods, Hobby, Book, and Music Stores                              2,175                2,452         35              1.59
         452      General Merchandise Stores                                                 9,463               10,745        160              1.69
         453      Miscellaneous Store Retailers                                              2,552                2,688         17              0.67
         454      Nonstore Retailers                                                         1,005                1,111         13              1.32


Source: Florida Agency for Workforce Innovation, Labor Market Statistics Center - September 2010                                                       3
FLORIDA JOBS by Industry*
    * Because most industries experienced job declines in the economic downturn that began in 2007, some of the job growth projected in this
    forecast includes the recapturing of jobs lost since that time.

    Duval County

         Industry                                                                                  Employment                Annual Change
        Code      Title                                                                    2010                 2018        Total        Percent

         48       Transportation and Warehousing                                            25,006              27,958         369              1.48
         481      Air Transportation                                                           451                 516           8              1.80
         482      Rail Transportation                                                        2,433               2,272         -20             -0.83
         483      Water Transportation                                                         838                 893           7              0.82
         484      Truck Transportation                                                       6,437               7,430         124              1.93
         485      Transit and Ground Passenger Transport                                     1,992               2,023           4              0.19
         487      Scenic and Sightseeing Transportation                                        108                 121           2              1.50
         488      Support Activities for Transportation                                      5,183               6,151         121              2.33
         492      Couriers and Messengers                                                    4,360               5,021          83              1.90
         493      Warehousing and Storage                                                    3,204               3,531          41              1.28

         51       Information                                                                8,334               8,476          18             0.21

         511      Publishing Industries                                                      1,292               1,384           12             0.89
         512      Motion Picture and Sound Recording Industries                                546                 541           -1            -0.11
         515      Broadcasting (except Internet)                                               868                 940            9             1.04
         517      Telecommunications                                                         3,680               3,565          -14            -0.39
         518      ISPs, Web Search Portals, and Data Processing Services                     1,698               1,745            6             0.35
         519      Other Information Services                                                   250                 301            6             2.55

                  Financial Activities                                                      49,185              53,179         499             1.02

         52       Finance and Insurance                                                     42,296              45,428         392              0.93
         522      Credit Intermediation and Related Activities                              20,900              22,673         222              1.06
         523      Securities, Commodity Contracts, and Other Investments                     4,267               5,442         147              3.44
         524      Insurance Carriers and Related Activities                                 16,805              17,066          33              0.19
         525      Funds, Trusts, and Other Financial Vehicles                                  171                  37         -17             -9.80


Source: Florida Agency for Workforce Innovation, Labor Market Statistics Center - September 2010                                                       4
FLORIDA JOBS by Industry*
    * Because most industries experienced job declines in the economic downturn that began in 2007, some of the job growth projected in this
    forecast includes the recapturing of jobs lost since that time.

    Duval County

         Industry                                                                                  Employment                Annual Change
        Code      Title                                                                    2010                 2018        Total        Percent

         53       Real Estate and Rental and Leasing                                         6,889               7,751         108             1.56
         531      Real Estate                                                                4,572               5,068          62             1.36
         532      Rental and Leasing Services                                                2,211               2,569          45             2.02
         533      Lessors of Nonfinancial Intangible Assets                                    106                 114           1             0.94

                  Professional and Business Services                                        69,716              84,404       1,836             2.63

         54       Professional, Scientific, and Technical Services                          28,438              35,578         892             3.14
         55       Management of Companies and Enterprises                                    5,824               6,890         133             2.29
         56       Administrative and Support and Waste Management                           35,454              41,936         810             2.29
         561      Administrative and Support Services                                       34,217              40,640         803             2.35
         562      Waste Management and Remediation Service                                   1,237               1,296           7             0.60

                  Education and Health Services                                             67,394              81,017       1,703             2.53

         61       Educational Services                                                       7,562               9,008         181             2.39
         62       Health Care and Social Assistance                                         59,832              72,009       1,522             2.54
         621      Ambulatory Health Care Services                                           25,505              32,512         876             3.43
         622      Hospitals                                                                 20,084              22,625         318             1.58
         623      Nursing and Residential Care Facilities                                    7,630               9,257         203             2.67
         624      Social Assistance                                                          6,613               7,615         125             1.89

                  Leisure and Hospitality                                                   42,532              45,883         419             0.98

         71       Arts, Entertainment, and Recreation                                        5,568               6,064          62             1.11
         711      Performing Arts, Spectator Sports, and Related Industries                  1,650               1,711           8             0.46
         712      Museums, Historical Sites, and Similar Institutions                          372                 408           4             1.21
         713      Amusement, Gambling, and Recreation Industries                             3,546               3,945          50             1.41


Source: Florida Agency for Workforce Innovation, Labor Market Statistics Center - September 2010                                                      5
FLORIDA JOBS by Industry*
    * Because most industries experienced job declines in the economic downturn that began in 2007, some of the job growth projected in this
    forecast includes the recapturing of jobs lost since that time.

    Duval County

         Industry                                                                                  Employment                Annual Change
        Code      Title                                                                    2010                 2018        Total        Percent

         72       Accommodation and Food Services                                           36,964              39,819         357             0.97
         721      Accommodation                                                              4,611               4,898          36             0.78
         722      Food Services and Drinking Places                                         32,353              34,921         321             0.99

         81       Other Services (Except Government)                                        17,794              19,903         264             1.48

         811      Repair and Maintenance                                                     4,889               5,532          80             1.64
         812      Personal and Laundry Services                                              3,735               3,959          28             0.75
         813      Membership Associations and Organizations                                  9,170              10,412         155             1.69

                  Government                                                                51,977              51,760          -27            -0.05

                  Federal Government                                                        15,920              14,323        -200             -1.25
                  State Government                                                           8,231               8,598          46              0.56
                  Local Government                                                          27,826              28,839         127              0.46

                  Self-Employed and Unpaid Family Workers                                   33,326              36,498         396             1.19


Source: Florida Agency for Workforce Innovation, Labor Market Statistics Center - September 2010                                                       6
FASTEST-GROWING INDUSTRIES*
* Because most industries experienced job declines in the economic downturn that began in 2007, some of the job growth projected in this forecast includes
the recapturing of jobs lost since that time.

Duval County

             Industry                                                                                        Employment                     Annual Change
  Rank      Code Title                                                                              2010                  2018             Total        Percent
            naic    indtitle                                                                         curr                  proj    Achng              Aperch
     1      336     Transportation Equipment Manufacturing                                           2,873                 3,806             117           4.06
     2      238     Specialty Trade Contractors                                                     14,627                19,137             564           3.85
     3      236     Construction of Buildings                                                        4,429                 5,728             162           3.67
     4      332     Fabricated Metal Product Manufacturing                                           2,194                 2,814              78           3.53
     5      523     Securities, Commodity Contracts, and Other Investments                           4,267                 5,442             147           3.44
     6      621     Ambulatory Health Care Services                                                 25,505                32,512             876           3.43
     7      443     Electronics and Appliance Stores                                                 1,826                 2,313              61           3.33
     8      540     Professional, Scientific, and Technical Services                                28,438                35,578             892           3.14
     9      423     Merchant Wholesalers, Durable Goods                                             12,046                14,803             345           2.86
    10      442     Furniture and Home Furnishings Stores                                            1,519                 1,853              42           2.75
    11      339     Miscellaneous Manufacturing                                                      3,724                 4,529             101           2.70
    12      623     Nursing and Residential Care Facilities                                          7,630                 9,257             203           2.67
    13      237     Heavy and Civil Engineering Construction                                         3,571                 4,292              90           2.52
    14      610     Educational Services                                                             7,562                 9,008             181           2.39
    15      561     Administrative and Support Services                                             34,217                40,640             803           2.35
    16      488     Support Activities for Transportation                                            5,183                 6,151             121           2.33
    17      550     Management of Companies and Enterprises                                          5,824                 6,890             133           2.29
    18      448     Clothing and Clothing Accessories Stores                                         6,029                 7,104             134           2.23
    19      321     Wood Product Manufacturing                                                         508                   591              10           2.04
    20      532     Rental and Leasing Services                                                      2,211                 2,569              45           2.02

This table includes industries with a minimum of 400 jobs in 2010.


 Source: Florida Agency for Workforce Innovation, Labor Market Statistics Center - September 2010                                                                 7
INDUSTRIES GAINING THE MOST NEW JOBS*
* Because most industries experienced job declines in the economic downturn that began in 2007, some of the job growth projected in this forecast includes
the recapturing of jobs lost since that time.

Duval County

             Industry                                                                                        Employment              Annual Change
  Rank      Code Title                                                                              2010                  2018      Total        Percent
            naic    indtitle                                                                        curr                  proj     Achng         Aperch
     1      540     Professional, Scientific, and Technical Services                                28,438                35,578      892           3.14
     2      621     Ambulatory Health Care Services                                                 25,505                32,512      876           3.43
     3      561     Administrative and Support Services                                             34,217                40,640      803           2.35
     4      238     Specialty Trade Contractors                                                     14,627                19,137      564           3.85
     5      423     Merchant Wholesalers, Durable Goods                                             12,046                14,803      345           2.86
     6      722     Food Services and Drinking Places                                               32,353                34,921      321           0.99
     7      622     Hospitals                                                                       20,084                22,625      318           1.58
     8      522     Credit Intermediation and Related Activities                                    20,900                22,673      222           1.06
     9      623     Nursing and Residential Care Facilities                                          7,630                 9,257      203           2.67
    10      610     Educational Services                                                             7,562                 9,008      181           2.39
    11      236     Construction of Buildings                                                        4,429                 5,728      162           3.67
    12      452     General Merchandise Stores                                                       9,463                10,745      160           1.69
    13      813     Membership Associations and Organizations                                        9,170                10,412      155           1.69
    14      523     Securities, Commodity Contracts, and Other Investments                           4,267                 5,442      147           3.44
    15      448     Clothing and Clothing Accessories Stores                                         6,029                 7,104      134           2.23
    16      550     Management of Companies and Enterprises                                          5,824                 6,890      133           2.29
    17      930     Local Government                                                                27,826                28,839      127           0.46
    18      624     Social Assistance                                                                6,613                 7,615      125           1.89
    19      484     Truck Transportation                                                             6,437                 7,430      124           1.93
    20      488     Support Activities for Transportation                                            5,183                 6,151      121           2.33


 Source: Florida Agency for Workforce Innovation, Labor Market Statistics Center - September 2010                                                          8
FLORIDA JOBS by Occupation*
 * Because most industries experienced job declines in the economic downturn that began in 2007, some of the occupational job growth projected in this forecast
 includes the recapturing of jobs lost since that time.
                                                                                                                                              NA
 Duval County                                                                                                                                      2010
                                                                                                       Annual       Average Annual Openings       Average
   Occupation                                                                         Employment       Percent   Due To     Due To                Hourly*
   Code       Title                                                                 2010      2018     Change    Growth Separations      Total    Wage ($)
 soc       OccTtl                                                                cur       prj        gpct      aog     aosep          aotot           wg
 000000    Total, All Occupations                                                  482,796   544,226       1.59   7,959    11,105       19,064       NA
 110000    Management Occupations                                                   17,718     19,704      1.40     251       387           638      NA
 111000    Top Executives                                                            4,802      5,049      0.64      31       136           167      NA
 111021      General and Operations Managers                                         3,435      3,603      0.61      21        98           119    46.59
 111031      Legislators                                                                65         61     -0.77       0         2             2    26.97
 112000    Marketing, Public Relations & Sales Managers                              1,680      2,000      2.38      40        36            76      NA
 112011      Advertising and Promotions Managers                                        86         90      0.58       1         2             3    54.61
 112021      Marketing Managers                                                        314        359      1.79       6         7            13    58.38
 112022      Sales Managers                                                          1,192      1,453      2.74      33        26            59    61.27
 113000    Operations Specialties Managers                                           3,756      4,124      1.22      47        75           122      NA
 113021      Computer and Information Systems Managers                                 703        788      1.51      11        11            22    56.75
 113041      Compensation and Benefits Managers                                        140        152      1.07       2         3             5    44.40
 113049      Human Resources Managers, All Other                                       178        210      2.25       4         4             8    38.30
 113051      Industrial Production Managers                                            207        224      1.03       2         7             9    51.39
 113071      Transportation, Storage, and Distribution Managers                        404        394     -0.31       0        11            11    44.44
 119000    Other Management Occupations                                              7,480      8,531      1.76     133       140           273      NA
 119011      Farm, Ranch, and Other Agricultural Managers                               35         36      0.36       0         1             1      NA
 119012      Farmers and Ranchers                                                      109         99     -1.15       0         1             1      NA
 119021      Construction Managers                                                   1,722      2,174      3.28      57        12            69    61.41
 119031      Education Administrators, Preschool and Child Care                         69         78      1.63       1         2             3    26.82
 119032      Education Administrators, Elementary and Secondary                        230        249      1.03       2         7             9    51.23
 119033      Education Administrators, Postsecondary                                   105        107      0.24       0         3             3    45.82
 119041      Engineering Managers                                                      397        501      3.27      13         8            21    51.83
 119051      Food Service Managers                                                     813        850      0.57       5        16            21    24.66
 119061      Funeral Directors                                                          54         61      1.62       1         1             2    21.76
 119081      Lodging Managers                                                          120        128      0.83       1         3             4    28.84
 119111      Medical and Health Services Managers                                      474        554      2.11      10         9            19    47.26
 119121      Natural Sciences Managers                                                  47         53      1.60       1         1             2    56.50
 119131      Postmasters and Mail Superintendents                                       17         16     -0.74       0         0             0    38.79
 119141      Property, Real Estate & Community Association Managers                    817        898      1.24      10        14            24    29.60


Source: Florida Agency for Workforce Innovation, Labor Market Statistics Center - September 2010                                                             9
FLORIDA JOBS by Occupation*
 * Because most industries experienced job declines in the economic downturn that began in 2007, some of the occupational job growth projected in this forecast
 includes the recapturing of jobs lost since that time.
                                                                                                                                              NA
 Duval County                                                                                                                                    2010
                                                                                                     Annual       Average Annual Openings       Average
   Occupation                                                                         Employment     Percent   Due To     Due To                Hourly*
   Code       Title                                                                 2010      2018   Change    Growth Separations      Total    Wage ($)
 soc       OccTtl                                                          cur       prj        gpct      aog     aosep              aotot           wg
 119199      Managers, All Other                                               2,305      2,539      1.27      29              59          88    44.03
 130000    Business and Financial Operations Occupations                      30,369     34,561      1.73     527             571       1,098      NA
 131000    Business Operations Specialists                                    16,817     18,976      1.60     270             354         624      NA
 131021      Purchasing Agents and Buyers, Farm Products                          18         18      0.00       0               0           0    24.05
 131022      Wholesale and Retail Buyers, Except Farm Products                   278        300      0.99       3               7          10    25.48
 131023      Purchasing Agents, Except Farm Products & Trade                     902      1,050      2.05      19              23          42    26.54
 131031      Claims Adjusters, Examiners, and Investigators                    1,294      1,315      0.20       3              33          36    29.44
 131041      Compliance Officers, Exc. Safety, Agri, Constr & Transp.          1,065      1,276      2.48      26              10          36    24.09
 131051      Cost Estimators                                                     778      1,046      4.31      34              17          51    30.52
 131071      Employment, Recruitment, and Placement Specialists                  893      1,173      3.92      35              23          58    20.55
 131073      Training and Development Specialists                                918      1,136      2.97      27              24          51    24.59
 131079      Human Resources, Training, & Labor Relations Specialists, All Other 728        872      2.47      18              19          37    26.83
 131111      Management Analysts                                               3,672      3,947      0.94      34              61          95    34.48
 131121      Meeting and Convention Planners                                     352        436      2.98      11               8          19    18.45
 131199      Business Operations Specialists, All Other                        5,126      5,455      0.80      41             111         152    29.63
 132000    Financial Specialists                                              13,552     15,585      1.88     257             217         474      NA
 132011      Accountants and Auditors                                          4,944      5,874      2.35     116              81         197    28.71
 132021      Appraisers and Assessors of Real Estate                             431        445      0.41       2               8          10    21.86
 132041      Credit Analysts                                                     647        759      2.16      14              11          25    32.03
 132051      Financial Analysts                                                  552        646      2.13      12              10          22    32.46
 132052      Personal Financial Advisors                                       1,143      1,526      4.19      48              12          60    30.38
 132053      Insurance Underwriters                                              644        640     -0.08       0              19          19    25.52
 132061      Financial Examiners                                                 117        159      4.49       5               2           7    39.29
 132071      Loan Counselors                                                      88         99      1.56       1               1           2    22.42
 132072      Loan Officers                                                     2,618      2,977      1.71      45              27          72    28.95
 132081      Tax Examiners, Collectors, and Revenue Agents                       393        382     -0.35       0              14          14      NA
 132082      Tax Preparers                                                       381        372     -0.30       0               6           6    10.23
 150000    Computer and Mathematical Occupations                              13,409     15,943      2.36     321             263         584      NA
 151000    Computer Specialists                                               12,823     15,265      2.38     310             247         557      NA
 151031      Computer Software Engineers, Applications                         1,809      2,304      3.42      62              14          76    41.59


Source: Florida Agency for Workforce Innovation, Labor Market Statistics Center - September 2010                                                           10
FLORIDA JOBS by Occupation*
 * Because most industries experienced job declines in the economic downturn that began in 2007, some of the occupational job growth projected in this forecast
 includes the recapturing of jobs lost since that time.
                                                                                                                                              NA
 Duval County                                                                                                                                                2010
                                                                                                              Annual       Average Annual Openings          Average
   Occupation                                                                         Employment              Percent   Due To     Due To                   Hourly*
   Code       Title                                                                 2010      2018            Change    Growth Separations      Total       Wage ($)
 soc       OccTtl                                                                cur           prj           gpct       aog         aosep         aotot          wg
 151032       Computer Software Engineers, Systems Software                              747           896       2.49          19             6        25    46.75
 151041       Computer Support Specialists                                             3,858         4,646       2.55          99           106       205    20.11
 151051       Computer Systems Analysts                                                1,807         2,042       1.63          29            38        67    33.08
 151071       Network and Computer Systems Administrators                                933         1,100       2.24          21            15        36    30.68
 151081       Network Systems and Data Communications Analysts                         1,251         1,821       5.70          71            22        93    34.84
 151099       Computer Specialists, All Other                                            470           467      -0.08           0            10        10    34.54
 152000    Mathematical Scientists                                                       586           678       1.96          12            16        28      NA
 152031       Operations Research Analysts                                               526           616       2.14          11            15        26    26.17
 170000    Architecture and Engineering Occupations                                    7,766         9,323       2.51         195           156       351      NA
 171000    Architects, Surveyors, and Cartographers                                      750           926       2.93          22            14        36      NA
 171011       Architects, Except Landscape and Naval                                     398           481       2.61          10             7        17    28.39
 171022       Surveyors                                                                  150           186       3.00           5             4         9    28.34
 172000    Engineers                                                                   4,364         5,286       2.64         115            91       206      NA
 172041       Chemical Engineers                                                          23            28       2.72           1             1         2    32.29
 172071       Electrical Engineers                                                       214           226       0.70           2             5         7    36.42
 172072       Electronics Engineers, Except Computer                                     295           309       0.59           2             7         9    37.85
 172111       Health and Safety Engineers, Except Mining                                  49            56       1.79           1             1         2    30.78
 172112       Industrial Engineers                                                       605           783       3.68          22            15        37    32.90
 172199       Engineers, All Other                                                       512           601       2.17          11            10        21    41.74
 173000    Drafters, Engineering, and Mapping Technicians                              2,652         3,111       2.16          57            51       108      NA
 173011       Architectural and Civil Drafters                                           443           520       2.17          10             9        19    20.86
 173012       Electrical and Electronics Drafters                                        115           146       3.37           4             3         7    24.18
 173013       Mechanical Drafters                                                        145           170       2.16           3             3         6    22.32
 173023       Electrical and Electronic Engineering Technicians                          672           750       1.45          10            13        23    26.25
 173024       Electro-Mechanical Technicians                                              47            52       1.33           1             1         2    17.07
 173025       Environmental Engineering Technicians                                       66            82       3.03           2             1         3    21.62
 173027       Mechanical Engineering Technicians                                          27            33       2.78           1             1         2    21.85
 173029       Engineering Technicians, Except Drafters, All Other                        288           304       0.69           2             5         7    30.01
 173031       Surveying and Mapping Technicians                                          431           545       3.31          14             8        22    17.09
 190000    Life, Physical, and Social Science Occupations                              2,887         3,290       1.74          52            87       139      NA


Source: Florida Agency for Workforce Innovation, Labor Market Statistics Center - September 2010                                                                       11
FLORIDA JOBS by Occupation*
 * Because most industries experienced job declines in the economic downturn that began in 2007, some of the occupational job growth projected in this forecast
 includes the recapturing of jobs lost since that time.
                                                                                                                                              NA
 Duval County                                                                                                                                               2010
                                                                                                              Annual       Average Annual Openings         Average
   Occupation                                                                         Employment              Percent   Due To     Due To                  Hourly*
   Code       Title                                                                 2010      2018            Change    Growth Separations      Total      Wage ($)
 soc       OccTtl                                                                cur           prj           gpct       aog        aosep         aotot          wg
 191000    Life Scientists                                                               518           639       2.92         15            13        28      NA
 191012       Food Scientists and Technologists                                           26            34       3.85          1             1         2    32.80
 191023       Zoologists and Wildlife Biologists                                          27            26      -0.46          0             1         1    26.75
 191029       Biological Scientists, All Other                                           146           147       0.09          0             5         5    36.51
 191032       Foresters                                                                   25            25       0.00          0             0         0    19.76
 191042       Medical Scientists, Except Epidemiologists                                 212           307       5.60         12             4        16      NA
 192000    Physical Scientists                                                           586           630       0.94          6            17        23      NA
 192042       Geoscientists, Except Hydrologists and Geographers                          88           106       2.56          2             3         5    34.42
 193000    Social Scientists and Related Workers                                       1,083         1,236       1.77         20            31        51      NA
 193021       Market Research Analysts                                                   477           581       2.73         13            13        26    26.80
 193039       Psychologists, All Other                                                    32            35       1.17          0             1         1    55.41
 193091       Anthropologists and Archeologists                                           26            27       0.48          0             1         1    28.43
 193099       Social Scientists and Related Workers, All Other                            72            77       0.87          1             4         5    30.48
 194000    Life, Physical, and Social Science Technicians                                700           785       1.52         11            27        38      NA
 194021       Biological Technicians                                                      69            71       0.36          0             3         3    16.88
 194031       Chemical Technicians                                                       109           126       1.95          2             2         4    16.44
 210000    Community and Social Services Occupations                                   5,708         6,423       1.57         89           120       209      NA
 211000    Social Workers & Community & Social Service Specialists                     4,123         4,564       1.34         55            90       145      NA
 211011       Substance Abuse and Behavioral Disorder Counselors                         131           142       1.05          1             3         4    17.97
 211012       Educational, Vocational, and School Counselors                             692           746       0.98          7            14        21    25.06
 211019       Counselors, All Other                                                      121           134       1.34          2             2         4    17.09
 211022       Medical and Public Health Social Workers                                   351           440       3.17         11             9        20    23.13
 211029       Social Workers, All Other                                                  202           220       1.11          2             5         7    21.90
 211092       Probation Officers and Correctional Treatment Specialists                  167           177       0.75          1             4         5    19.47
 211093       Social and Human Service Assistants                                        544           575       0.71          4            11        15    14.08
 212000    Religious Workers                                                           1,585         1,859       2.16         34            30        64      NA
 212011       Clergy                                                                     640           750       2.15         14            12        26    20.05
 212021       Directors, Religious Activities and Education                              770           905       2.19         17            15        32    17.95
 230000    Legal Occupations                                                           4,467         4,768       0.84         39            69       108      NA
 231000    Lawyers, Judges, and Related Workers                                        2,432         2,531       0.51         13            44        57      NA


Source: Florida Agency for Workforce Innovation, Labor Market Statistics Center - September 2010                                                                      12
FLORIDA JOBS by Occupation*
 * Because most industries experienced job declines in the economic downturn that began in 2007, some of the occupational job growth projected in this forecast
 includes the recapturing of jobs lost since that time.
                                                                                                                                              NA
 Duval County                                                                                                                                   2010
                                                                                                     Annual       Average Annual Openings      Average
   Occupation                                                                         Employment     Percent   Due To     Due To               Hourly*
   Code       Title                                                                 2010      2018   Change    Growth Separations      Total   Wage ($)
 soc       OccTtl                                                       cur       prj        gpct      aog     aosep                 aotot         wg
 231021      Admin. Law Judges, Adjudicators, and Hearing Officers             57         55     -0.44       0                  1           1    NA
 231022      Arbitrators, Mediators, and Conciliators                          24         26      1.04       0                  0           0 24.19
 232000    Legal Support Workers                                            2,035      2,237      1.24      26                 25          51    NA
 232091      Court Reporters                                                   46         55      2.45       1                  1           2 10.81
 232092      Law Clerks                                                       101        107      0.74       1                  2           3 18.57
 232093      Title Examiners, Abstractors, and Searchers                      511        503     -0.20       0                  7           7 19.74
 250000    Education, Training, and Library Occupations                    18,933     21,278      1.55     293                391         684    NA
 251000    Postsecondary Teachers                                           4,056      4,585      1.63      66                 70         136    NA
 251011      Business Teachers, Postsecondary                                 214        247      1.93       4                  4           8 48.30
 251021      Computer Science Teachers, Postsecondary                          63         73      1.98       1                  1           2 44.86
 251022      Mathematical Science Teachers, Postsecondary                     101        116      1.86       2                  2           4 34.09
 251032      Engineering Teachers, Postsecondary                               40         46      1.88       1                  1           2    NA
 251042      Biological Science Teachers, Postsecondary                        79         92      2.06       2                  1           3 45.28
 251052      Chemistry Teachers, Postsecondary                                 34         40      2.21       1                  1           2 33.27
 251054      Physics Teachers, Postsecondary                                   32         37      1.95       1                  1           2 34.89
 251061      Anthropology and Archeology Teachers, Postsecondary               22         25      1.70       0                  0           0    NA
 251063      Economics Teachers, Postsecondary                                 53         61      1.89       1                  1           2 39.74
 251064      Geography Teachers, Postsecondary                                 12         13      1.04       0                  0           0 31.18
 251065      Political Science Teachers, Postsecondary                         48         56      2.08       1                  1           2 40.37
 251066      Psychology Teachers, Postsecondary                                85         98      1.91       2                  2           4 30.37
 251067      Sociology Teachers, Postsecondary                                 35         41      2.14       1                  1           2 34.74
 251069      Social Sciences Teachers, Postsecondary, All Other                12         14      2.08       0                  0           0    NA
 251071      Health Specialties Teachers, Postsecondary                       820        949      1.97      16                 14          30 100.44
 251072      Nursing Instructors and Teachers, Postsecondary                  122        142      2.05       3                  2           5 46.04
 251081      Education Teachers, Postsecondary                                138        159      1.90       3                  2           5 32.82
 251111      Criminal Justice & Law Enforcement Teachers, Postsecondary        11         13      2.27       0                  0           0    NA
 251112      Law Teachers, Postsecondary                                       30         35      2.08       1                  1           2 50.91
 251121      Art, Drama, and Music Teachers, Postsecondary                    221        256      1.98       4                  4           8 27.81
 251122      Communications Teachers, Postsecondary                            94        108      1.86       2                  2           4 27.57
 251123      English Language & Literature Teachers, Postsecondary            149        173      2.01       3                  3           6 29.48


Source: Florida Agency for Workforce Innovation, Labor Market Statistics Center - September 2010                                                          13
FLORIDA JOBS by Occupation*
 * Because most industries experienced job declines in the economic downturn that began in 2007, some of the occupational job growth projected in this forecast
 includes the recapturing of jobs lost since that time.
                                                                                                                                              NA
 Duval County                                                                                                                                                2010
                                                                                                              Annual       Average Annual Openings          Average
   Occupation                                                                         Employment              Percent   Due To     Due To                   Hourly*
   Code       Title                                                                 2010      2018            Change    Growth Separations      Total       Wage ($)
 soc       OccTtl                                                                cur           prj           gpct       aog         aosep         aotot          wg
 251124      Foreign Language & Literature Teachers, Postsecondary                        30            34       1.67           1             1         2    31.13
 251125      History Teachers, Postsecondary                                              54            63       2.08           1             1         2    31.98
 251126      Philosophy and Religion Teachers, Postsecondary                              83            96       1.96           2             1         3    33.97
 251193      Recreation & Fitness Studies Teachers, Postsecondary                         45            52       1.94           1             1         2      NA
 251194      Vocational Education Teachers, Postsecondary                                437           470       0.94           4             8        12    24.00
 251199      Postsecondary Teachers, All Other                                           964         1,045       1.05          10            17        27    29.84
 252000    Primary, Secondary, and Special Education Teachers                          8,713         9,890       1.69         147           202       349      NA
 252011      Preschool Teachers, Except Special Education                              1,726         2,027       2.18          38            34        72    11.02
 252012      Kindergarten Teachers, Except Special Education                             578           654       1.64          10            11        21    27.21
 252021      Elementary School Teachers, Except Special Education                      2,816         3,207       1.74          49            63       112    28.09
 252022      Middle School Teachers, Exc. Special & Voc. Education                     1,248         1,417       1.69          21            28        49    27.68
 252031      Secondary School Teachers, Exc. Special and Voc. Ed.                      1,422         1,539       1.03          15            41        56    29.01
 252032      Vocational Education Teachers, Secondary School                             175           188       0.93           2             5         7    31.44
 252041      Special Education Teachers, Preschool - Elementary                          400           464       2.00           8            10        18      NA
 252042      Special Education Teachers, Middle School                                   112           130       2.01           2             3         5      NA
 252043      Special Education Teachers, Secondary School                                226           253       1.49           3             6         9    36.21
 253000    Other Teachers and Instructors                                              2,786         3,124       1.52          42            42        84      NA
 253011      Literacy, Remedial and GED Teachers and Instructors                          57            61       0.88           1             1         2    23.28
 253021      Self-Enrichment Education Teachers                                          996         1,153       1.97          20            15        35    16.65
 254000    Librarians, Curators, and Archivists                                          593           623       0.63           4            20        24      NA
 254012      Curators                                                                     12            14       2.08           0             0         0    14.82
 254021      Librarians                                                                  357           374       0.60           2             9        11    28.61
 254031      Library Technicians                                                         215           225       0.58           1            10        11    13.78
 259000    Other Education, Training, and Library Occupations                          2,785         3,056       1.22          34            59        93      NA
 259021      Farm and Home Management Advisors                                            54            52      -0.46           0             1         1    24.43
 259041      Teacher Assistants                                                        1,881         2,055       1.16          22            39        61    14.18
 270000    Arts, Entertainment, Sports, and Media Occupations                          7,191         7,974       1.36         102           180       282      NA
 271000    Art and Design Workers                                                      1,861         2,091       1.54          30            55        85      NA
 271011      Art Directors                                                                67            75       1.49           1             2         3    30.31
 271013      Fine Artists, Including Painters, Sculptors, & Illustrators                  73            78       0.86           1             2         3    16.13


Source: Florida Agency for Workforce Innovation, Labor Market Statistics Center - September 2010                                                                       14
FLORIDA JOBS by Occupation*
 * Because most industries experienced job declines in the economic downturn that began in 2007, some of the occupational job growth projected in this forecast
 includes the recapturing of jobs lost since that time.
                                                                                                                                              NA
 Duval County                                                                                                                                                2010
                                                                                                              Annual       Average Annual Openings          Average
   Occupation                                                                         Employment              Percent   Due To     Due To                   Hourly*
   Code       Title                                                                 2010      2018            Change    Growth Separations      Total       Wage ($)
 soc       OccTtl                                                                cur          prj            gpct       aog         aosep         aotot          wg
 271014      Multi-Media Artists and Animators                                           81             87       0.93           1             2         3    24.17
 271021      Commercial and Industrial Designers                                         84             98       2.08           2             3         5    36.91
 271023      Floral Designers                                                           144            150       0.52           1             4         5    13.61
 271024      Graphic Designers                                                          978          1,115       1.75          17            30        47    20.32
 271025      Interior Designers                                                         186            219       2.22           4             6        10    17.83
 271026      Merchandise Displayers and Window Trimmers                                 115            123       0.87           1             4         5    15.12
 272000    Entertainers, Athletes and Related Workers                                 1,923          2,024       0.66          16            42        58      NA
 272012      Producers and Directors                                                    208            212       0.24           1             6         7    27.54
 272021      Athletes and Sports Competitors                                             59             60       0.21           0             1         1      NA
 272022      Coaches and Scouts                                                         430            493       1.83           8             8        16    27.73
 272042      Musicians and Singers                                                      654            665       0.21           1            13        14      NA
 272099      Entertainers, Athletes and Related Workers, All Other                       21             22       0.60           0             1         1    25.55
 273000    Media and Communications Workers                                           2,162          2,485       1.87          40            51        91      NA
 273011      Radio and Television Announcers                                            184            186       0.14           0             5         5    36.65
 273031      Public Relations Specialists                                               985          1,183       2.51          25            23        48    26.35
 273041      Editors                                                                    305            341       1.48           5             8        13    21.51
 273042      Technical Writers                                                           78             92       2.24           2             1         3    25.72
 273091      Interpreters and Translators                                               117            136       2.03           2             3         5    20.54
 273099      Media and Communications Workers, All Other                                 41             43       0.61           0             1         1    20.29
 274000    Media and Communications Equipment Workers                                 1,245          1,374       1.30          16            32        48      NA
 274012      Broadcast Technicians                                                      167            176       0.67           1             5         6    13.78
 274014      Sound Engineering Technicians                                               42             54       3.57           2             1         3    17.15
 274021      Photographers                                                              392            433       1.31           5             8        13    14.64
 274031      Camera Operators, Television, Video, and Motion Picture                    148            156       0.68           1             4         5    12.94
 274032      Film and Video Editors                                                      46             47       0.27           0             1         1    15.96
 274099      Media & Communications Equipment Workers, All Other                         29             28      -0.43           0             1         1    24.93
 290000    Healthcare Practitioners and Technical Occupations                        27,348         32,949       2.56         700           528     1,228      NA
 291000    Health Diagnosing and Treating Practitioners                              17,151         20,723       2.60         447           301       748      NA
 291011      Chiropractors                                                              132            150       1.70           2             2         4      NA
 291031      Dietitians and Nutritionists                                               167            183       1.20           2             6         8    22.67


Source: Florida Agency for Workforce Innovation, Labor Market Statistics Center - September 2010                                                                       15
FLORIDA JOBS by Occupation*
 * Because most industries experienced job declines in the economic downturn that began in 2007, some of the occupational job growth projected in this forecast
 includes the recapturing of jobs lost since that time.
                                                                                                                                              NA
 Duval County                                                                                                                                                 2010
                                                                                                              Annual          Average Annual Openings        Average
   Occupation                                                                         Employment              Percent      Due To     Due To                 Hourly*
   Code       Title                                                                 2010      2018            Change       Growth Separations      Total     Wage ($)
 soc    OccTtl                                                                   cur          prj            gpct          aog         aosep         aotot        wg
 291041  Optometrists                                                                   108            132          2.78           3             4         7 48.78
 291051  Pharmacists                                                                  1,014          1,221          2.55          26            22        48 50.73
 291062  Family and General Practitioners                                               338            379          1.52           5             6        11 71.26
 291064  Obstetricians and Gynecologists                                                 34             40          2.21           1             1         2 112.78
 291066  Psychiatrists                                                                   18             22          2.78           1             0         1 88.85
 291069  Physicians and Surgeons, All Other                                             956          1,150          2.54          24            17        41 96.61
 291071  Physician Assistants                                                           288            396          4.69          14             5        19 44.16
 291111  Registered Nurses                                                           10,318         12,582          2.74         283           172       455 29.90
 291121  Audiologists                                                                    99            128          3.66           4             2         6 29.87
 291122  Occupational Therapists                                                        394            479          2.70          11             7        18 34.31
 291123  Physical Therapists                                                            595            720          2.63          16             7        23 40.06
 291126  Respiratory Therapists                                                         391            473          2.62          10             7        17 23.58
 291127  Speech and Language Pathologists                                               335            398          2.35           8             6        14 36.09
 291129  Therapists, All Other                                                          299            326          1.13           3             6         9 27.89
 291131  Veterinarians                                                                  146            185          3.34           5             3         8 47.80
 291199  Health Diagnosing and Treating Practitioners, All Other                        407            444          1.14           5             7        12 28.96
 292000 Health Technologists and Technicians                                          9,887         11,890          2.53         250           217       467    NA
 292011  Medical and Clinical Laboratory Technologists                                  675            746          1.31           9            12        21 24.96
 292012  Medical and Clinical Laboratory Technicians                                    313            355          1.68           5             6        11 19.22
 292021  Dental Hygienists                                                              586            721          2.88          17            12        29 26.01
 292031  Cardiovascular Technologists and Technicians                                   428            524          2.80          12             6        18 19.76
 292032  Diagnostic Medical Sonographers                                                343            403          2.19           8             5        13 28.49
 292033  Nuclear Medicine Technologists                                                 199            241          2.64           5             3         8 32.20
 292034  Radiologic Technologists and Technicians                                     1,022          1,210          2.30          24            14        38 24.10
 292051  Dietetic Technicians                                                            21             23          1.19           0             1         1 13.10
 292052  Pharmacy Technicians                                                         1,156          1,508          3.81          44            28        72 14.01
 292053  Psychiatric Technicians                                                        220            230          0.57           1             5         6 11.60
 292054  Respiratory Therapy Technicians                                                 72             74          0.35           0             2         2 21.75
 292055  Surgical Technologists                                                         441            553          3.17          14            11        25 18.06
 292056  Veterinary Technologists and Technicians                                       368            467          3.36          12             9        21 13.44


Source: Florida Agency for Workforce Innovation, Labor Market Statistics Center - September 2010                                                                        16
FLORIDA JOBS by Occupation*
 * Because most industries experienced job declines in the economic downturn that began in 2007, some of the occupational job growth projected in this forecast
 includes the recapturing of jobs lost since that time.
                                                                                                                                              NA
 Duval County                                                                                                                                                 2010
                                                                                                              Annual       Average Annual Openings           Average
   Occupation                                                                         Employment              Percent   Due To     Due To                    Hourly*
   Code       Title                                                                 2010      2018            Change    Growth Separations      Total        Wage ($)
 soc       OccTtl                                                                cur          prj            gpct       aog         aosep         aotot           wg
 292061      Licensed Practical and Licensed Vocational Nurses                        2,187          2,690       2.87          63            68        131    19.54
 292071      Medical Records and Health Information Technicians                         649            756       2.06          13            13         26    15.69
 292081      Opticians, Dispensing                                                      213            245       1.88           4             4          8    16.54
 292091      Orthotists and Prosthetists                                                 41             48       2.13           1             1          2    39.92
 292099      Health Technologists and Technicians, All Other                            437            526       2.55          11             9         20    17.32
 299000    Other Healthcare Practitioners and Technical Occupations                     310            336       1.05           3            10         13      NA
 299091      Athletic Trainers                                                           55             68       2.95           2             2          4    20.31
 299099      Healthcare Practitioners & Technical Workers, All Other                     76             83       1.15           1             3          4    22.42
 310000    Healthcare Support Occupations                                            11,879         14,556       2.82         335           128        463      NA
 311000    Nursing, Psychiatric, and Home Health Aides                                5,971          7,351       2.89         173            57        230      NA
 311011      Home Health Aides                                                        1,028          1,477       5.46          56            10         66    10.57
 311012      Nursing Aides, Orderlies, and Attendants                                 4,821          5,749       2.41         116            46        162    11.87
 312000    Occupational and Physical Therapist Assistants & Aides                       295            361       2.80           8             4         12      NA
 312011      Occupational Therapist Assistants                                           58             73       3.23           2             1          3    29.74
 312021      Physical Therapist Assistants                                              166            209       3.24           5             2          7    29.10
 312022      Physical Therapist Aides                                                    61             69       1.64           1             1          2    11.93
 319000    Other Healthcare Support Occupations                                       5,613          6,844       2.74         154            68        222      NA
 319011      Massage Therapists                                                         233            248       0.80           2             3          5    21.11
 319091      Dental Assistants                                                          914          1,116       2.76          25            17         42    15.60
 319092      Medical Assistants                                                       2,867          3,680       3.54         102            31        133    13.98
 319093      Medical Equipment Preparers                                                461            531       1.90           9             5         14    11.84
 319094      Medical Transcriptionists                                                  362            407       1.55           6             4         10    15.99
 319095      Pharmacy Aides                                                             168            164      -0.30           0             2          2     9.56
 319096      Veterinary Assistants and Laboratory Animal Caretakers                     170            198       2.06           4             2          6    10.67
 319099      Healthcare Support Workers, All Other                                      438            500       1.77           8             5         13    15.17
 330000    Protective Service Occupations                                            11,800         12,425       0.66          81           328        409      NA
 331000    First-Line Supervisors, Protective Service Workers                           508            506      -0.05           1            21         22      NA
 331011      First-Line Supervisors of Correctional Officers                             91             90      -0.14           0             3          3      NA
 331012      First-Line Supervisors of Police and Detectives                            251            243      -0.40           0            11         11    37.54
 331021      First-Line Superv. of Fire Fighting and Prevention Workers                  73             73       0.00           0             4          4    37.00


Source: Florida Agency for Workforce Innovation, Labor Market Statistics Center - September 2010                                                                        17
FLORIDA JOBS by Occupation*
 * Because most industries experienced job declines in the economic downturn that began in 2007, some of the occupational job growth projected in this forecast
 includes the recapturing of jobs lost since that time.
                                                                                                                                              NA
 Duval County                                                                                                                                              2010
                                                                                                              Annual       Average Annual Openings        Average
   Occupation                                                                         Employment              Percent   Due To     Due To                 Hourly*
   Code       Title                                                                 2010      2018            Change    Growth Separations      Total     Wage ($)
 soc       OccTtl                                                                cur          prj            gpct       aog         aosep       aotot          wg
 331099      First-Line Superv., Protective Service Workers, All Other                   93            100       0.94           1           3         4    22.85
 332000    Fire Fighting and Prevention Workers                                       1,271          1,355       0.83          11          38        49      NA
 332011      Fire Fighters                                                            1,205          1,289       0.87          11          36        47    22.88
 332021      Fire Inspectors and Investigators                                           66             66       0.00           0           2         2    24.99
 333000    Law Enforcement Workers                                                    3,323          3,314      -0.03           1          78        79      NA
 333011      Bailiffs                                                                    51             51       0.00           0           1         1    18.22
 333012      Correctional Officers and Jailers                                          861            865       0.06           1          19        20    18.70
 333021      Detectives and Criminal Investigators                                      479            483       0.10           1           9        10    31.69
 333031      Fish and Game Wardens                                                       15             14      -0.83           0           0         0    17.69
 333041      Parking Enforcement Workers                                                 12             11      -1.04           0           0         0      NA
 333051      Police and Sheriff's Patrol Officers                                     1,874          1,862      -0.08           0          47        47    25.26
 333052      Transit and Railroad Police                                                 31             28      -1.21           0           1         1      NA
 339000    Other Protective Service Workers                                           6,698          7,250       1.03          69         191       260      NA
 339011      Animal Control Workers                                                      51             52       0.25           0           2         2    14.10
 339021      Private Detectives and Investigators                                       406            448       1.29           5           8        13    12.82
 339032      Security Guards                                                          5,063          5,380       0.78          40         104       144    10.56
 339091      Crossing Guards                                                            271            272       0.05           0           8         8    10.32
 350000    Food Preparation and Serving Related Occupations                          34,848         37,985       1.13         392       1,325     1,717      NA
 351000    Supervisors, Food Preparation and Serving Workers                          2,280          2,468       1.03          24          21        45      NA
 351011      Chefs and Head Cooks                                                       167            169       0.15           0           2         2    23.93
 351012      First-Line Superv. of Food Preparation & Serving Workers                 2,113          2,299       1.10          23          19        42    15.98
 352000    Cooks and Food Preparation Workers                                         8,670          9,302       0.91          79         263       342      NA
 352011      Cooks, Fast Food                                                         1,369          1,550       1.65          23          36        59     8.39
 352014      Cooks, Restaurant                                                        3,337          3,495       0.59          20          88       108    11.03
 352021      Food Preparation Workers                                                 3,008          3,171       0.68          20         114       134     9.21
 353000    Food and Beverage Serving Workers                                         19,105         21,165       1.35         258         778     1,036      NA
 353011      Bartenders                                                               1,306          1,376       0.67           9          46        55     9.63
 353021      Food Preparation & Serving Workers, Including Fast Food                  7,841          9,299       2.32         182         159       341     8.45
 353022      Counter Attendants, Cafeteria, and Coffee Shop                           1,349          1,501       1.41          19         115       134     8.60
 353031      Waiters and Waitresses                                                   8,011          8,312       0.47          38         449       487     9.84


Source: Florida Agency for Workforce Innovation, Labor Market Statistics Center - September 2010                                                                     18
FLORIDA JOBS by Occupation*
 * Because most industries experienced job declines in the economic downturn that began in 2007, some of the occupational job growth projected in this forecast
 includes the recapturing of jobs lost since that time.
                                                                                                                                              NA
 Duval County                                                                                                                                                   2010
                                                                                                              Annual          Average Annual Openings          Average
   Occupation                                                                         Employment              Percent      Due To     Due To                   Hourly*
   Code       Title                                                                 2010      2018            Change       Growth Separations      Total       Wage ($)
 soc       OccTtl                                                                cur          prj            gpct          aog         aosep         aotot          wg
 353041      Food Servers, Nonrestaurant                                                598            677          1.65          10            11        21    10.05
 359000    Other Food Preparation and Serving Related Workers                         4,793          5,050          0.67          32           263       295      NA
 359011      Dining Room & Cafeteria Attendants & Bartender Helpers                   1,062          1,140          0.92          10            50        60     8.66
 359021      Dishwashers                                                              2,052          2,199          0.90          18            93       111     8.50
 359031      Hosts, Restaurant, Lounge, and Coffee Shop                               1,108          1,133          0.28           3            87        90     8.95
 370000    Building & Grounds Cleaning & Maintenance Occupations                     15,916         17,320          1.10         176           263       439      NA
 371000    Superv., Building & Grounds Cleaning & Maintenance                         1,182          1,313          1.39          16            12        28      NA
 371011      First-Line Superv. of Housekeeping & Janitorial Workers                    354            376          0.78           3             3         6    17.42
 372000    Building Cleaning and Pest Control Workers                                10,179         10,718          0.66          67           198       265      NA
 372021      Pest Control Workers                                                       716            797          1.41          10            25        35    13.21
 373000    Grounds Maintenance Workers                                                4,555          5,289          2.01          92            54       146      NA
 373011      Landscaping and Groundskeeping Workers                                   3,872          4,462          1.90          74            46       120    11.46
 373019      Grounds Maintenance Workers, All Other                                     134            182          4.48           6             2         8    14.24
 390000    Personal Care and Service Occupations                                     13,913         15,551          1.47         207           375       582      NA
 392000    Animal Care and Service Workers                                              455            533          2.14          10            10        20      NA
 393000    Entertainment Attendants and Related Workers                               1,836          2,107          1.85          34           115       149      NA
 393031      Ushers, Lobby Attendants, and Ticket Takers                                869          1,020          2.17          19            61        80     8.43
 393091      Amusement and Recreation Attendants                                        718            814          1.67          12            41        53     8.63
 393093      Locker Room, Coatroom, and Dressing Room Attendants                         48             52          1.04           1             3         4    10.68
 394000    Funeral Service Workers                                                      177            213          2.54           5             8        13      NA
 394021      Funeral Attendants                                                         155            189          2.74           4             7        11     9.17
 395000    Personal Appearance Workers                                                2,186          2,242          0.32           8            31        39      NA
 395012      Hairdressers, Hairstylists, and Cosmetologists                           1,590          1,633          0.34           5            23        28    15.07
 395092      Manicurists and Pedicurists                                                262            264          0.10           0             4         4    11.40
 395094      Skin Care Specialists                                                      126            145          1.88           2             2         4    18.80
 396000    Transportation, Tourism, and Lodging Attendants                              435            464          0.83           4            12        16      NA
 396011      Baggage Porters and Bellhops                                               172            190          1.31           2             4         6     9.37
 396012      Concierges                                                                  57             65          1.75           1             2         3    12.13
 396021      Tour Guides and Escorts                                                     95             97          0.26           0             4         4    10.49
 399000    Other Personal Care and Service Workers                                    8,187          9,278          1.67         136           182       318      NA


Source: Florida Agency for Workforce Innovation, Labor Market Statistics Center - September 2010                                                                          19
Duval  Job  Projection  Figures

More Related Content

Similar to Duval Job Projection Figures

Industry msd 2009_qp
Industry msd 2009_qpIndustry msd 2009_qp
Industry msd 2009_qpvtsiri
 
Financial analysis 2008
Financial analysis 2008Financial analysis 2008
Financial analysis 2008Petrobras
 
Financial analysis 2008
Financial analysis 2008Financial analysis 2008
Financial analysis 2008Petrobras
 
Hindalco Industries Limited, Renukoot
Hindalco Industries Limited, RenukootHindalco Industries Limited, Renukoot
Hindalco Industries Limited, RenukootIndia Water Portal
 
Nasbla 03 2
Nasbla 03 2Nasbla 03 2
Nasbla 03 2NASBLA
 
conoco phillips 2008 First Quarter
conoco phillips 2008 First Quarterconoco phillips 2008 First Quarter
conoco phillips 2008 First Quarterfinance1
 
conoco phillips 2008Fourth Quarter
conoco phillips 2008Fourth Quarterconoco phillips 2008Fourth Quarter
conoco phillips 2008Fourth Quarterfinance1
 
PHILIPPINE METALLIC MINERAL PRODUCTION 2011 vs 2010 (As of March 2012)
PHILIPPINE METALLIC MINERAL PRODUCTION 2011 vs 2010 (As of March 2012)PHILIPPINE METALLIC MINERAL PRODUCTION 2011 vs 2010 (As of March 2012)
PHILIPPINE METALLIC MINERAL PRODUCTION 2011 vs 2010 (As of March 2012)No to mining in Palawan
 
2010 Financial Analysis and Accounting Statements
2010 Financial Analysis and Accounting Statements2010 Financial Analysis and Accounting Statements
2010 Financial Analysis and Accounting StatementsPetrobras
 
Philippine Metallic Mineral Production - May 2011
Philippine Metallic Mineral Production - May 2011Philippine Metallic Mineral Production - May 2011
Philippine Metallic Mineral Production - May 2011No to mining in Palawan
 
conoco phillips 2008Third Quarter
conoco phillips 2008Third Quarterconoco phillips 2008Third Quarter
conoco phillips 2008Third Quarterfinance1
 
Tamara babayan
Tamara babayanTamara babayan
Tamara babayanindrih
 

Similar to Duval Job Projection Figures (17)

Industry msd 2009_qp
Industry msd 2009_qpIndustry msd 2009_qp
Industry msd 2009_qp
 
IDBI
IDBIIDBI
IDBI
 
Financial analysis 2008
Financial analysis 2008Financial analysis 2008
Financial analysis 2008
 
Financial analysis 2008
Financial analysis 2008Financial analysis 2008
Financial analysis 2008
 
Hindalco Industries Limited, Renukoot
Hindalco Industries Limited, RenukootHindalco Industries Limited, Renukoot
Hindalco Industries Limited, Renukoot
 
Nasbla 03 2
Nasbla 03 2Nasbla 03 2
Nasbla 03 2
 
conoco phillips 2008 First Quarter
conoco phillips 2008 First Quarterconoco phillips 2008 First Quarter
conoco phillips 2008 First Quarter
 
conoco phillips 2008Fourth Quarter
conoco phillips 2008Fourth Quarterconoco phillips 2008Fourth Quarter
conoco phillips 2008Fourth Quarter
 
Philippine Metallic Mineral Production
Philippine Metallic Mineral ProductionPhilippine Metallic Mineral Production
Philippine Metallic Mineral Production
 
Metallic Production
Metallic ProductionMetallic Production
Metallic Production
 
Metallic Production
Metallic ProductionMetallic Production
Metallic Production
 
PHILIPPINE METALLIC MINERAL PRODUCTION 2011 vs 2010 (As of March 2012)
PHILIPPINE METALLIC MINERAL PRODUCTION 2011 vs 2010 (As of March 2012)PHILIPPINE METALLIC MINERAL PRODUCTION 2011 vs 2010 (As of March 2012)
PHILIPPINE METALLIC MINERAL PRODUCTION 2011 vs 2010 (As of March 2012)
 
2010 Financial Analysis and Accounting Statements
2010 Financial Analysis and Accounting Statements2010 Financial Analysis and Accounting Statements
2010 Financial Analysis and Accounting Statements
 
The Science of Start
The Science of Start The Science of Start
The Science of Start
 
Philippine Metallic Mineral Production - May 2011
Philippine Metallic Mineral Production - May 2011Philippine Metallic Mineral Production - May 2011
Philippine Metallic Mineral Production - May 2011
 
conoco phillips 2008Third Quarter
conoco phillips 2008Third Quarterconoco phillips 2008Third Quarter
conoco phillips 2008Third Quarter
 
Tamara babayan
Tamara babayanTamara babayan
Tamara babayan
 

Duval Job Projection Figures

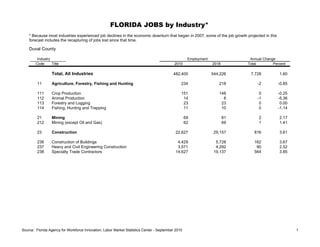
  • 1. FLORIDA JOBS by Industry* * Because most industries experienced job declines in the economic downturn that began in 2007, some of the job growth projected in this forecast includes the recapturing of jobs lost since that time. Duval County Industry Employment Annual Change Code Title 2010 2018 Total Percent Total, All Industries 482,400 544,226 7,728 1.60 11 Agriculture, Forestry, Fishing and Hunting 234 218 -2 -0.85 111 Crop Production 151 148 0 -0.25 112 Animal Production 14 8 -1 -5.36 113 Forestry and Logging 23 23 0 0.00 114 Fishing, Hunting and Trapping 11 10 0 -1.14 21 Mining 69 81 2 2.17 212 Mining (except Oil and Gas) 62 69 1 1.41 23 Construction 22,627 29,157 816 3.61 236 Construction of Buildings 4,429 5,728 162 3.67 237 Heavy and Civil Engineering Construction 3,571 4,292 90 2.52 238 Specialty Trade Contractors 14,627 19,137 564 3.85 Source: Florida Agency for Workforce Innovation, Labor Market Statistics Center - September 2010 1
  • 2. FLORIDA JOBS by Industry* * Because most industries experienced job declines in the economic downturn that began in 2007, some of the job growth projected in this forecast includes the recapturing of jobs lost since that time. Duval County Industry Employment Annual Change Code Title 2010 2018 Total Percent Manufacturing 22,501 24,632 266 1.18 Durable Goods Manufacturing 13,367 15,930 320 2.40 321 Wood Product Manufacturing 508 591 10 2.04 327 Nonmetallic Mineral Product Manufacturing 1,293 1,422 16 1.25 331 Primary Metal Manufacturing 545 575 4 0.69 332 Fabricated Metal Product Manufacturing 2,194 2,814 78 3.53 333 Machinery Manufacturing 912 1,017 13 1.44 334 Computer and Electronic Product Manufacturing 445 332 -14 -3.17 335 Electrical Equipment and Appliance Manufacturing 370 435 8 2.20 336 Transportation Equipment Manufacturing 2,873 3,806 117 4.06 337 Furniture and Related Product Manufacturing 503 409 -12 -2.34 339 Miscellaneous Manufacturing 3,724 4,529 101 2.70 Non-Durable Goods Manufacturing 9,134 8,702 -54 -0.59 311 Food Manufacturing 1,617 1,465 -19 -1.18 312 Beverage and Tobacco Product Manufacturing 2,722 2,600 -15 -0.56 314 Textile Product Mills 88 114 3 3.69 315 Apparel Manufacturing 100 120 2 2.50 322 Paper Manufacturing 1,614 1,626 2 0.09 323 Printing and Related Support Activities 941 751 -24 -2.52 324 Petroleum and Coal Products Manufacturing 216 208 -1 -0.46 325 Chemical Manufacturing 1,158 1,047 -14 -1.20 326 Plastics and Rubber Products Manufacturing 625 714 11 1.78 Source: Florida Agency for Workforce Innovation, Labor Market Statistics Center - September 2010 2
  • 3. FLORIDA JOBS by Industry* * Because most industries experienced job declines in the economic downturn that began in 2007, some of the job growth projected in this forecast includes the recapturing of jobs lost since that time. Duval County Industry Employment Annual Change Code Title 2010 2018 Total Percent Trade, Transportation, and Utilities 96,711 109,018 1,538 1.59 22 Utilities 236 228 -1 -0.42 42 Wholesale Trade 22,200 26,179 497 2.24 423 Merchant Wholesalers, Durable Goods 12,046 14,803 345 2.86 424 Merchant Wholesalers, Nondurable Goods 7,232 8,072 105 1.45 425 Wholesale Electronic Markets and Agents and Brokers 2,922 3,304 48 1.63 44 Retail Trade 49,269 54,653 673 1.37 441 Motor Vehicle and Parts Dealers 7,246 8,044 100 1.38 442 Furniture and Home Furnishings Stores 1,519 1,853 42 2.75 443 Electronics and Appliance Stores 1,826 2,313 61 3.33 444 Building Material and Garden Supply Stores 3,652 4,029 47 1.29 445 Food and Beverage Stores 8,699 9,064 46 0.52 446 Health and Personal Care Stores 2,760 3,097 42 1.53 447 Gasoline Stations 2,343 2,153 -24 -1.01 448 Clothing and Clothing Accessories Stores 6,029 7,104 134 2.23 451 Sporting Goods, Hobby, Book, and Music Stores 2,175 2,452 35 1.59 452 General Merchandise Stores 9,463 10,745 160 1.69 453 Miscellaneous Store Retailers 2,552 2,688 17 0.67 454 Nonstore Retailers 1,005 1,111 13 1.32 Source: Florida Agency for Workforce Innovation, Labor Market Statistics Center - September 2010 3
  • 4. FLORIDA JOBS by Industry* * Because most industries experienced job declines in the economic downturn that began in 2007, some of the job growth projected in this forecast includes the recapturing of jobs lost since that time. Duval County Industry Employment Annual Change Code Title 2010 2018 Total Percent 48 Transportation and Warehousing 25,006 27,958 369 1.48 481 Air Transportation 451 516 8 1.80 482 Rail Transportation 2,433 2,272 -20 -0.83 483 Water Transportation 838 893 7 0.82 484 Truck Transportation 6,437 7,430 124 1.93 485 Transit and Ground Passenger Transport 1,992 2,023 4 0.19 487 Scenic and Sightseeing Transportation 108 121 2 1.50 488 Support Activities for Transportation 5,183 6,151 121 2.33 492 Couriers and Messengers 4,360 5,021 83 1.90 493 Warehousing and Storage 3,204 3,531 41 1.28 51 Information 8,334 8,476 18 0.21 511 Publishing Industries 1,292 1,384 12 0.89 512 Motion Picture and Sound Recording Industries 546 541 -1 -0.11 515 Broadcasting (except Internet) 868 940 9 1.04 517 Telecommunications 3,680 3,565 -14 -0.39 518 ISPs, Web Search Portals, and Data Processing Services 1,698 1,745 6 0.35 519 Other Information Services 250 301 6 2.55 Financial Activities 49,185 53,179 499 1.02 52 Finance and Insurance 42,296 45,428 392 0.93 522 Credit Intermediation and Related Activities 20,900 22,673 222 1.06 523 Securities, Commodity Contracts, and Other Investments 4,267 5,442 147 3.44 524 Insurance Carriers and Related Activities 16,805 17,066 33 0.19 525 Funds, Trusts, and Other Financial Vehicles 171 37 -17 -9.80 Source: Florida Agency for Workforce Innovation, Labor Market Statistics Center - September 2010 4
  • 5. FLORIDA JOBS by Industry* * Because most industries experienced job declines in the economic downturn that began in 2007, some of the job growth projected in this forecast includes the recapturing of jobs lost since that time. Duval County Industry Employment Annual Change Code Title 2010 2018 Total Percent 53 Real Estate and Rental and Leasing 6,889 7,751 108 1.56 531 Real Estate 4,572 5,068 62 1.36 532 Rental and Leasing Services 2,211 2,569 45 2.02 533 Lessors of Nonfinancial Intangible Assets 106 114 1 0.94 Professional and Business Services 69,716 84,404 1,836 2.63 54 Professional, Scientific, and Technical Services 28,438 35,578 892 3.14 55 Management of Companies and Enterprises 5,824 6,890 133 2.29 56 Administrative and Support and Waste Management 35,454 41,936 810 2.29 561 Administrative and Support Services 34,217 40,640 803 2.35 562 Waste Management and Remediation Service 1,237 1,296 7 0.60 Education and Health Services 67,394 81,017 1,703 2.53 61 Educational Services 7,562 9,008 181 2.39 62 Health Care and Social Assistance 59,832 72,009 1,522 2.54 621 Ambulatory Health Care Services 25,505 32,512 876 3.43 622 Hospitals 20,084 22,625 318 1.58 623 Nursing and Residential Care Facilities 7,630 9,257 203 2.67 624 Social Assistance 6,613 7,615 125 1.89 Leisure and Hospitality 42,532 45,883 419 0.98 71 Arts, Entertainment, and Recreation 5,568 6,064 62 1.11 711 Performing Arts, Spectator Sports, and Related Industries 1,650 1,711 8 0.46 712 Museums, Historical Sites, and Similar Institutions 372 408 4 1.21 713 Amusement, Gambling, and Recreation Industries 3,546 3,945 50 1.41 Source: Florida Agency for Workforce Innovation, Labor Market Statistics Center - September 2010 5
  • 6. FLORIDA JOBS by Industry* * Because most industries experienced job declines in the economic downturn that began in 2007, some of the job growth projected in this forecast includes the recapturing of jobs lost since that time. Duval County Industry Employment Annual Change Code Title 2010 2018 Total Percent 72 Accommodation and Food Services 36,964 39,819 357 0.97 721 Accommodation 4,611 4,898 36 0.78 722 Food Services and Drinking Places 32,353 34,921 321 0.99 81 Other Services (Except Government) 17,794 19,903 264 1.48 811 Repair and Maintenance 4,889 5,532 80 1.64 812 Personal and Laundry Services 3,735 3,959 28 0.75 813 Membership Associations and Organizations 9,170 10,412 155 1.69 Government 51,977 51,760 -27 -0.05 Federal Government 15,920 14,323 -200 -1.25 State Government 8,231 8,598 46 0.56 Local Government 27,826 28,839 127 0.46 Self-Employed and Unpaid Family Workers 33,326 36,498 396 1.19 Source: Florida Agency for Workforce Innovation, Labor Market Statistics Center - September 2010 6
  • 7. FASTEST-GROWING INDUSTRIES* * Because most industries experienced job declines in the economic downturn that began in 2007, some of the job growth projected in this forecast includes the recapturing of jobs lost since that time. Duval County Industry Employment Annual Change Rank Code Title 2010 2018 Total Percent naic indtitle curr proj Achng Aperch 1 336 Transportation Equipment Manufacturing 2,873 3,806 117 4.06 2 238 Specialty Trade Contractors 14,627 19,137 564 3.85 3 236 Construction of Buildings 4,429 5,728 162 3.67 4 332 Fabricated Metal Product Manufacturing 2,194 2,814 78 3.53 5 523 Securities, Commodity Contracts, and Other Investments 4,267 5,442 147 3.44 6 621 Ambulatory Health Care Services 25,505 32,512 876 3.43 7 443 Electronics and Appliance Stores 1,826 2,313 61 3.33 8 540 Professional, Scientific, and Technical Services 28,438 35,578 892 3.14 9 423 Merchant Wholesalers, Durable Goods 12,046 14,803 345 2.86 10 442 Furniture and Home Furnishings Stores 1,519 1,853 42 2.75 11 339 Miscellaneous Manufacturing 3,724 4,529 101 2.70 12 623 Nursing and Residential Care Facilities 7,630 9,257 203 2.67 13 237 Heavy and Civil Engineering Construction 3,571 4,292 90 2.52 14 610 Educational Services 7,562 9,008 181 2.39 15 561 Administrative and Support Services 34,217 40,640 803 2.35 16 488 Support Activities for Transportation 5,183 6,151 121 2.33 17 550 Management of Companies and Enterprises 5,824 6,890 133 2.29 18 448 Clothing and Clothing Accessories Stores 6,029 7,104 134 2.23 19 321 Wood Product Manufacturing 508 591 10 2.04 20 532 Rental and Leasing Services 2,211 2,569 45 2.02 This table includes industries with a minimum of 400 jobs in 2010. Source: Florida Agency for Workforce Innovation, Labor Market Statistics Center - September 2010 7
  • 8. INDUSTRIES GAINING THE MOST NEW JOBS* * Because most industries experienced job declines in the economic downturn that began in 2007, some of the job growth projected in this forecast includes the recapturing of jobs lost since that time. Duval County Industry Employment Annual Change Rank Code Title 2010 2018 Total Percent naic indtitle curr proj Achng Aperch 1 540 Professional, Scientific, and Technical Services 28,438 35,578 892 3.14 2 621 Ambulatory Health Care Services 25,505 32,512 876 3.43 3 561 Administrative and Support Services 34,217 40,640 803 2.35 4 238 Specialty Trade Contractors 14,627 19,137 564 3.85 5 423 Merchant Wholesalers, Durable Goods 12,046 14,803 345 2.86 6 722 Food Services and Drinking Places 32,353 34,921 321 0.99 7 622 Hospitals 20,084 22,625 318 1.58 8 522 Credit Intermediation and Related Activities 20,900 22,673 222 1.06 9 623 Nursing and Residential Care Facilities 7,630 9,257 203 2.67 10 610 Educational Services 7,562 9,008 181 2.39 11 236 Construction of Buildings 4,429 5,728 162 3.67 12 452 General Merchandise Stores 9,463 10,745 160 1.69 13 813 Membership Associations and Organizations 9,170 10,412 155 1.69 14 523 Securities, Commodity Contracts, and Other Investments 4,267 5,442 147 3.44 15 448 Clothing and Clothing Accessories Stores 6,029 7,104 134 2.23 16 550 Management of Companies and Enterprises 5,824 6,890 133 2.29 17 930 Local Government 27,826 28,839 127 0.46 18 624 Social Assistance 6,613 7,615 125 1.89 19 484 Truck Transportation 6,437 7,430 124 1.93 20 488 Support Activities for Transportation 5,183 6,151 121 2.33 Source: Florida Agency for Workforce Innovation, Labor Market Statistics Center - September 2010 8
  • 9. FLORIDA JOBS by Occupation* * Because most industries experienced job declines in the economic downturn that began in 2007, some of the occupational job growth projected in this forecast includes the recapturing of jobs lost since that time. NA Duval County 2010 Annual Average Annual Openings Average Occupation Employment Percent Due To Due To Hourly* Code Title 2010 2018 Change Growth Separations Total Wage ($) soc OccTtl cur prj gpct aog aosep aotot wg 000000 Total, All Occupations 482,796 544,226 1.59 7,959 11,105 19,064 NA 110000 Management Occupations 17,718 19,704 1.40 251 387 638 NA 111000 Top Executives 4,802 5,049 0.64 31 136 167 NA 111021 General and Operations Managers 3,435 3,603 0.61 21 98 119 46.59 111031 Legislators 65 61 -0.77 0 2 2 26.97 112000 Marketing, Public Relations & Sales Managers 1,680 2,000 2.38 40 36 76 NA 112011 Advertising and Promotions Managers 86 90 0.58 1 2 3 54.61 112021 Marketing Managers 314 359 1.79 6 7 13 58.38 112022 Sales Managers 1,192 1,453 2.74 33 26 59 61.27 113000 Operations Specialties Managers 3,756 4,124 1.22 47 75 122 NA 113021 Computer and Information Systems Managers 703 788 1.51 11 11 22 56.75 113041 Compensation and Benefits Managers 140 152 1.07 2 3 5 44.40 113049 Human Resources Managers, All Other 178 210 2.25 4 4 8 38.30 113051 Industrial Production Managers 207 224 1.03 2 7 9 51.39 113071 Transportation, Storage, and Distribution Managers 404 394 -0.31 0 11 11 44.44 119000 Other Management Occupations 7,480 8,531 1.76 133 140 273 NA 119011 Farm, Ranch, and Other Agricultural Managers 35 36 0.36 0 1 1 NA 119012 Farmers and Ranchers 109 99 -1.15 0 1 1 NA 119021 Construction Managers 1,722 2,174 3.28 57 12 69 61.41 119031 Education Administrators, Preschool and Child Care 69 78 1.63 1 2 3 26.82 119032 Education Administrators, Elementary and Secondary 230 249 1.03 2 7 9 51.23 119033 Education Administrators, Postsecondary 105 107 0.24 0 3 3 45.82 119041 Engineering Managers 397 501 3.27 13 8 21 51.83 119051 Food Service Managers 813 850 0.57 5 16 21 24.66 119061 Funeral Directors 54 61 1.62 1 1 2 21.76 119081 Lodging Managers 120 128 0.83 1 3 4 28.84 119111 Medical and Health Services Managers 474 554 2.11 10 9 19 47.26 119121 Natural Sciences Managers 47 53 1.60 1 1 2 56.50 119131 Postmasters and Mail Superintendents 17 16 -0.74 0 0 0 38.79 119141 Property, Real Estate & Community Association Managers 817 898 1.24 10 14 24 29.60 Source: Florida Agency for Workforce Innovation, Labor Market Statistics Center - September 2010 9
  • 10. FLORIDA JOBS by Occupation* * Because most industries experienced job declines in the economic downturn that began in 2007, some of the occupational job growth projected in this forecast includes the recapturing of jobs lost since that time. NA Duval County 2010 Annual Average Annual Openings Average Occupation Employment Percent Due To Due To Hourly* Code Title 2010 2018 Change Growth Separations Total Wage ($) soc OccTtl cur prj gpct aog aosep aotot wg 119199 Managers, All Other 2,305 2,539 1.27 29 59 88 44.03 130000 Business and Financial Operations Occupations 30,369 34,561 1.73 527 571 1,098 NA 131000 Business Operations Specialists 16,817 18,976 1.60 270 354 624 NA 131021 Purchasing Agents and Buyers, Farm Products 18 18 0.00 0 0 0 24.05 131022 Wholesale and Retail Buyers, Except Farm Products 278 300 0.99 3 7 10 25.48 131023 Purchasing Agents, Except Farm Products & Trade 902 1,050 2.05 19 23 42 26.54 131031 Claims Adjusters, Examiners, and Investigators 1,294 1,315 0.20 3 33 36 29.44 131041 Compliance Officers, Exc. Safety, Agri, Constr & Transp. 1,065 1,276 2.48 26 10 36 24.09 131051 Cost Estimators 778 1,046 4.31 34 17 51 30.52 131071 Employment, Recruitment, and Placement Specialists 893 1,173 3.92 35 23 58 20.55 131073 Training and Development Specialists 918 1,136 2.97 27 24 51 24.59 131079 Human Resources, Training, & Labor Relations Specialists, All Other 728 872 2.47 18 19 37 26.83 131111 Management Analysts 3,672 3,947 0.94 34 61 95 34.48 131121 Meeting and Convention Planners 352 436 2.98 11 8 19 18.45 131199 Business Operations Specialists, All Other 5,126 5,455 0.80 41 111 152 29.63 132000 Financial Specialists 13,552 15,585 1.88 257 217 474 NA 132011 Accountants and Auditors 4,944 5,874 2.35 116 81 197 28.71 132021 Appraisers and Assessors of Real Estate 431 445 0.41 2 8 10 21.86 132041 Credit Analysts 647 759 2.16 14 11 25 32.03 132051 Financial Analysts 552 646 2.13 12 10 22 32.46 132052 Personal Financial Advisors 1,143 1,526 4.19 48 12 60 30.38 132053 Insurance Underwriters 644 640 -0.08 0 19 19 25.52 132061 Financial Examiners 117 159 4.49 5 2 7 39.29 132071 Loan Counselors 88 99 1.56 1 1 2 22.42 132072 Loan Officers 2,618 2,977 1.71 45 27 72 28.95 132081 Tax Examiners, Collectors, and Revenue Agents 393 382 -0.35 0 14 14 NA 132082 Tax Preparers 381 372 -0.30 0 6 6 10.23 150000 Computer and Mathematical Occupations 13,409 15,943 2.36 321 263 584 NA 151000 Computer Specialists 12,823 15,265 2.38 310 247 557 NA 151031 Computer Software Engineers, Applications 1,809 2,304 3.42 62 14 76 41.59 Source: Florida Agency for Workforce Innovation, Labor Market Statistics Center - September 2010 10
  • 11. FLORIDA JOBS by Occupation* * Because most industries experienced job declines in the economic downturn that began in 2007, some of the occupational job growth projected in this forecast includes the recapturing of jobs lost since that time. NA Duval County 2010 Annual Average Annual Openings Average Occupation Employment Percent Due To Due To Hourly* Code Title 2010 2018 Change Growth Separations Total Wage ($) soc OccTtl cur prj gpct aog aosep aotot wg 151032 Computer Software Engineers, Systems Software 747 896 2.49 19 6 25 46.75 151041 Computer Support Specialists 3,858 4,646 2.55 99 106 205 20.11 151051 Computer Systems Analysts 1,807 2,042 1.63 29 38 67 33.08 151071 Network and Computer Systems Administrators 933 1,100 2.24 21 15 36 30.68 151081 Network Systems and Data Communications Analysts 1,251 1,821 5.70 71 22 93 34.84 151099 Computer Specialists, All Other 470 467 -0.08 0 10 10 34.54 152000 Mathematical Scientists 586 678 1.96 12 16 28 NA 152031 Operations Research Analysts 526 616 2.14 11 15 26 26.17 170000 Architecture and Engineering Occupations 7,766 9,323 2.51 195 156 351 NA 171000 Architects, Surveyors, and Cartographers 750 926 2.93 22 14 36 NA 171011 Architects, Except Landscape and Naval 398 481 2.61 10 7 17 28.39 171022 Surveyors 150 186 3.00 5 4 9 28.34 172000 Engineers 4,364 5,286 2.64 115 91 206 NA 172041 Chemical Engineers 23 28 2.72 1 1 2 32.29 172071 Electrical Engineers 214 226 0.70 2 5 7 36.42 172072 Electronics Engineers, Except Computer 295 309 0.59 2 7 9 37.85 172111 Health and Safety Engineers, Except Mining 49 56 1.79 1 1 2 30.78 172112 Industrial Engineers 605 783 3.68 22 15 37 32.90 172199 Engineers, All Other 512 601 2.17 11 10 21 41.74 173000 Drafters, Engineering, and Mapping Technicians 2,652 3,111 2.16 57 51 108 NA 173011 Architectural and Civil Drafters 443 520 2.17 10 9 19 20.86 173012 Electrical and Electronics Drafters 115 146 3.37 4 3 7 24.18 173013 Mechanical Drafters 145 170 2.16 3 3 6 22.32 173023 Electrical and Electronic Engineering Technicians 672 750 1.45 10 13 23 26.25 173024 Electro-Mechanical Technicians 47 52 1.33 1 1 2 17.07 173025 Environmental Engineering Technicians 66 82 3.03 2 1 3 21.62 173027 Mechanical Engineering Technicians 27 33 2.78 1 1 2 21.85 173029 Engineering Technicians, Except Drafters, All Other 288 304 0.69 2 5 7 30.01 173031 Surveying and Mapping Technicians 431 545 3.31 14 8 22 17.09 190000 Life, Physical, and Social Science Occupations 2,887 3,290 1.74 52 87 139 NA Source: Florida Agency for Workforce Innovation, Labor Market Statistics Center - September 2010 11
  • 12. FLORIDA JOBS by Occupation* * Because most industries experienced job declines in the economic downturn that began in 2007, some of the occupational job growth projected in this forecast includes the recapturing of jobs lost since that time. NA Duval County 2010 Annual Average Annual Openings Average Occupation Employment Percent Due To Due To Hourly* Code Title 2010 2018 Change Growth Separations Total Wage ($) soc OccTtl cur prj gpct aog aosep aotot wg 191000 Life Scientists 518 639 2.92 15 13 28 NA 191012 Food Scientists and Technologists 26 34 3.85 1 1 2 32.80 191023 Zoologists and Wildlife Biologists 27 26 -0.46 0 1 1 26.75 191029 Biological Scientists, All Other 146 147 0.09 0 5 5 36.51 191032 Foresters 25 25 0.00 0 0 0 19.76 191042 Medical Scientists, Except Epidemiologists 212 307 5.60 12 4 16 NA 192000 Physical Scientists 586 630 0.94 6 17 23 NA 192042 Geoscientists, Except Hydrologists and Geographers 88 106 2.56 2 3 5 34.42 193000 Social Scientists and Related Workers 1,083 1,236 1.77 20 31 51 NA 193021 Market Research Analysts 477 581 2.73 13 13 26 26.80 193039 Psychologists, All Other 32 35 1.17 0 1 1 55.41 193091 Anthropologists and Archeologists 26 27 0.48 0 1 1 28.43 193099 Social Scientists and Related Workers, All Other 72 77 0.87 1 4 5 30.48 194000 Life, Physical, and Social Science Technicians 700 785 1.52 11 27 38 NA 194021 Biological Technicians 69 71 0.36 0 3 3 16.88 194031 Chemical Technicians 109 126 1.95 2 2 4 16.44 210000 Community and Social Services Occupations 5,708 6,423 1.57 89 120 209 NA 211000 Social Workers & Community & Social Service Specialists 4,123 4,564 1.34 55 90 145 NA 211011 Substance Abuse and Behavioral Disorder Counselors 131 142 1.05 1 3 4 17.97 211012 Educational, Vocational, and School Counselors 692 746 0.98 7 14 21 25.06 211019 Counselors, All Other 121 134 1.34 2 2 4 17.09 211022 Medical and Public Health Social Workers 351 440 3.17 11 9 20 23.13 211029 Social Workers, All Other 202 220 1.11 2 5 7 21.90 211092 Probation Officers and Correctional Treatment Specialists 167 177 0.75 1 4 5 19.47 211093 Social and Human Service Assistants 544 575 0.71 4 11 15 14.08 212000 Religious Workers 1,585 1,859 2.16 34 30 64 NA 212011 Clergy 640 750 2.15 14 12 26 20.05 212021 Directors, Religious Activities and Education 770 905 2.19 17 15 32 17.95 230000 Legal Occupations 4,467 4,768 0.84 39 69 108 NA 231000 Lawyers, Judges, and Related Workers 2,432 2,531 0.51 13 44 57 NA Source: Florida Agency for Workforce Innovation, Labor Market Statistics Center - September 2010 12
  • 13. FLORIDA JOBS by Occupation* * Because most industries experienced job declines in the economic downturn that began in 2007, some of the occupational job growth projected in this forecast includes the recapturing of jobs lost since that time. NA Duval County 2010 Annual Average Annual Openings Average Occupation Employment Percent Due To Due To Hourly* Code Title 2010 2018 Change Growth Separations Total Wage ($) soc OccTtl cur prj gpct aog aosep aotot wg 231021 Admin. Law Judges, Adjudicators, and Hearing Officers 57 55 -0.44 0 1 1 NA 231022 Arbitrators, Mediators, and Conciliators 24 26 1.04 0 0 0 24.19 232000 Legal Support Workers 2,035 2,237 1.24 26 25 51 NA 232091 Court Reporters 46 55 2.45 1 1 2 10.81 232092 Law Clerks 101 107 0.74 1 2 3 18.57 232093 Title Examiners, Abstractors, and Searchers 511 503 -0.20 0 7 7 19.74 250000 Education, Training, and Library Occupations 18,933 21,278 1.55 293 391 684 NA 251000 Postsecondary Teachers 4,056 4,585 1.63 66 70 136 NA 251011 Business Teachers, Postsecondary 214 247 1.93 4 4 8 48.30 251021 Computer Science Teachers, Postsecondary 63 73 1.98 1 1 2 44.86 251022 Mathematical Science Teachers, Postsecondary 101 116 1.86 2 2 4 34.09 251032 Engineering Teachers, Postsecondary 40 46 1.88 1 1 2 NA 251042 Biological Science Teachers, Postsecondary 79 92 2.06 2 1 3 45.28 251052 Chemistry Teachers, Postsecondary 34 40 2.21 1 1 2 33.27 251054 Physics Teachers, Postsecondary 32 37 1.95 1 1 2 34.89 251061 Anthropology and Archeology Teachers, Postsecondary 22 25 1.70 0 0 0 NA 251063 Economics Teachers, Postsecondary 53 61 1.89 1 1 2 39.74 251064 Geography Teachers, Postsecondary 12 13 1.04 0 0 0 31.18 251065 Political Science Teachers, Postsecondary 48 56 2.08 1 1 2 40.37 251066 Psychology Teachers, Postsecondary 85 98 1.91 2 2 4 30.37 251067 Sociology Teachers, Postsecondary 35 41 2.14 1 1 2 34.74 251069 Social Sciences Teachers, Postsecondary, All Other 12 14 2.08 0 0 0 NA 251071 Health Specialties Teachers, Postsecondary 820 949 1.97 16 14 30 100.44 251072 Nursing Instructors and Teachers, Postsecondary 122 142 2.05 3 2 5 46.04 251081 Education Teachers, Postsecondary 138 159 1.90 3 2 5 32.82 251111 Criminal Justice & Law Enforcement Teachers, Postsecondary 11 13 2.27 0 0 0 NA 251112 Law Teachers, Postsecondary 30 35 2.08 1 1 2 50.91 251121 Art, Drama, and Music Teachers, Postsecondary 221 256 1.98 4 4 8 27.81 251122 Communications Teachers, Postsecondary 94 108 1.86 2 2 4 27.57 251123 English Language & Literature Teachers, Postsecondary 149 173 2.01 3 3 6 29.48 Source: Florida Agency for Workforce Innovation, Labor Market Statistics Center - September 2010 13
  • 14. FLORIDA JOBS by Occupation* * Because most industries experienced job declines in the economic downturn that began in 2007, some of the occupational job growth projected in this forecast includes the recapturing of jobs lost since that time. NA Duval County 2010 Annual Average Annual Openings Average Occupation Employment Percent Due To Due To Hourly* Code Title 2010 2018 Change Growth Separations Total Wage ($) soc OccTtl cur prj gpct aog aosep aotot wg 251124 Foreign Language & Literature Teachers, Postsecondary 30 34 1.67 1 1 2 31.13 251125 History Teachers, Postsecondary 54 63 2.08 1 1 2 31.98 251126 Philosophy and Religion Teachers, Postsecondary 83 96 1.96 2 1 3 33.97 251193 Recreation & Fitness Studies Teachers, Postsecondary 45 52 1.94 1 1 2 NA 251194 Vocational Education Teachers, Postsecondary 437 470 0.94 4 8 12 24.00 251199 Postsecondary Teachers, All Other 964 1,045 1.05 10 17 27 29.84 252000 Primary, Secondary, and Special Education Teachers 8,713 9,890 1.69 147 202 349 NA 252011 Preschool Teachers, Except Special Education 1,726 2,027 2.18 38 34 72 11.02 252012 Kindergarten Teachers, Except Special Education 578 654 1.64 10 11 21 27.21 252021 Elementary School Teachers, Except Special Education 2,816 3,207 1.74 49 63 112 28.09 252022 Middle School Teachers, Exc. Special & Voc. Education 1,248 1,417 1.69 21 28 49 27.68 252031 Secondary School Teachers, Exc. Special and Voc. Ed. 1,422 1,539 1.03 15 41 56 29.01 252032 Vocational Education Teachers, Secondary School 175 188 0.93 2 5 7 31.44 252041 Special Education Teachers, Preschool - Elementary 400 464 2.00 8 10 18 NA 252042 Special Education Teachers, Middle School 112 130 2.01 2 3 5 NA 252043 Special Education Teachers, Secondary School 226 253 1.49 3 6 9 36.21 253000 Other Teachers and Instructors 2,786 3,124 1.52 42 42 84 NA 253011 Literacy, Remedial and GED Teachers and Instructors 57 61 0.88 1 1 2 23.28 253021 Self-Enrichment Education Teachers 996 1,153 1.97 20 15 35 16.65 254000 Librarians, Curators, and Archivists 593 623 0.63 4 20 24 NA 254012 Curators 12 14 2.08 0 0 0 14.82 254021 Librarians 357 374 0.60 2 9 11 28.61 254031 Library Technicians 215 225 0.58 1 10 11 13.78 259000 Other Education, Training, and Library Occupations 2,785 3,056 1.22 34 59 93 NA 259021 Farm and Home Management Advisors 54 52 -0.46 0 1 1 24.43 259041 Teacher Assistants 1,881 2,055 1.16 22 39 61 14.18 270000 Arts, Entertainment, Sports, and Media Occupations 7,191 7,974 1.36 102 180 282 NA 271000 Art and Design Workers 1,861 2,091 1.54 30 55 85 NA 271011 Art Directors 67 75 1.49 1 2 3 30.31 271013 Fine Artists, Including Painters, Sculptors, & Illustrators 73 78 0.86 1 2 3 16.13 Source: Florida Agency for Workforce Innovation, Labor Market Statistics Center - September 2010 14
  • 15. FLORIDA JOBS by Occupation* * Because most industries experienced job declines in the economic downturn that began in 2007, some of the occupational job growth projected in this forecast includes the recapturing of jobs lost since that time. NA Duval County 2010 Annual Average Annual Openings Average Occupation Employment Percent Due To Due To Hourly* Code Title 2010 2018 Change Growth Separations Total Wage ($) soc OccTtl cur prj gpct aog aosep aotot wg 271014 Multi-Media Artists and Animators 81 87 0.93 1 2 3 24.17 271021 Commercial and Industrial Designers 84 98 2.08 2 3 5 36.91 271023 Floral Designers 144 150 0.52 1 4 5 13.61 271024 Graphic Designers 978 1,115 1.75 17 30 47 20.32 271025 Interior Designers 186 219 2.22 4 6 10 17.83 271026 Merchandise Displayers and Window Trimmers 115 123 0.87 1 4 5 15.12 272000 Entertainers, Athletes and Related Workers 1,923 2,024 0.66 16 42 58 NA 272012 Producers and Directors 208 212 0.24 1 6 7 27.54 272021 Athletes and Sports Competitors 59 60 0.21 0 1 1 NA 272022 Coaches and Scouts 430 493 1.83 8 8 16 27.73 272042 Musicians and Singers 654 665 0.21 1 13 14 NA 272099 Entertainers, Athletes and Related Workers, All Other 21 22 0.60 0 1 1 25.55 273000 Media and Communications Workers 2,162 2,485 1.87 40 51 91 NA 273011 Radio and Television Announcers 184 186 0.14 0 5 5 36.65 273031 Public Relations Specialists 985 1,183 2.51 25 23 48 26.35 273041 Editors 305 341 1.48 5 8 13 21.51 273042 Technical Writers 78 92 2.24 2 1 3 25.72 273091 Interpreters and Translators 117 136 2.03 2 3 5 20.54 273099 Media and Communications Workers, All Other 41 43 0.61 0 1 1 20.29 274000 Media and Communications Equipment Workers 1,245 1,374 1.30 16 32 48 NA 274012 Broadcast Technicians 167 176 0.67 1 5 6 13.78 274014 Sound Engineering Technicians 42 54 3.57 2 1 3 17.15 274021 Photographers 392 433 1.31 5 8 13 14.64 274031 Camera Operators, Television, Video, and Motion Picture 148 156 0.68 1 4 5 12.94 274032 Film and Video Editors 46 47 0.27 0 1 1 15.96 274099 Media & Communications Equipment Workers, All Other 29 28 -0.43 0 1 1 24.93 290000 Healthcare Practitioners and Technical Occupations 27,348 32,949 2.56 700 528 1,228 NA 291000 Health Diagnosing and Treating Practitioners 17,151 20,723 2.60 447 301 748 NA 291011 Chiropractors 132 150 1.70 2 2 4 NA 291031 Dietitians and Nutritionists 167 183 1.20 2 6 8 22.67 Source: Florida Agency for Workforce Innovation, Labor Market Statistics Center - September 2010 15
  • 16. FLORIDA JOBS by Occupation* * Because most industries experienced job declines in the economic downturn that began in 2007, some of the occupational job growth projected in this forecast includes the recapturing of jobs lost since that time. NA Duval County 2010 Annual Average Annual Openings Average Occupation Employment Percent Due To Due To Hourly* Code Title 2010 2018 Change Growth Separations Total Wage ($) soc OccTtl cur prj gpct aog aosep aotot wg 291041 Optometrists 108 132 2.78 3 4 7 48.78 291051 Pharmacists 1,014 1,221 2.55 26 22 48 50.73 291062 Family and General Practitioners 338 379 1.52 5 6 11 71.26 291064 Obstetricians and Gynecologists 34 40 2.21 1 1 2 112.78 291066 Psychiatrists 18 22 2.78 1 0 1 88.85 291069 Physicians and Surgeons, All Other 956 1,150 2.54 24 17 41 96.61 291071 Physician Assistants 288 396 4.69 14 5 19 44.16 291111 Registered Nurses 10,318 12,582 2.74 283 172 455 29.90 291121 Audiologists 99 128 3.66 4 2 6 29.87 291122 Occupational Therapists 394 479 2.70 11 7 18 34.31 291123 Physical Therapists 595 720 2.63 16 7 23 40.06 291126 Respiratory Therapists 391 473 2.62 10 7 17 23.58 291127 Speech and Language Pathologists 335 398 2.35 8 6 14 36.09 291129 Therapists, All Other 299 326 1.13 3 6 9 27.89 291131 Veterinarians 146 185 3.34 5 3 8 47.80 291199 Health Diagnosing and Treating Practitioners, All Other 407 444 1.14 5 7 12 28.96 292000 Health Technologists and Technicians 9,887 11,890 2.53 250 217 467 NA 292011 Medical and Clinical Laboratory Technologists 675 746 1.31 9 12 21 24.96 292012 Medical and Clinical Laboratory Technicians 313 355 1.68 5 6 11 19.22 292021 Dental Hygienists 586 721 2.88 17 12 29 26.01 292031 Cardiovascular Technologists and Technicians 428 524 2.80 12 6 18 19.76 292032 Diagnostic Medical Sonographers 343 403 2.19 8 5 13 28.49 292033 Nuclear Medicine Technologists 199 241 2.64 5 3 8 32.20 292034 Radiologic Technologists and Technicians 1,022 1,210 2.30 24 14 38 24.10 292051 Dietetic Technicians 21 23 1.19 0 1 1 13.10 292052 Pharmacy Technicians 1,156 1,508 3.81 44 28 72 14.01 292053 Psychiatric Technicians 220 230 0.57 1 5 6 11.60 292054 Respiratory Therapy Technicians 72 74 0.35 0 2 2 21.75 292055 Surgical Technologists 441 553 3.17 14 11 25 18.06 292056 Veterinary Technologists and Technicians 368 467 3.36 12 9 21 13.44 Source: Florida Agency for Workforce Innovation, Labor Market Statistics Center - September 2010 16
  • 17. FLORIDA JOBS by Occupation* * Because most industries experienced job declines in the economic downturn that began in 2007, some of the occupational job growth projected in this forecast includes the recapturing of jobs lost since that time. NA Duval County 2010 Annual Average Annual Openings Average Occupation Employment Percent Due To Due To Hourly* Code Title 2010 2018 Change Growth Separations Total Wage ($) soc OccTtl cur prj gpct aog aosep aotot wg 292061 Licensed Practical and Licensed Vocational Nurses 2,187 2,690 2.87 63 68 131 19.54 292071 Medical Records and Health Information Technicians 649 756 2.06 13 13 26 15.69 292081 Opticians, Dispensing 213 245 1.88 4 4 8 16.54 292091 Orthotists and Prosthetists 41 48 2.13 1 1 2 39.92 292099 Health Technologists and Technicians, All Other 437 526 2.55 11 9 20 17.32 299000 Other Healthcare Practitioners and Technical Occupations 310 336 1.05 3 10 13 NA 299091 Athletic Trainers 55 68 2.95 2 2 4 20.31 299099 Healthcare Practitioners & Technical Workers, All Other 76 83 1.15 1 3 4 22.42 310000 Healthcare Support Occupations 11,879 14,556 2.82 335 128 463 NA 311000 Nursing, Psychiatric, and Home Health Aides 5,971 7,351 2.89 173 57 230 NA 311011 Home Health Aides 1,028 1,477 5.46 56 10 66 10.57 311012 Nursing Aides, Orderlies, and Attendants 4,821 5,749 2.41 116 46 162 11.87 312000 Occupational and Physical Therapist Assistants & Aides 295 361 2.80 8 4 12 NA 312011 Occupational Therapist Assistants 58 73 3.23 2 1 3 29.74 312021 Physical Therapist Assistants 166 209 3.24 5 2 7 29.10 312022 Physical Therapist Aides 61 69 1.64 1 1 2 11.93 319000 Other Healthcare Support Occupations 5,613 6,844 2.74 154 68 222 NA 319011 Massage Therapists 233 248 0.80 2 3 5 21.11 319091 Dental Assistants 914 1,116 2.76 25 17 42 15.60 319092 Medical Assistants 2,867 3,680 3.54 102 31 133 13.98 319093 Medical Equipment Preparers 461 531 1.90 9 5 14 11.84 319094 Medical Transcriptionists 362 407 1.55 6 4 10 15.99 319095 Pharmacy Aides 168 164 -0.30 0 2 2 9.56 319096 Veterinary Assistants and Laboratory Animal Caretakers 170 198 2.06 4 2 6 10.67 319099 Healthcare Support Workers, All Other 438 500 1.77 8 5 13 15.17 330000 Protective Service Occupations 11,800 12,425 0.66 81 328 409 NA 331000 First-Line Supervisors, Protective Service Workers 508 506 -0.05 1 21 22 NA 331011 First-Line Supervisors of Correctional Officers 91 90 -0.14 0 3 3 NA 331012 First-Line Supervisors of Police and Detectives 251 243 -0.40 0 11 11 37.54 331021 First-Line Superv. of Fire Fighting and Prevention Workers 73 73 0.00 0 4 4 37.00 Source: Florida Agency for Workforce Innovation, Labor Market Statistics Center - September 2010 17
  • 18. FLORIDA JOBS by Occupation* * Because most industries experienced job declines in the economic downturn that began in 2007, some of the occupational job growth projected in this forecast includes the recapturing of jobs lost since that time. NA Duval County 2010 Annual Average Annual Openings Average Occupation Employment Percent Due To Due To Hourly* Code Title 2010 2018 Change Growth Separations Total Wage ($) soc OccTtl cur prj gpct aog aosep aotot wg 331099 First-Line Superv., Protective Service Workers, All Other 93 100 0.94 1 3 4 22.85 332000 Fire Fighting and Prevention Workers 1,271 1,355 0.83 11 38 49 NA 332011 Fire Fighters 1,205 1,289 0.87 11 36 47 22.88 332021 Fire Inspectors and Investigators 66 66 0.00 0 2 2 24.99 333000 Law Enforcement Workers 3,323 3,314 -0.03 1 78 79 NA 333011 Bailiffs 51 51 0.00 0 1 1 18.22 333012 Correctional Officers and Jailers 861 865 0.06 1 19 20 18.70 333021 Detectives and Criminal Investigators 479 483 0.10 1 9 10 31.69 333031 Fish and Game Wardens 15 14 -0.83 0 0 0 17.69 333041 Parking Enforcement Workers 12 11 -1.04 0 0 0 NA 333051 Police and Sheriff's Patrol Officers 1,874 1,862 -0.08 0 47 47 25.26 333052 Transit and Railroad Police 31 28 -1.21 0 1 1 NA 339000 Other Protective Service Workers 6,698 7,250 1.03 69 191 260 NA 339011 Animal Control Workers 51 52 0.25 0 2 2 14.10 339021 Private Detectives and Investigators 406 448 1.29 5 8 13 12.82 339032 Security Guards 5,063 5,380 0.78 40 104 144 10.56 339091 Crossing Guards 271 272 0.05 0 8 8 10.32 350000 Food Preparation and Serving Related Occupations 34,848 37,985 1.13 392 1,325 1,717 NA 351000 Supervisors, Food Preparation and Serving Workers 2,280 2,468 1.03 24 21 45 NA 351011 Chefs and Head Cooks 167 169 0.15 0 2 2 23.93 351012 First-Line Superv. of Food Preparation & Serving Workers 2,113 2,299 1.10 23 19 42 15.98 352000 Cooks and Food Preparation Workers 8,670 9,302 0.91 79 263 342 NA 352011 Cooks, Fast Food 1,369 1,550 1.65 23 36 59 8.39 352014 Cooks, Restaurant 3,337 3,495 0.59 20 88 108 11.03 352021 Food Preparation Workers 3,008 3,171 0.68 20 114 134 9.21 353000 Food and Beverage Serving Workers 19,105 21,165 1.35 258 778 1,036 NA 353011 Bartenders 1,306 1,376 0.67 9 46 55 9.63 353021 Food Preparation & Serving Workers, Including Fast Food 7,841 9,299 2.32 182 159 341 8.45 353022 Counter Attendants, Cafeteria, and Coffee Shop 1,349 1,501 1.41 19 115 134 8.60 353031 Waiters and Waitresses 8,011 8,312 0.47 38 449 487 9.84 Source: Florida Agency for Workforce Innovation, Labor Market Statistics Center - September 2010 18
  • 19. FLORIDA JOBS by Occupation* * Because most industries experienced job declines in the economic downturn that began in 2007, some of the occupational job growth projected in this forecast includes the recapturing of jobs lost since that time. NA Duval County 2010 Annual Average Annual Openings Average Occupation Employment Percent Due To Due To Hourly* Code Title 2010 2018 Change Growth Separations Total Wage ($) soc OccTtl cur prj gpct aog aosep aotot wg 353041 Food Servers, Nonrestaurant 598 677 1.65 10 11 21 10.05 359000 Other Food Preparation and Serving Related Workers 4,793 5,050 0.67 32 263 295 NA 359011 Dining Room & Cafeteria Attendants & Bartender Helpers 1,062 1,140 0.92 10 50 60 8.66 359021 Dishwashers 2,052 2,199 0.90 18 93 111 8.50 359031 Hosts, Restaurant, Lounge, and Coffee Shop 1,108 1,133 0.28 3 87 90 8.95 370000 Building & Grounds Cleaning & Maintenance Occupations 15,916 17,320 1.10 176 263 439 NA 371000 Superv., Building & Grounds Cleaning & Maintenance 1,182 1,313 1.39 16 12 28 NA 371011 First-Line Superv. of Housekeeping & Janitorial Workers 354 376 0.78 3 3 6 17.42 372000 Building Cleaning and Pest Control Workers 10,179 10,718 0.66 67 198 265 NA 372021 Pest Control Workers 716 797 1.41 10 25 35 13.21 373000 Grounds Maintenance Workers 4,555 5,289 2.01 92 54 146 NA 373011 Landscaping and Groundskeeping Workers 3,872 4,462 1.90 74 46 120 11.46 373019 Grounds Maintenance Workers, All Other 134 182 4.48 6 2 8 14.24 390000 Personal Care and Service Occupations 13,913 15,551 1.47 207 375 582 NA 392000 Animal Care and Service Workers 455 533 2.14 10 10 20 NA 393000 Entertainment Attendants and Related Workers 1,836 2,107 1.85 34 115 149 NA 393031 Ushers, Lobby Attendants, and Ticket Takers 869 1,020 2.17 19 61 80 8.43 393091 Amusement and Recreation Attendants 718 814 1.67 12 41 53 8.63 393093 Locker Room, Coatroom, and Dressing Room Attendants 48 52 1.04 1 3 4 10.68 394000 Funeral Service Workers 177 213 2.54 5 8 13 NA 394021 Funeral Attendants 155 189 2.74 4 7 11 9.17 395000 Personal Appearance Workers 2,186 2,242 0.32 8 31 39 NA 395012 Hairdressers, Hairstylists, and Cosmetologists 1,590 1,633 0.34 5 23 28 15.07 395092 Manicurists and Pedicurists 262 264 0.10 0 4 4 11.40 395094 Skin Care Specialists 126 145 1.88 2 2 4 18.80 396000 Transportation, Tourism, and Lodging Attendants 435 464 0.83 4 12 16 NA 396011 Baggage Porters and Bellhops 172 190 1.31 2 4 6 9.37 396012 Concierges 57 65 1.75 1 2 3 12.13 396021 Tour Guides and Escorts 95 97 0.26 0 4 4 10.49 399000 Other Personal Care and Service Workers 8,187 9,278 1.67 136 182 318 NA Source: Florida Agency for Workforce Innovation, Labor Market Statistics Center - September 2010 19