SlideShare uma empresa Scribd logo
1 de 1
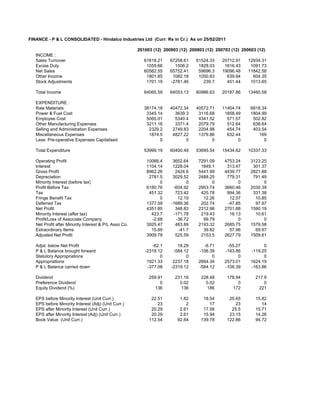
FINANCE - P & L CONSOLIDATED - Hindalco Industries Ltd (Curr: Rs in Cr.) As on 25/02/2011
COMPANY/FINANCE/PROFIT AND LOSS CONSOLIDATED/252/Hindalco Inds.¤CmbDetail»0¤CmbCommonsize»0¤CmbAnnual»0
                                               201003 (12) 200903 (12) 200803 (12) 200703 (12) 200603 (12)
   INCOME :
   Sales Turnover                                 61618.21     67258.61    61524.33     20712.91  12934.31
   Excise Duty                                     1055.66       1506.2      1828.03     1616.43   1091.73
   Net Sales                                      60562.55     65752.41      59696.3    19096.48  11842.58
   Other Income                                    1801.85      1082.18      1050.63      639.94    604.35
   Stock Adjustments                               1701.19     -2781.46        239.7      451.44   1013.65

  Total Income                                        64065.59   64053.13   60986.63   20187.86   13460.58

  EXPENDITURE :
  Raw Materials                                       38174.18   40472.34   40572.71   11404.74    6818.34
  Power & Fuel Cost                                    3345.14     3639.3    3116.68    1858.49    1804.99
  Employee Cost                                        5065.01     5340.4    4341.52     571.57     502.82
  Other Manufacturing Expenses                         3211.16     3371.4    2079.79     512.64     638.64
  Selling and Administration Expenses                   2329.2    2749.83    2204.98     454.74     403.54
  Miscellaneous Expenses                                1874.5    4827.22    1379.86     632.44       169
  Less: Pre-operative Expenses Capitalised                   0          0          0          0          0

  Total Expenditure                                   53999.19   60400.49   53695.54   15434.62   10337.33

  Operating Profit                                     10066.4    3652.64    7291.09    4753.24    3123.25
  Interest                                             1104.14    1228.04     1849.1     313.47     301.37
  Gross Profit                                         8962.26     2424.6    5441.99    4439.77    2821.88
  Depreciation                                          2781.5    3029.52    2488.25     779.31     791.49
  Minority Interest (before tax)                             0          0          0          0          0
  Profit Before Tax                                    6180.76    -604.92    2953.74    3660.46    2030.39
  Tax                                                   451.32     723.42     425.78     994.36     331.38
  Fringe Benefit Tax                                         0      12.19      12.26      12.07      10.85
  Deferred Tax                                         1377.59   -1689.36     202.74     -47.85      97.97
  Net Profit                                           4351.85     348.83    2312.96    2701.88    1590.19
  Minority Interest (after tax)                          423.7    -171.78     219.43      16.13      10.61
  Profit/Loss of Associate Company                       -2.68     -36.72      99.79          0          0
  Net Profit after Minority Interest & P/L Asso.Co.    3925.47     483.89    2193.32    2685.75    1579.58
  Extraordinary Items                                    15.69      -41.7      39.82      57.96      69.97
  Adjusted Net Profit                                  3909.78     525.59     2153.5    2627.79    1509.61

  Adjst. below Net Profit                                -62.1      18.29      -6.71     -55.27          0
  P & L Balance brought forward                       -2319.12    -584.12    -106.39    -163.86    -119.25
  Statutory Appropriations                                   0          0          0          0          0
  Appropriations                                       1921.33    2237.18    2664.34    2573.01    1624.19
  P & L Balance carried down                           -377.08   -2319.12    -584.12    -106.39    -163.86

  Dividend                                              259.91     231.16     228.48     178.94      217.9
  Preference Dividend                                        0       0.02       0.02          0          0
  Equity Dividend (%)                                     136        136        186         172       221

  EPS before Minority Interest (Unit Curr.)              22.51       1.82      18.54      25.65      15.82
  EPS before Minority Interest (Adj) (Unit Curr.)           23          2         17         23         14
  EPS after Minority Interest (Unit Curr.)               20.29       2.61      17.56       25.5      15.71
  EPS after Minority Interest (Adj) (Unit Curr.)         20.29       2.61      15.94      23.15      14.26
  Book Value (Unit Curr.)                               112.54      92.64     139.78     122.86      94.72
Mais conteúdo relacionado

Destaque (9)

Golf
GolfGolf
Golf
 
1.3 outline
1.3 outline1.3 outline
1.3 outline
 
приказ об ус
приказ об усприказ об ус
приказ об ус
 
ベジタブルアートコレクション ポスターA
ベジタブルアートコレクション ポスターAベジタブルアートコレクション ポスターA
ベジタブルアートコレクション ポスターA
 
Diversified Asset
Diversified AssetDiversified Asset
Diversified Asset
 
Keys
KeysKeys
Keys
 
GRAFICAS
GRAFICASGRAFICAS
GRAFICAS
 
Andrew skippresume
Andrew skippresumeAndrew skippresume
Andrew skippresume
 
1
11
1
 

Mais de Santosh Sridharan (10)

Copy of chapter 4
Copy of chapter 4Copy of chapter 4
Copy of chapter 4
 
Chapter 4
Chapter 4Chapter 4
Chapter 4
 
Capita template2
Capita template2Capita template2
Capita template2
 
Book2
Book2Book2
Book2
 
Balance sheet
Balance sheetBalance sheet
Balance sheet
 
Personality traits
Personality traitsPersonality traits
Personality traits
 
Mpsa200410
Mpsa200410Mpsa200410
Mpsa200410
 
K
KK
K
 
Hul balance sheet
Hul balance sheetHul balance sheet
Hul balance sheet
 
Fiscal policy in_india_wp
Fiscal policy in_india_wpFiscal policy in_india_wp
Fiscal policy in_india_wp
 

Último

Why Teams call analytics are critical to your entire business
Why Teams call analytics are critical to your entire businessWhy Teams call analytics are critical to your entire business
Why Teams call analytics are critical to your entire business
panagenda
 
Finding Java's Hidden Performance Traps @ DevoxxUK 2024
Finding Java's Hidden Performance Traps @ DevoxxUK 2024Finding Java's Hidden Performance Traps @ DevoxxUK 2024
Finding Java's Hidden Performance Traps @ DevoxxUK 2024
Victor Rentea
 

Último (20)

Rising Above_ Dubai Floods and the Fortitude of Dubai International Airport.pdf
Rising Above_ Dubai Floods and the Fortitude of Dubai International Airport.pdfRising Above_ Dubai Floods and the Fortitude of Dubai International Airport.pdf
Rising Above_ Dubai Floods and the Fortitude of Dubai International Airport.pdf
 
ICT role in 21st century education and its challenges
ICT role in 21st century education and its challengesICT role in 21st century education and its challenges
ICT role in 21st century education and its challenges
 
FWD Group - Insurer Innovation Award 2024
FWD Group - Insurer Innovation Award 2024FWD Group - Insurer Innovation Award 2024
FWD Group - Insurer Innovation Award 2024
 
Why Teams call analytics are critical to your entire business
Why Teams call analytics are critical to your entire businessWhy Teams call analytics are critical to your entire business
Why Teams call analytics are critical to your entire business
 
Finding Java's Hidden Performance Traps @ DevoxxUK 2024
Finding Java's Hidden Performance Traps @ DevoxxUK 2024Finding Java's Hidden Performance Traps @ DevoxxUK 2024
Finding Java's Hidden Performance Traps @ DevoxxUK 2024
 
MINDCTI Revenue Release Quarter One 2024
MINDCTI Revenue Release Quarter One 2024MINDCTI Revenue Release Quarter One 2024
MINDCTI Revenue Release Quarter One 2024
 
Apidays New York 2024 - APIs in 2030: The Risk of Technological Sleepwalk by ...
Apidays New York 2024 - APIs in 2030: The Risk of Technological Sleepwalk by ...Apidays New York 2024 - APIs in 2030: The Risk of Technological Sleepwalk by ...
Apidays New York 2024 - APIs in 2030: The Risk of Technological Sleepwalk by ...
 
Strategies for Landing an Oracle DBA Job as a Fresher
Strategies for Landing an Oracle DBA Job as a FresherStrategies for Landing an Oracle DBA Job as a Fresher
Strategies for Landing an Oracle DBA Job as a Fresher
 
Ransomware_Q4_2023. The report. [EN].pdf
Ransomware_Q4_2023. The report. [EN].pdfRansomware_Q4_2023. The report. [EN].pdf
Ransomware_Q4_2023. The report. [EN].pdf
 
Apidays New York 2024 - Passkeys: Developing APIs to enable passwordless auth...
Apidays New York 2024 - Passkeys: Developing APIs to enable passwordless auth...Apidays New York 2024 - Passkeys: Developing APIs to enable passwordless auth...
Apidays New York 2024 - Passkeys: Developing APIs to enable passwordless auth...
 
How to Troubleshoot Apps for the Modern Connected Worker
How to Troubleshoot Apps for the Modern Connected WorkerHow to Troubleshoot Apps for the Modern Connected Worker
How to Troubleshoot Apps for the Modern Connected Worker
 
2024: Domino Containers - The Next Step. News from the Domino Container commu...
2024: Domino Containers - The Next Step. News from the Domino Container commu...2024: Domino Containers - The Next Step. News from the Domino Container commu...
2024: Domino Containers - The Next Step. News from the Domino Container commu...
 
AWS Community Day CPH - Three problems of Terraform
AWS Community Day CPH - Three problems of TerraformAWS Community Day CPH - Three problems of Terraform
AWS Community Day CPH - Three problems of Terraform
 
Exploring the Future Potential of AI-Enabled Smartphone Processors
Exploring the Future Potential of AI-Enabled Smartphone ProcessorsExploring the Future Potential of AI-Enabled Smartphone Processors
Exploring the Future Potential of AI-Enabled Smartphone Processors
 
Apidays New York 2024 - The value of a flexible API Management solution for O...
Apidays New York 2024 - The value of a flexible API Management solution for O...Apidays New York 2024 - The value of a flexible API Management solution for O...
Apidays New York 2024 - The value of a flexible API Management solution for O...
 
EMPOWERMENT TECHNOLOGY GRADE 11 QUARTER 2 REVIEWER
EMPOWERMENT TECHNOLOGY GRADE 11 QUARTER 2 REVIEWEREMPOWERMENT TECHNOLOGY GRADE 11 QUARTER 2 REVIEWER
EMPOWERMENT TECHNOLOGY GRADE 11 QUARTER 2 REVIEWER
 
Emergent Methods: Multi-lingual narrative tracking in the news - real-time ex...
Emergent Methods: Multi-lingual narrative tracking in the news - real-time ex...Emergent Methods: Multi-lingual narrative tracking in the news - real-time ex...
Emergent Methods: Multi-lingual narrative tracking in the news - real-time ex...
 
Spring Boot vs Quarkus the ultimate battle - DevoxxUK
Spring Boot vs Quarkus the ultimate battle - DevoxxUKSpring Boot vs Quarkus the ultimate battle - DevoxxUK
Spring Boot vs Quarkus the ultimate battle - DevoxxUK
 
Corporate and higher education May webinar.pptx
Corporate and higher education May webinar.pptxCorporate and higher education May webinar.pptx
Corporate and higher education May webinar.pptx
 
ProductAnonymous-April2024-WinProductDiscovery-MelissaKlemke
ProductAnonymous-April2024-WinProductDiscovery-MelissaKlemkeProductAnonymous-April2024-WinProductDiscovery-MelissaKlemke
ProductAnonymous-April2024-WinProductDiscovery-MelissaKlemke
 

Capita template3

  • 1. FINANCE - P & L CONSOLIDATED - Hindalco Industries Ltd (Curr: Rs in Cr.) As on 25/02/2011 COMPANY/FINANCE/PROFIT AND LOSS CONSOLIDATED/252/Hindalco Inds.¤CmbDetail»0¤CmbCommonsize»0¤CmbAnnual»0 201003 (12) 200903 (12) 200803 (12) 200703 (12) 200603 (12) INCOME : Sales Turnover 61618.21 67258.61 61524.33 20712.91 12934.31 Excise Duty 1055.66 1506.2 1828.03 1616.43 1091.73 Net Sales 60562.55 65752.41 59696.3 19096.48 11842.58 Other Income 1801.85 1082.18 1050.63 639.94 604.35 Stock Adjustments 1701.19 -2781.46 239.7 451.44 1013.65 Total Income 64065.59 64053.13 60986.63 20187.86 13460.58 EXPENDITURE : Raw Materials 38174.18 40472.34 40572.71 11404.74 6818.34 Power & Fuel Cost 3345.14 3639.3 3116.68 1858.49 1804.99 Employee Cost 5065.01 5340.4 4341.52 571.57 502.82 Other Manufacturing Expenses 3211.16 3371.4 2079.79 512.64 638.64 Selling and Administration Expenses 2329.2 2749.83 2204.98 454.74 403.54 Miscellaneous Expenses 1874.5 4827.22 1379.86 632.44 169 Less: Pre-operative Expenses Capitalised 0 0 0 0 0 Total Expenditure 53999.19 60400.49 53695.54 15434.62 10337.33 Operating Profit 10066.4 3652.64 7291.09 4753.24 3123.25 Interest 1104.14 1228.04 1849.1 313.47 301.37 Gross Profit 8962.26 2424.6 5441.99 4439.77 2821.88 Depreciation 2781.5 3029.52 2488.25 779.31 791.49 Minority Interest (before tax) 0 0 0 0 0 Profit Before Tax 6180.76 -604.92 2953.74 3660.46 2030.39 Tax 451.32 723.42 425.78 994.36 331.38 Fringe Benefit Tax 0 12.19 12.26 12.07 10.85 Deferred Tax 1377.59 -1689.36 202.74 -47.85 97.97 Net Profit 4351.85 348.83 2312.96 2701.88 1590.19 Minority Interest (after tax) 423.7 -171.78 219.43 16.13 10.61 Profit/Loss of Associate Company -2.68 -36.72 99.79 0 0 Net Profit after Minority Interest & P/L Asso.Co. 3925.47 483.89 2193.32 2685.75 1579.58 Extraordinary Items 15.69 -41.7 39.82 57.96 69.97 Adjusted Net Profit 3909.78 525.59 2153.5 2627.79 1509.61 Adjst. below Net Profit -62.1 18.29 -6.71 -55.27 0 P & L Balance brought forward -2319.12 -584.12 -106.39 -163.86 -119.25 Statutory Appropriations 0 0 0 0 0 Appropriations 1921.33 2237.18 2664.34 2573.01 1624.19 P & L Balance carried down -377.08 -2319.12 -584.12 -106.39 -163.86 Dividend 259.91 231.16 228.48 178.94 217.9 Preference Dividend 0 0.02 0.02 0 0 Equity Dividend (%) 136 136 186 172 221 EPS before Minority Interest (Unit Curr.) 22.51 1.82 18.54 25.65 15.82 EPS before Minority Interest (Adj) (Unit Curr.) 23 2 17 23 14 EPS after Minority Interest (Unit Curr.) 20.29 2.61 17.56 25.5 15.71 EPS after Minority Interest (Adj) (Unit Curr.) 20.29 2.61 15.94 23.15 14.26 Book Value (Unit Curr.) 112.54 92.64 139.78 122.86 94.72