SlideShare uma empresa Scribd logo
1 de 32
Baixar para ler offline
Consolidated Summary Financials Worst-Case Mid-Case
Revenue 9375 12500
Cost of Goods Sold 2030 2030
Gross Profit 7345 10470
Payroll 7200 7406
Marketing 86 86
Facilities 586 586
SG&A 1887 1887
Total Expenses 9759 9965
EBITDA -2414 505
Non-Operating
Taxes
Net Interest 523 523
Depreciation/Amortzation 233 233
Other 71 71
Total Non-Operating 827 827
Net Income (Loss) -3241 -322
COGS:
$2030
Payroll: $7406
Marketing: $86
Facilities: $586
S G& A
$1887
EBIDA: $505
Dollar Distribution
New Business January February March April May June July AugustSeptemberOctoberNovemberDecemberFull Year
Pipe Line
1 Year -
3 Year
3 Months
New Business - Projection
1 Year 150 210 240 210 240 450 285 240 450 312 375 810 3973
3 Year 75 105 120 105 120 225 143 120 225 312 375 375 2300
3 Months 275 385 440 385 440 825 523 440 825 625 750 1315 7227
500 700 800 700 800 1500 950 800 1500 1250 1500 2500 13500
Total
1 Year 150 210 240 210 240 450 285 240 450 312 375 810 3973
3 Year 75 105 120 105 120 225 143 120 225 312 375 375 2300
3 Months 275 385 440 385 440 825 523 440 825 625 750 1315 7227
500 700 800 700 800 1500 950 800 1500 1250 1500 2500 13500
Budgets were based on quartely estimate, to arrive at monthly number each quarter was divided
into months to match with quarterly numbers.
New Business - Revenue January February March April May June July August September October November December Full Year
13 13 13 13 13 13 13 13 13 13 13 13 150
18 18 18 18 18 18 18 18 18 18 18 193
20 20 20 20 20 20 20 20 20 20 200
18 18 18 18 18 18 18 18 18 158
20 20 20 20 20 20 20 20 160
37 37 37 37 37 37 37 262
24 24 24 24 24 24 143
20 20 20 20 20 100
38 38 38 38 150
26 26 26 78
31 31 63
68 68
2 2 2 2 2 2 2 2 2 2 2 2 25
3 3 3 3 3 3 3 3 3 3 3 32
3 3 3 3 3 3 3 3 3 3 33
3 3 6 4 3 6 9 10 10 56
3 6 4 3 6 9 10 10 53
6 4 3 6 9 10 10 49
4 3 6 9 10 10 43
3 6 9 10 10 39
6 9 10 10 36
9 10 10 30
10 10 21
10 10
92 92 92 275
128 128 128 385
147 147 147 440
128 128 128 385
147 147 147 440
275 275 275 825
174 174 174 523
147 147 147 440
275 275 275 825
208 208 208 625
250 250 500
438 438
15 35 58 79 102 152 173 194 252 301 355 433 2150
92 220 367 403 422 550 596 596 596 630 733 897 6101
106 255 425 482 524 702 769 790 848 931 1089 1330 8250
Backlog Revenue January February March April May June July August September October November December Full Year
Total Retail Jobs
Software
iPlan 121 121 121 100 100 100 100 100 86 86 86 86 1206
iLeader 14 14 14 14 14 14 14 14 11 11 11 11 161
iMarket 150 140 133 133 133 133 133 133 133 92 89 82 1487
Other 10 4 14
Total Software Revenue 295 275 269 248 248 248 252 248 231 189 186 179 2868
Data
R&D Cube
iBlkship 478 140 163 780
iAccess 96 96
iOpinion 226 164 391
iField
Other 115 115
Total Data Revenue 478 481 164 259 1382
Total Backlog Revenue 773 756 433 248 248 507 252 248 231 189 186 179 4250
TOTAL REVENUE 879 1011 858 730 772 1209 1020 1037 1078 1120 1275 1509 12500
Budget Yr 2013 New Business - Product 9/18/2013
PAYROLL Location Current $ Pay Budget Adj Budgeted Annual Pay January February March April May June July August September October November December Total
Administration
Adm1 US 200 7 207 17 17 17 17 17 17 17 17 17 17 17 17 207
Adm2 US 60 60 5 5 5 5 5 5 30
Recruit #1 US 175 175 15 15 15 15 15 15 15 102
Recruit #2 US 80 80 7 7 7 7 7 7 7 7 7 60
Recruit #3 US 65 65 5 5 5 5 5 5 5 38
Adm3 US 140 140 12 12 12 12 12 12 12 12 12 12 12 12 140
Adm4 US 100 10 110 9 9 9 9 9 9 9 9 9 9 9 9 110
Adm5 US 38 1 39 3 3 3 3 3 3 3 3 3 3 3 3 39
Adm6 US 12 12 1 1 1 1 1 1 1 1 1 1 1 1 12
Adm7 UKR 9 9 1 1 1 1 1 1 1 1 1 1 1 1 9
Adm8 UKR 18 18 2 2 2 2 2 2 2 2 2 2 2 2 18
Adm9 GM 200 200 17 17 17 17 17 17 17 17 17 17 17 17 200
Adm10 GM 95 95 8 8 8 8 8 8 48
Adm11 GM 19 19 2 2 2 2 2 2 9
Adm12 GM 12 12 1 1 2
Adm13 GM 59 3 62 5 5 5 5 5 5 5 5 5 5 5 5 62
Adm14 GM 23 3 26 2 2 2 2 2 2 13
Adm15 GM 49 3 52 4 4 4 4 4 4 26
Adm16 GM 6 6 1 1 1 1 1 1 3
Total Administration 1360 27 1388 89 89 88 95 95 115 93 93 93 93 93 93 1128
# of Employees 16 16 15 16 16 18 12 12 12 12 12 12
Marketing
Market1 US 180 180 15 15 15 15 8 68
Market2 US 130 10 140 11 11 22
Market3 US 77 77 6 6 13
Recruit #1 US N/A 150 13 13 13 13 13 13 13 88
Recruit #2 US N/A 130 11 11 11 11 11 11 11 11 11 11 108
Market4 GM 29 29 2 2 2 2 2 2 15
Market5 GM 65 65 5 5 5 5 5 5 5 38
Total Marketing 481 10 771 40 40 34 34 26 31 29 23 23 23 23 23 350
# of Employees 5 5 4 4 4 4 3 3 3 3 3 3
Sales - US
Sales 1 US 220 220 18 18 18 18 18 18 18 18 18 18 18 18 220
Recruit - Sales Support #2 US April 120 10 10 10 10 10 10 10 10 10 90
Sales 2 US 195 195 16 16 16 16 16 16 16 16 16 16 16 16 195
Recruit - Team #1 US N/A March15 200 8 17 17 17 17 17 17 17 17 17 158
Sales 3 US 110 10 120 10 10 10 10 10 10 10 10 10 10 10 10 120
Recruit - Team #1 US N/A April 120 10 10 10 10 10 10 10 10 10 90
Recruit - Team #1 US N/A June 100 8 8 8 8 8 8 50
Sales 4 US 150 15 165 14 14 14 14 14 14 14 14 14 14 14 14 165
Sales 5 US 120 120 10 10
Recruit - Team #2 US N/A April 150 13 13 13 13 13 13 13 13 13 113
Recruit - Team #2 US N/A June 100 8 8 8 8 8 8 50
Sales 6 US March 120 10 10 10 10 10 10 10 10 10 10 100
Sales 7 US 70 70 6 6 6 6 6 6 6 6 6 6 6 6 70
Total Sales - US 865 25 1800 74 64 83 123 123 123 140 140 140 140 140 140 1431
# of Employees 6 5 7 10 10 10 12 12 12 12 12 12
Sales - EU
Sales 8 EU 130 70 200 17 17 17 17 17 17 17 17 17 17 17 17 200
Sales 9 EU 215 215 9 9 18 18 18 18 18 18 18 18 18 18 197
Recruit - Team #2 EU June 120 10 10 10 10 10 10 10 70
Sales 10 GM 130 130 11 11 11 11 11 11 11 11 11 11 11 11 130
Sales 11 GM 110 110 9 9 9 9 9 9 9 9 9 9 9 9 110
Sales 12 GM 115 115 10 10 10 10 10 10 57
Sales 13 GM 129 129 11 11 11 11 11 11 11 11 11 11 11 11 129
Sales 14 GM 101 101 8 8 8 8 8 8 8 8 8 8 8 8 101
Sales 15 GM 99 99 8 8 8 8 8 8 8 8 8 8 8 8 99
Sales 16 GM 70 14 85 7 7 7 7 7 7 7 7 7 7 7 7 85
Sales 17 BD/UK 65 65 5 5 5 5 5 5 5 5 43
Total Sales - EU 1164 84 1368 95 95 104 104 104 114 104 104 99 99 99 99 1221
# of Employees 10 10 10 10 10 11 10 10 9 9 9 9
Total Sales 2029 109 3168 169 159 187 227 227 237 244 244 239 239 239 239 2652
# of Employees 16 15 17 20 20 21 22 22 21 21 21 21
Client Operations - US
ClientOps 1 US 120 5 125 10 10 10 10 10 10 10 10 10 10 10 10 125
ClientOps 2 US 85 3 88 7 7 7 7 7 7 7 7 7 7 7 7 88
ClientOps 3 US 85 4 89 7 7 7 7 7 7 7 7 7 7 7 7 89
ClientOps 4 US 48 48 4 4 4 4 4 4 4 4 4 4 4 4 48
ClientOps 5 US 77 77 6 6 6 6 6 6 6 6 6 6 64
ClientOps 6 US 106 106 9 9 9 9 9 9 9 9 9 9 9 9 106
ClientOps 7 US 55 55 5 5 5 5 5 5 5 5 5 5 5 5 55
Recruit #1 US 45 45 4 4 4 4 4 4 4 4 4 34
Total Client Operations - US 621 11 632 43 43 49 53 53 53 53 53 53 53 53 53 608
# of Employees 6 6 7 8 8 8 8 8 8 8 8 8
Client Operations - EU
ClientOps 8 GM 94 17 111 9 9 9 9 9 9 9 9 9 9 9 9 111
ClientOps 9 UKR 12 12 1 1 1 1 1 1 1 1 1 1 1 1 12
ClientOps 10 GM 56 2 58 5 5 5 5 5 5 5 5 5 5 5 5 58
ClientOps 10 UKR 31 31 3 3 3 3 3 3 3 3 3 3 3 3 31
ClientOps 11 GM 70 70 6 6 6 6 6 6 6 6 6 6 6 6 70
ClientOps 12 GM 78 78 7 7 7 7 7 7 7 7 7 7 7 72
ClientOps 13 GM 78 78 7 7 7 7 7 7 7 7 7 7 7 7 78
Recruit #1 GM 85 85 7 7 7 7 7 7 7 7 57
Recruit #2 GM 85 85 7 7 7 7 7 7 43
Total Client Operations - EU 588 19 607 30 36 36 36 44 44 51 51 51 51 51 51 530
# of Employees 6 7 7 7 8 8 9 9 9 9 9 9
Total Client Operations 1209 30 1239 72 79 85 89 96 96 103 103 103 103 103 103 1138
# of Employees 12 13 14 15 16 16 17 17 17 17 17 17
Technology
Technology 1 UKR 16 16 1 1 1 1 1 1 1 1 1 1 1 1 16
Technology 2 UKR 13 13 1 1 1 1 1 1 1 1 1 1 1 1 13
Technology 3 UKR 18 18 2 2 2 2 2 2 2 2 2 2 2 2 18
Technology 4 UKR 16 16 1 1 1 1 1 1 1 1 1 1 1 1 16
Technology 5 UKR 16 16 1 1 1 1 1 1 1 1 1 1 1 1 16
Technology 6 US 20 20 2 2 2 2 2 2 2 2 2 2 2 2 20
Technology 7 UKR 17 17 1 1 1 1 1 1 1 1 1 1 1 1 17
Technology 8 UKR 38 38 3 3 3 3 3 3 3 3 3 3 3 3 38
Technology 9 UKR 38 38 3 3 3 3 3 3 3 3 3 3 3 3 38
Technology 10 UKR 17 17 1 1 1 1 1 1 1 1 1 1 1 1 17
Technology 11 UKR 12 12 1 1 1 1 1 1 1 1 1 1 1 1 12
Technology 12 UKR 20 20 2 2 2 2 2 2 2 2 2 2 2 2 20
Technology 13 UKR 24 24 2 2 2 2 2 2 2 2 2 2 2 2 24
Technology 14 UKR 13 13 1 1 1 1 1 1 1 1 1 1 1 1 13
Technology 15 UKR 28 28 2 2 2 2 2 2 2 2 2 2 2 2 28
Technology 16 UKR 48 48 4 4 4 4 4 4 4 4 4 4 4 4 48
Technology 17 UKR 24 24 2 2 2 2 2 2 2 2 2 2 2 2 24
Technology 18 UKR 24 24 2 2 2 2 2 2 2 2 2 2 2 2 24
Technology 19 UKR 19 19 2 2 2 2 2 2 2 2 2 2 2 2 19
Technology 20 UKR 17 17 1 1 1 1 1 1 1 1 1 1 1 1 17
Technology 21 UKR 24 24 2 2 2 2 2 2 2 2 2 2 2 2 24
Technology 22 UKR 10 10 1 1 1 1 1 1 1 1 1 1 1 1 10
Technology 23 UKR 12 12 1 1 1 1 1 1 1 1 1 1 1 1 12
Technology 24 UKR 20 20 2 2 2 2 2 2 2 2 2 2 2 2 20
Technology 25 UKR 6 6 1 1 1 1 1 1 1 1 1 1 1 1 6
Technology 26 UKR 11 11 1 1 1 1 1 1 1 1 1 1 1 1 11
Technology 27 GM 91 26 117 10 10 10 10 10 10 10 10 10 10 10 10 117
Technology 28 GM 87 87 7 7 7 7 7 7 44
Technology 29 GM 71 71 6 6 6 6 6 6 6 6 6 6 6 6 71
Technology 30 GM 70 9 79 7 7 7 7 7 7 7 7 7 7 7 7 79
Technology 31 GM 65 3 68 6 6 6 6 6 6 6 6 6 6 6 6 68
Technology 32 GM 53 53 4 4 4 4 4 4 27
Technology 33 GM 34 34 3 3 3 3 3 3 3 3 3 3 3 3 34
Technology 34 US 130 10 140 12 12 12 12 12 12 12 12 12 12 117
Recruit #1 UKR 26 26 2 2 2 2 2 2 2 2 2 2 2 2 26
Recruit #2 UKR 50 50 4 4 4 4 4 4 4 29
Recruit #3 UKR 24 24 2 2 2 2 2 2 2 14
Recruit #4 UKR 40 40 3 3 3 3 3 3 3 23
Total Technology 1263 48 1311 88 88 100 100 100 109 98 98 98 98 98 98 1170
# of Employees 34 34 35 35 35 38 36 36 36 36 36 36
Information Research
Information Research 1 UKR 12 12 1 1 1 1 1 1 1 1 1 1 1 1 12
Information Research 2 GM 47 47 4 4 4 12
Information Research 3 GM 56 2 58 5 5 5 5 5 5 5 5 5 5 5 5 58
Information Research 4 GM 66 2 69 6 6 6 6 6 6 6 6 6 6 6 6 69
Information Research 5 GM 52 16 68 6 6 6 6 6 6 6 6 6 6 6 6 68
Information Research 6 GM 47 2 49 4 4 4 4 4 4 4 4 4 4 4 4 49
Information Research 7 UKR 12 12 1 1 1 1 1 1 1 1 1 1 1 1 12
Information Research 8 UKR 12 12 1 1 1 1 1 1 1 1 1 1 1 1 12
Recruit #1 UKR 12 12 1 1 1 1 1 1 1 1 1 1 10
Recruit #2 UKR 12 12 1 1 1 1 1 1 1 1 1 9
Recruit #3 UKR 12 12 1 1 1 1 1 1 1 1 1 1 10
Recruit #4 UKR 12 12 1 1 1 1 1 1 1 1 1 1 10
Temps 75 75 6 6 6 6 6 6 6 6 6 6 6 6 75
Total Research 427 23 449 33 33 36 34 34 34 34 34 34 34 34 34 405
# of Employees 9 9 12 12 12 12 12 12 12 12 12 12
BPO Services
bpo Services 1 UKR 24 24 2 2 2 2 2 2 2 2 2 2 2 2 24
bpo Services 2 UKR 18 18 2 2 2 2 2 2 2 2 2 2 2 2 18
bpo Services 3 UKR 11 11 1 1 1 1 1 1 1 1 1 1 1 1 11
bpo Services 4 UKR 18 18 2 2 2 2 2 2 2 2 2 2 2 2 18
bpo Services 5 UKR 18 18 2 2 2 2 2 2 2 2 2 2 2 2 18
bpo Services 6 UKR 12 12 1 1 1 1 1 1 1 1 1 1 1 1 12
bpo Services 7 UKR 8 8 1 1 1 1 1 1 1 1 1 1 1 1 8
bpo Services 8 UKR 7 7 1 1 1 1 1 1 1 1 1 1 1 1 7
Total BPO Services 116 116 10 10 10 10 10 10 10 10 10 10 10 10 116
# of Employees 8 8 8 8 8 8 8 8 8 8 8 8
Total 6886 247 8443 502 498 539 588 587 632 610 605 599 599 599 599 6960
# of Employees 100 100 105 110 111 117 110 110 109 109 109 109
Payroll of Clients ops part of COGS 72 79 85 89 96 96 103 103 103 103 103 103 1138
Payroll Other Expenses 430 420 454 499 491 536 507 502 496 496 496 496 5822
PAYROLL Location Rate Rate 2
Administration
Adm1 US 8.25% 2.25%
Adm2 US N/A N/A
Recruit #1 US 8.25% 2.25%
Recruit #2 US 8.25% 2.25%
Recruit #3 US 8.25% 2.25%
Adm3 US 8.25% 2.25%
Adm4 US 8.25% 2.25%
Adm5 US 8.25% 2.25%
Adm6 US 8.25% 2.25%
Adm7 UKR 36.77% N/A
Adm8 UKR 36.77% N/A
Adm9 GM 1,127.10$ -$
Adm10 GM 1,261.00$ -$
Adm11 GM 309.40$ -$
Adm12 GM 106.60$ -$
Adm13 GM 972.40$ -$
Adm14 GM 390.00$ -$
Adm15 GM 816.40$ -$
Adm16 GM 5.20$ -$
Total Administration
Marketing
Market1 US 8.25% 2.25%
Market2 US 8.25% 2.25%
Market3 US 8.25% 2.25%
Recruit #1 US 8.25% 2.25%
Recruit #2 US 8.25% 2.25%
Market4 GM 490.10$ -$
Market5 GM 1,046.50$ -$
Total Marketing
Sales - US
Sales 1 US 8.25% 2.25%
Recruit - Sales Support #2 US 8.25% 2.25%
Sales 2 US 8.25% 2.25%
Recruit - Team #1 US 8.25% 2.25%
Sales 3 US 8.25% 2.25%
Recruit - Team #1 US 8.25% 2.25%
Sales 4 US 8.25% 2.25%
Sales 5 US 8.25% 2.25%
Recruit - Team #2 US 8.25% 2.25%
Sales 6 US 8.25% 2.25%
Sales 7 US 8.25% 2.25%
Total Sales - US
Sales - EU
Sales 8 EU 0.00% 0.00%
Sales 9 EU
Recruit - Team #2 EU 1,264.90$ -$
Sales 10 GM 1,264.90$ -$
Sales 11 GM 1,134.90$ -$
Sales 12 GM 1,220.70$ -$
Sales 13 GM 1,089.40$ -$
Sales 14 GM 1,232.40$ -$
Sales 15 GM 1,236.30$ -$
Sales 16 GM 1,094.60$ -$
Sales 17 BD/UK -$ -$
Total Sales - EU
Total Sales
January February March April May June July August September October November December Total
1.4 1.4 1.4 1.4 1.4 1.4 1.4 .4 .4 .4 .4 .4 11.9
.0
.0 .0 1.2 1.2 1.2 1.2 1.2 1.2 .3 7.5
.6 .6 .6 .6 .6 .6 .6 .6 .2 4.6
.0 .0 .4 .4 .4 .4 .4 .4 .1 2.8
1.0 1.0 1.0 1.0 1.0 1.0 1.0 1.0 1.0 .3 .3 .3 9.5
.8 .8 .8 .8 .8 .8 .8 .8 .8 .8 .8 .8 9.1
.3 .3 .3 .3 .3 .3 .3 .3 .3 .3 .3 .3 3.2
.1 .1 .1 .1 .1 .1 .1 .1 .1 .1 .1 .1 1.0
.3 .3 .3 .3 .3 .3 .3 .3 .3 .3 .3 .3 3.4
.6 .6 .6 .6 .6 .6 .6 .6 .6 .6 .6 .6 6.6
1.1 1.1 1.1 1.1 1.1 1.1 1.1 1.1 1.1 1.1 1.1 1.1 13.5
1.3 1.3 1.3 1.3 1.3 1.3 .0 .0 .0 .0 .0 .0 7.6
.3 .3 .3 .3 .3 .3 .0 .0 .0 .0 .0 .0 1.9
.1 .1 .0 .0 .0 .0 .0 .0 .0 .0 .0 .0 .2
1.0 1.0 1.0 1.0 1.0 1.0 1.0 1.0 1.0 1.0 1.0 1.0 11.7
.4 .4 .4 .4 .4 .4 .4 .0 .0 .0 .0 .0 2.7
.8 .8 .8 .8 .8 .8 .8 .0 .0 .0 .0 .0 5.7
.0 .0 .0 .0 .0 .0 .0 .0 .0 .0 .0 .0 .0
9.3 9.3 9.2 9.8 9.8 11.4 9.8 7.6 7.6 6.9 6.9 5.3 102.8
1.2 1.2 1.2 1.2 .6 .0 .0 .0 .0 .0 .0 .0 5.6
.9 .9 .0 .0 .0 .0 .0 .0 .0 .0 .0 .0 1.8
.5 .5 .0 .0 .0 .0 .0 .0 .0 .0 .0 .0 1.1
.0 .0 .0 .0 .0 1.0 1.0 1.0 1.0 1.0 1.0 1.0 7.2
.0 .0 .9 .9 .9 .9 .9 .9 .9 .9 .9 .9 8.9
.5 .5 .5 .5 .5 .5 .0 .0 .0 .0 .0 .0 2.9
1.0 1.0 1.0 1.0 1.0 1.0 1.0 .0 .0 .0 .0 .0 7.3
4.2 4.2 3.7 3.7 3.0 3.5 3.0 1.9 1.9 1.9 1.9 1.9 34.8
1.5 1.5 1.5 1.5 1.5 1.5 1.5 .4 .4 .4 .4 .4 12.7
.8 .8 .8 .8 .8 .8 .8 .8 .8 7.4
1.3 1.3 1.3 1.3 1.3 1.3 1.3 .4 .4 .4 .4 .4 11.2
.7 1.4 1.4 1.4 1.4 1.4 1.4 1.4 .4 .4 11.1
.8 .8 .8 .8 .8 .8 .8 .8 .8 .8 .8 .8 9.9
.8 .8 .8 .8 .8 .8 .8 .8 .8 7.4
.0 .7 .7 .7 .7 .7 .7 4.1
1.1 1.1 1.1 1.1 1.1 1.1 1.1 1.1 1.1 .3 .3 .3 11.1
.8 .0 .0 .0 .0 .0 .0 .0 .0 .0 .0 .0 .8
1.0 1.0 1.0 1.0 1.0 1.0 1.0 1.0 1.0 9.3
.0 .0 .0 .7 .7 .7 .7 .7 .7 4.1
.0 .0 .8 .8 .8 .8 .8 .8 .8 .8 .8 .8 8.3
.5 .5 .5 .5 .5 .5 .5 .5 .5 .5 .5 .5 5.8
6.1 5.3 6.8 10.2 10.2 10.2 11.6 9.5 9.5 8.7 7.7 7.7 103.2
.0 .0 .0 .0 .0 .0 .0 .0 .0 .0 .0 .0 .0
.0
1.3 1.3 1.3 1.3 1.3 1.3 1.3 8.9
1.3 1.3 1.3 1.3 1.3 1.3 1.3 1.3 1.3 1.3 1.3 1.3 15.2
1.1 1.1 1.1 1.1 1.1 1.1 1.1 1.1 1.1 1.1 1.1 1.1 13.6
1.2 1.2 1.2 1.2 1.2 1.2 7.3
1.1 1.1 1.1 1.1 1.1 1.1 1.1 1.1 1.1 1.1 1.1 1.1 13.1
1.2 1.2 1.2 1.2 1.2 1.2 1.2 1.2 1.2 1.2 1.2 1.2 14.8
1.2 1.2 1.2 1.2 1.2 1.2 1.2 1.2 1.2 1.2 1.2 1.2 14.8
1.1 1.1 1.1 1.1 1.1 1.1 1.1 1.1 1.1 1.1 1.1 1.1 13.1
.0 .0 .0 .0 .0 .0 .0 .0 .0 .0 .0 .0 .0
8.3 8.3 8.3 8.3 8.3 9.5 8.3 8.3 8.3 8.3 8.3 8.3 100.8
14.4 13.6 15.1 18.4 18.4 19.7 19.9 17.8 17.8 17.0 16.0 16.0 204.0
PAYROLL Location Health Benefit Pension Fund Car Other Total January February March April May June July August September October November December Total2
Administration
Adm1 US .000 .000 18.000 .000 18.000 1.500 1.500 1.500 1.500 1.500 1.500 1.500 1.500 1.500 1.500 1.500 1.500 18.000
Adm2 US .000 .000 .000 .000 .000 .000 .000 .000 .000 .000 .000 .000 .000 .000 .000 .000 .000 .000
Recruit #1 US 15.000 .000 .000 .000 15.000 1.250 1.250 1.250 1.250 1.250 1.250 1.250 8.750
Recruit #2 US 15.000 .000 .000 .000 15.000 1.250 1.250 1.250 1.250 1.250 1.250 1.250 1.250 1.250 11.250
Recruit #3 US 10.000 .000 .000 .000 10.000 .833 .833 .833 .833 .833 .833 .833 5.833
Adm3 US 16.900 .000 6.000 .000 22.900 1.908 1.908 1.908 1.908 1.908 1.908 1.908 1.908 1.908 1.908 1.908 1.908 22.900
Adm4 US 11.900 .000 .000 .000 11.900 .992 .992 .992 .992 .992 .992 .992 .992 .992 .992 .992 .992 11.900
Adm5 US 5.100 .000 .000 .000 5.100 .425 .425 .425 .425 .425 .425 .425 .425 .425 .425 .425 .425 5.100
Adm6 US .000 .000 .000 .000 .000 .000 .000 .000 .000 .000 .000 .000 .000 .000 .000 .000 .000 .000
Adm7 UKR .367 .000 .000 .612 .979 .082 .082 .082 .082 .082 .082 .082 .082 .082 .082 .082 .082 .979
Adm8 UKR .367 .000 .000 .000 .367 .031 .031 .031 .031 .031 .031 .031 .031 .031 .031 .031 .031 .367
Adm9 GM .000 .000 .000 .000 .000 .000 .000 .000 .000 .000 .000 .000 .000 .000 .000 .000 .000 .000
Adm10 GM .000 .000 .000 .000 .000 .000 .000 .000 .000 .000 .000 .000 .000 .000 .000 .000 .000 .000
Adm11 GM .000 .000 .000 .000 .000 .000 .000 .000 .000 .000 .000 .000 .000 .000 .000 .000 .000 .000
Adm12 GM .000 .000 .000 .000 .000 .000 .000 .000 .000 .000 .000 .000 .000 .000 .000 .000 .000 .000
Adm13 GM .000 .000 .000 .000 .000 .000 .000 .000 .000 .000 .000 .000 .000 .000 .000 .000 .000 .000
Adm14 GM .000 .000 .000 .000 .000 .000 .000 .000 .000 .000 .000 .000 .000 .000 .000 .000 .000 .000
Adm15 GM .000 .000 .000 .000 .000 .000 .000 .000 .000 .000 .000 .000 .000 .000 .000 .000 .000 .000
Adm16 GM .000 .000 .000 .000 .000 .000 .000 .000 .000 .000 .000 .000 .000 .000 .000 .000 .000 .000
Total Administration 74.634 .000 24.000 .612 99.246 4.937 4.937 4.937 6.187 6.187 8.271 8.271 8.271 8.271 8.271 8.271 8.271 85.079
Marketing
Market1 US 18.800 .000 7.200 .000 26.000 2.167 2.167 2.167 2.167 2.167 10.833
Market2 US 18.000 .000 .000 .000 18.000 1.500 1.500 3.000
Market3 US .000 .000 .000 .000 .000 .000 .000 .000 .000 .000 .000 .000 .000 .000 .000 .000 .000 .000
Recruit #1 US 10.000 10.000 .000 .833 .833 .833 .833 .833 .833 .833 5.833
Recruit #2 US 10.000 10.000 .833 .833 .833 .833 .833 .833 .833 .833 .833 .833 8.333
Market4 GM .000 .000 .000 .000 .000 .000 .000 .000 .000 .000 .000 .000 .000 .000 .000 .000 .000 .000
Market5 GM .000 .000 .000 .000 .000 .000 .000 .000 .000 .000 .000 .000 .000 .000 .000 .000
Total Marketing 56.800 .000 7.200 .000 64.000 3.667 3.667 3.000 3.000 3.000 1.667 1.667 1.667 1.667 1.667 1.667 1.667 28.000
Sales - US
Sales 1 US .000 .000 .000 .000 .000 .000 .000 .000 .000 .000 .000 .000 .000 .000 .000 .000 .000 .000
Recruit - Sales Support #2 US 12.000 .000 12.000 1.000 1.000 1.000 1.000 1.000 1.000 1.000 1.000 1.000 9.000
Sales 2 US 17.900 .000 14.400 .000 32.300 2.692 2.692 2.692 2.692 2.692 2.692 2.692 2.692 2.692 2.692 2.692 2.692 32.300
Recruit - Team #1 US 12.000 .000 12.000 1.000 1.000 1.000 1.000 1.000 1.000 1.000 1.000 8.000
Sales 3 US 18.600 .000 .000 .000 18.600 1.550 1.550 1.550 1.550 1.550 1.550 1.550 1.550 1.550 1.550 1.550 1.550 18.600
Recruit - Team #1 US 12.000 .000 12.000 1.000 1.000 1.000 1.000 1.000 1.000 1.000 1.000 1.000 9.000
Recruit - Team #1 US 12.000 .000 12.000 1.000 1.000 1.000 1.000 1.000 1.000 6.000
Sales 4 US 18.700 .000 .000 .000 18.700 1.558 1.558 1.558 1.558 1.558 1.558 1.558 1.558 1.558 1.558 1.558 1.558 18.700
Sales 5 US .000 .000 .000 .000 .000 .000 .000
Recruit - Team #2 US 12.000 .000 12.000 1.000 1.000 1.000 1.000 1.000 1.000 1.000 1.000 1.000 9.000
Recruit - Team #2 US 12.000 .000 12.000 .000 1.000 1.000 1.000 1.000 1.000 1.000 1.000 7.000
Sales 6 US 15.000 15.000 1.250 1.250 1.250 1.250 1.250 1.250 1.250 1.250 1.250 1.250 12.500
Sales 7 US .180 .000 .000 .000 .180 .015 .015 .015 .015 .015 .015 .015 .015 .015 .015 .015 .015 .180
Total Sales - US 142.380 .000 14.400 .000 156.780 5.815 5.815 7.065 10.065 11.065 12.065 13.065 13.065 13.065 13.065 13.065 13.065 130.280
Sales - EU
Sales 8 EU .000 .000 .000 .000 .000 .000 .000 .000 .000 .000 .000 .000 .000 .000 .000 .000 .000 .000
Sales 9 EU .000 .000 .000 .000 .000 .000 .000 .000 .000 .000 .000 .000
Recruit - Team #2 EU .000 .000 .000 .000 .000 .000 .000 .000 .000
Sales 10 GM .000 .000 11.622 .000 11.622 .969 .969 .969 .969 .969 .969 .969 .969 .969 .969 .969 .969 11.622
Sales 11 GM .000 .000 13.744 .000 13.744 1.145 1.145 1.145 1.145 1.145 1.145 1.145 1.145 1.145 1.145 1.145 1.145 13.744
Sales 12 GM .000 .000 .000 .000 .000 .000 .000 .000 .000 .000 .000 .000 .000 .000 .000 .000 .000 .000
Sales 13 GM .000 .000 .000 .000 .000 .000 .000 .000 .000 .000 .000 .000 .000 .000 .000 .000 .000 .000
Sales 14 GM .000 .000 .000 .000 .000 .000 .000 .000 .000 .000 .000 .000 .000 .000 .000 .000 .000 .000
Sales 15 GM .000 .000 .000 .000 .000 .000 .000 .000 .000 .000 .000 .000 .000 .000 .000 .000 .000 .000
Sales 16 GM .000 .000 .000 .000 .000 .000 .000 .000 .000 .000 .000 .000 .000 .000 .000 .000 .000 .000
Sales 17 BD/UK .000 .000 .000 .000 .000 .000 .000 .000 .000 .000 .000 .000 .000 .000 .000 .000 .000 .000
Total Sales - EU .000 .000 25.366 .000 25.366 2.114 2.114 2.114 2.114 2.114 2.114 2.114 2.114 2.114 2.114 2.114 2.114 25.366
Total Sales 142.380 .000 39.766 .000 182.146 7.929 7.929 9.179 12.179 13.179 14.179 15.179 15.179 15.179 15.179 15.179 15.179 155.646
Client Operations - US
ClientOps 1 US 18.611 .000 .000 .000 18.611 1.551 1.551 1.551 1.551 1.551 1.551 1.551 1.551 1.551 1.551 1.551 1.551 18.611
ClientOps 2 US 17.800 .000 .000 .000 17.800 1.483 1.483 1.483 1.483 1.483 1.483 1.483 1.483 1.483 1.483 1.483 1.483 17.800
ClientOps 3 US 5.300 .000 .000 .000 5.300 .442 .442 .442 .442 .442 .442 .442 .442 .442 .442 .442 .442 5.300
ClientOps 4 US 5.200 .000 .000 .000 5.200 .433 .433 .433 .433 .433 .433 .433 .433 .433 .433 .433 .433 5.200
ClientOps 5 US 5.200 .000 .000 .000 5.200 .433 .433 .433 .433 .433 .433 .433 .433 .433 .433 4.333
ClientOps 6 US 17.000 .000 .000 .000 17.000 1.417 1.417 1.417 1.417 1.417 1.417 1.417 1.417 1.417 1.417 1.417 1.417 17.000
ClientOps 7 US .000 .000 .000 .000 .000 .000 .000 .000 .000 .000 .000 .000 .000 .000 .000 .000 .000 .000
Recruit #1 US 10.000 .000 .000 .000 10.000 .833 .833 .833 .833 .833 .833 .833 .833 .833 .833 .833 .833 10.000
Total Client Operations - US 79.111 .000 .000 .000 79.111 6.159 6.159 6.593 6.593 6.593 6.593 6.593 6.593 6.593 6.593 6.593 6.593 78.244
Client Operations - EU
ClientOps 8 GM .000 .000 .000 .660 .660 .055 .055 .055 .055 .055 .055 .055 .055 .055 .055 .055 .055 .660
ClientOps 9 UKR .367 .660 .000 .000 1.027 .086 .086 .086 .086 .086 .086 .086 .086 .086 .086 .086 .086 1.027
ClientOps 10 GM .000 .000 .000 .660 .660 .055 .055 .055 .055 .055 .055 .055 .055 .055 .055 .055 .055 .660
ClientOps 10 UKR .367 .660 .000 .000 1.027 .086 .086 .086 .086 .086 .086 .086 .086 .086 .086 .086 .086 1.027
ClientOps 11 GM .000 .000 .000 .660 .660 .055 .055 .055 .055 .055 .055 .055 .055 .055 .055 .055 .055 .660
ClientOps 12 GM .000 .000 .000 .720 .720 .060 .060 .060 .060 .060 .060 .060 .060 .060 .060 .060 .660
ClientOps 13 GM .000 .000 .000 .660 .660 .055 .055 .055 .055 .055 .055 .055 .055 .055 .055 .055 .055 .660
Recruit #1 GM .000 .000 .000 .660 .660 .055 .055 .055 .055 .055 .055 .055 .055 .440
Recruit #2 GM .000 .000 .000 .660 .660 .055 .055 .055 .055 .055 .055 .330
Total Client Operations - EU .734 1.320 .000 4.680 6.734 .391 .451 .451 .451 .506 .506 .561 .561 .561 .561 .561 .561 6.124
Total Client Operations 79.845 1.320 .000 4.680 85.845 6.550 6.610 7.044 7.044 7.099 7.099 7.154 7.154 7.154 7.154 7.154 7.154 84.368
Technology
Technology 1 UKR .367 .660 .000 .000 1.027 .086 .086 .086 .086 .086 .086 .086 .086 .086 .086 .086 .086 1.027
Technology 2 UKR .367 .660 .000 .612 1.639 .137 .137 .137 .137 .137 .137 .137 .137 .137 .137 .137 .137 1.639
Technology 3 UKR .367 .660 .000 .000 1.027 .086 .086 .086 .086 .086 .086 .086 .086 .086 .086 .086 .086 1.027
Technology 4 UKR .367 .660 .000 .000 1.027 .086 .086 .086 .086 .086 .086 .086 .086 .086 .086 .086 .086 1.027
Technology 5 UKR .367 .660 .000 .000 1.027 .086 .086 .086 .086 .086 .086 .086 .086 .086 .086 .086 .086 1.027
Technology 6 US .367 .000 .000 .612 .979 .082 .082 .082 .082 .082 .082 .082 .082 .082 .082 .082 .082 .979
Technology 7 UKR .367 .660 .000 .000 1.027 .086 .086 .086 .086 .086 .086 .086 .086 .086 .086 .086 .086 1.027
Technology 8 UKR .367 .660 .000 .000 1.027 .086 .086 .086 .086 .086 .086 .086 .086 .086 .086 .086 .086 1.027
Technology 9 UKR .367 .660 .000 .000 1.027 .086 .086 .086 .086 .086 .086 .086 .086 .086 .086 .086 .086 1.027
Technology 10 UKR .367 .660 .000 .000 1.027 .086 .086 .086 .086 .086 .086 .086 .086 .086 .086 .086 .086 1.027
Technology 11 UKR .367 .660 .000 .000 1.027 .086 .086 .086 .086 .086 .086 .086 .086 .086 .086 .086 .086 1.027
Technology 12 UKR .367 .660 .000 .612 1.639 .137 .137 .137 .137 .137 .137 .137 .137 .137 .137 .137 .137 1.639
Technology 13 UKR .367 .660 .000 .000 1.027 .086 .086 .086 .086 .086 .086 .086 .086 .086 .086 .086 .086 1.027
Technology 14 UKR .367 .660 .000 .000 1.027 .086 .086 .086 .086 .086 .086 .086 .086 .086 .086 .086 .086 1.027
Technology 15 UKR .367 .660 .000 .000 1.027 .086 .086 .086 .086 .086 .086 .086 .086 .086 .086 .086 .086 1.027
Technology 16 UKR .367 .660 .000 .000 1.027 .086 .086 .086 .086 .086 .086 .086 .086 .086 .086 .086 .086 1.027
Technology 17 UKR .367 .660 .000 .000 1.027 .086 .086 .086 .086 .086 .086 .086 .086 .086 .086 .086 .086 1.027
Technology 18 UKR .367 .660 .000 .000 1.027 .086 .086 .086 .086 .086 .086 .086 .086 .086 .086 .086 .086 1.027
Technology 19 UKR .367 .660 .000 .000 1.027 .086 .086 .086 .086 .086 .086 .086 .086 .086 .086 .086 .086 1.027
Technology 20 UKR .367 .660 .000 .000 1.027 .086 .086 .086 .086 .086 .086 .000 .000 .000 .000 .000 .000 .514
Technology 21 UKR .367 .660 .000 .000 1.027 .086 .086 .086 .086 .086 .086 .086 .086 .086 .086 .086 .086 1.027
Technology 22 UKR .367 .660 .000 .000 1.027 .086 .086 .086 .086 .086 .086 .086 .086 .086 .086 .086 .086 1.027
Technology 23 UKR .367 .660 .000 .000 1.027 .086 .086 .086 .086 .086 .086 .086 .086 .086 .086 .086 .086 1.027
Technology 24 UKR .367 .660 .000 .000 1.027 .086 .086 .086 .086 .086 .086 .086 .086 .086 .086 .086 .086 1.027
Technology 25 UKR .367 .660 .000 .000 1.027 .086 .086 .086 .086 .086 .086 .086 .086 .086 .086 .086 .086 1.027
Technology 26 UKR .367 .660 .000 .000 1.027 .086 .086 .086 .086 .086 .086 .086 .086 .086 .086 .086 .086 1.027
Technology 27 GM .000 .000 .000 .660 .660 .055 .055 .055 .055 .055 .055 .055 .055 .055 .055 .055 .055 .660
Technology 28 GM .000 .000 .000 .660 .660 .055 .055 .055 .055 .055 .055 .055 .055 .055 .055 .055 .055 .660
Technology 29 GM .000 .000 .000 .660 .660 .055 .055 .055 .055 .055 .055 .055 .055 .055 .055 .055 .055 .660
Technology 30 GM .000 .000 .000 .660 .660 .055 .055 .055 .055 .055 .055 .055 .055 .055 .055 .055 .055 .660
Technology 31 GM .000 .000 .000 .660 .660 .055 .055 .055 .055 .055 .055 .055 .055 .055 .055 .055 .055 .660
Technology 32 GM .000 .000 .000 .660 .660 .055 .055 .055 .055 .055 .055 .330
Technology 33 GM .000 .000 .000 .660 .660 .055 .055 .055 .055 .055 .055 .055 .055 .055 .055 .055 .055 .660
Technology 34 US 18.000 .000 .000 .000 18.000 1.500 1.500 1.500 1.500 1.500 1.500 1.500 1.500 1.500 1.500 15.000
Recruit #1 UKR .367 .660 .000 .000 1.027 .086 .086 .086 .086 .086 .086 .086 .086 .086 .086 .086 .086 1.027
Recruit #2 UKR .367 .660 .000 .000 1.027 .086 .086 .086 .086 .086 .086 .514
Recruit #3 UKR .367 .660 .000 .000 1.027 .086 .086 .086 .086 .086 .086 .514
Recruit #4 UKR .367 .660 .000 .000 1.027 .086 .086 .086 .086 .086 .086 .514
Total Technology 29.010 19.140 .000 6.456 54.606 2.794 2.794 4.294 4.294 4.294 4.294 4.410 4.410 4.410 4.410 4.410 4.410 49.222
Information Research
Information Research 1 UKR .367 .660 .000 .720 1.747 .146 .146 .146 .146 .146 .146 .146 .146 .146 .146 .146 .146 1.747
Information Research 2 GM .000 .000 .000 .000 .000 .000 .000 .000 .000
Information Research 3 GM .000 .000 .000 .000 .000 .000 .000 .000 .000 .000 .000 .000 .000 .000 .000 .000 .000 .000
Information Research 4 GM .000 .000 .000 .000 .000 .000 .000 .000 .000 .000 .000 .000 .000 .000 .000 .000 .000 .000
Information Research 5 GM .000 .000 .000 .000 .000 .000 .000 .000 .000 .000 .000 .000 .000 .000 .000 .000 .000 .000
Information Research 6 GM .000 .000 .000 .000 .000 .000 .000 .000 .000 .000 .000 .000 .000 .000 .000 .000 .000 .000
Information Research 7 UKR .367 .660 .000 .000 1.027 .086 .086 .086 .086 .086 .086 .086 .086 .086 .086 .086 .086 1.027
Information Research 8 UKR .367 .660 .000 .000 1.027 .086 .086 .086 .086 .086 .086 .086 .086 .086 .086 .086 .086 1.027
Recruit #1 UKR .367 .660 .000 .000 1.027 .086 .086 .086 .086 .086 .086 .086 .086 .086 .086 .856
Recruit #2 UKR .367 .660 .000 1.027 .086 .086 .086 .086 .086 .086 .086 .086 .086 .770
Recruit #3 UKR .367 .660 .000 1.027 .086 .086 .086 .086 .086 .086 .086 .086 .086 .086 .856
Recruit #4 UKR .367 .660 .000 1.027 .086 .086 .086 .086 .086 .086 .086 .086 .086 .086 .856
Temps 0 .000 .000 .000 .000 .000 .000 .000 .000 .000 .000 .000 .000 .000 .000
Total Research 2.569 4.620 .000 .720 7.909 .317 .317 .574 .659 .659 .659 .659 .659 .659 .659 .659 .659 7.139
BPO Services
bpo Services 1 UKR .367 .000 .000 .000 .367 .031 .031 .031 .031 .031 .031 .031 .031 .031 .031 .031 .031 .367
bpo Services 2 UKR .367 .660 .000 .000 1.027 .086 .086 .086 .086 .086 .086 .086 .086 .086 .086 .086 .086 1.027
bpo Services 3 UKR .367 .660 .000 .000 1.027 .086 .086 .086 .086 .086 .086 .086 .086 .086 .086 .086 .086 1.027
bpo Services 4 UKR .367 .000 .000 .000 .367 .031 .031 .031 .031 .031 .031 .031 .031 .031 .031 .031 .031 .367
bpo Services 5 UKR .367 .660 .000 .000 1.027 .086 .086 .086 .086 .086 .086 .086 .086 .086 .086 .086 .086 1.027
bpo Services 6 UKR .367 .660 .000 .000 1.027 .086 .086 .086 .086 .086 .086 .086 .086 .086 .086 .086 .086 1.027
bpo Services 7 UKR .367 .660 .000 .000 1.027 .086 .086 .086 .086 .086 .086 .086 .086 .086 .086 .086 .086 1.027
bpo Services 8 UKR .367 .660 .000 .660 1.687 .141 .141 .141 .141 .141 .141 .141 .141 .141 .141 .141 .141 1.687
Total BPO Services 3 4 1 8 1 1 1 1 1 1 1 1 1 1 1 1 8
Total 388 29 71 13 501 27 27 30 34 35 37 38 38 38 38 38 38 417
FACILITY Location Rent
Rent
NJ US 25
Germany GM 14
Total Rent 40
% of Revenue
Utilities
NJ US 4
Germany GM 5
Total Utilities 9
% of Revenue
Other Facilities
NJ US 1
Germany GM 1
Total Other Facilities 2
% of Revenue
Total Facilites
% of Revenue
January February March April May June July August September October November December Total2
25 25 25 25 25 25 25 25 25 25 25 25 303
14 14 14 14 14 14 14 14 14 14 14 14 172
40 40 40 40 40 40 40 40 40 40 40 40 474
4% 4% 5% 5% 5% 3% 4% 4% 4% 4% 3% 3%
4 4 4 4 4 4 4 4 4 4 4 4 46
5 5 5 5 5 5 3 3 3 3 3 3 45
9 9 9 9 9 9 6 6 6 6 6 6 91
1% 1% 1% 1% 1% 1% 1% 1% 1% 1% 0% 0%
1 1 1 1 1 1 1 1 1 1 1 1 9
1 1 1 1 1 1 1 1 1 1 1 1 12
2 2 2 2 2 2 1 1 1 1 1 1 21
0% 0% 0% 0% 0% 0% 0% 0% 0% 0% 0% 0%
50 50 50 50 50 50 47 47 47 47 47 47 586
6% 5% 6% 7% 7% 4% 5% 5% 4% 4% 4% 3% 5%
Column1 Column2 Column3 Column4 Column5 Column6 Column7 Column8 Column9 Column10 Column11 Column12 Column13 Column14 Column15 Column16
G & A Fixed Monthly January-13 February-13 March-13 April-13 May-13 June-13 July-13 August-13 September-13 October-13 November-13 December-13 Total
Dues & Subscriptions
201 Littleton Road, Morris Plains, NJ .25 .25 .25 .25 .25 .25 .25 .25 .25 .25 .25 .25 .25 3.00
Germany .25 .25 .25 .25 .25 .25 .25 .25 .25 .25 .25 .25 .25 3.00
Total Dues & Subscriptions .5 .5 .5 .5 .5 .5 .5 .5 .5 .5 .5 .5 .5 6.0
% of Revenue 0% 0% 0% 0% 0% 0% 0% 0% 0% 0% 0% 0%
Insurance
US
General Liability 3.2 3.2 3.2 3.2 3.2 3.2 3.2 3.2 3.2 3.2 3.2 3.2 3.2 38.7
Workers Compensation 2.3 2.3 2.3 2.3 2.3 2.3 2.3 2.3 2.3 2.3 2.3 2.3 2.3 27.6
D&O Insurance 3.2 3.2 3.2 3.2 3.2 3.2 3.2 3.2 3.2 3.2 3.2 3.2 3.2 37.8
Total Insurance - US 8.7 8.7 8.7 8.7 8.7 8.7 8.7 8.7 8.7 8.7 8.7 8.7 8.7 104.1
Germany
Insurance Premiums .8 .8 .8 .8 .8 .8 .8 .8 .8 .8 .8 .8 .8 9.0
Workers Compensation 1.3 1.3 1.3 1.3 1.3 1.3 1.3 1.3 1.3 1.3 1.3 1.3 1.3 15.0
Total Insurance - Germany 2.0 2.0 2.0 2.0 2.0 2.0 2.0 2.0 2.0 2.0 2.0 2.0 2.0 24.0
Total Insurance 10.7 10.7 10.7 10.7 10.7 10.7 10.7 10.7 10.7 10.7 10.7 10.7 10.7 128.1
% of Revenue 1.21% 1.06% 1.24% 1.46% 1.38% 0.88% 1.05% 1.03% 0.99% 0.95% 0.84% 0.71%
Accounting
US
Audit 4.0 4.0 4.0 4.0 4.0 4.0 4.0 4.0 4.0 4.0 4.0 4.0 4.0 48.0
Tax 2.0 2.0 2.0 2.0 2.0 2.0 2.0 2.0 2.0 2.0 2.0 2.0 2.0 24.0
Other 2.0 2.0 2.0 2.0 2.0 2.0 2.0 2.0 2.0 2.0 2.0 2.0 2.0 24.0
Total Accounting - US 8.0 8.0 8.0 8.0 8.0 8.0 8.0 8.0 8.0 8.0 8.0 8.0 8.0 96.0
Germany
Audit 2.0 2.0 2.0 2.0 2.0 2.0 2.0 2.0 2.0 2.0 2.0 2.0 2.0 24.0
Tax 1.0 1.0 1.0 1.0 1.0 1.0 1.0 1.0 1.0 1.0 1.0 1.0 1.0 12.0
Other 4.5 4.5 4.5 4.5 4.5 4.5 4.5 4.5 4.5 4.5 4.5 4.5 4.5 54.0
Total Accounting - Germany 7.5 7.5 7.5 7.5 7.5 7.5 7.5 7.5 7.5 7.5 7.5 7.5 7.5 90.0
Total Accounting 15.5 15.5 15.5 15.5 15.5 15.5 15.5 15.5 15.5 15.5 15.5 15.5 15.5 186.0
% of Revenue 1.76% 1.53% 1.81% 2.12% 2.01% 1.28% 1.52% 1.49% 1.44% 1.38% 1.22% 1.03%
Legal
US
General 7.5 7.5 7.5 7.5 7.5 7.5 7.5 7.5 7.5 7.5 7.5 7.5 7.5 90.0
Total Legal - US 7.5 7.5 7.5 7.5 7.5 7.5 7.5 7.5 7.5 7.5 7.5 7.5 7.5 90.0
Germany
General 3.0 3.0 3.0 3.0 3.0 3.0 3.0 3.0 3.0 3.0 3.0 3.0 3.0 36.0
Total Legal - Germany 3.0 3.0 3.0 3.0 3.0 3.0 3.0 3.0 3.0 3.0 3.0 3.0 3.0 36.0
Total Legal 10.5 10.5 10.5 10.5 10.5 10.5 10.5 10.5 10.5 10.5 10.5 10.5 10.5 126.0
% of Revenue 1.19% 1.04% 1.22% 1.44% 1.36% 0.87% 1.03% 1.01% 0.97% 0.94% 0.82% 0.70%
Non-Operating - Other
Director 1
Director 2
Director 3
Total Other
% of Revenue
January-13 February-13 March-13 April-13 May-13 June-13 July-13 August-13 September-13 October-13 November-13 December-13 Total
.0 .0 .0 .0 .0 .0 5.0 5.0 5.0 5.0 5.0 5.0 30.0
3.0 3.0 3.0 3.0 3.0 3.0 3.0 3.0 3.0 3.0 3.0 3.0 36.0
5.0
8.0 3.0 3.0 3.0 3.0 3.0 8.0 8.0 8.0 8.0 8.0 8.0 66.0
0.91% 0.30% 0.35% 0.41% 0.39% 0.25% 0.78% 0.77% 0.74% 0.71% 0.63% 0.53%
TRAVEL AND EXPENSES Location Title
2013 Annual
Salary January-13 February-13 March-13 April-13 May-13 June-13 July-13 August-13 September-13 October-13 November-13 December-13 Total
Administration
Admin 1 US EMG/Sales 75.0 6.3 6.3 6.3 6.3 6.3 6.3 6.3 6.3 6.3 6.3 6.3 6.3 75.0
Admin 2 US CFO 10.0 .8 .8 .8 .8 .8 .8 5.0
Recruit #1 US CFO 5.0 .0 .4 .4 .4 .4 .4 .4 2.5
Admin 3 US VP Global Talent Dev & Admin 5.0 .4 .4 .4 .4 .4 .4 .4 .4 .4 .4 .4 .4 5.0
Admin 4 US Controller 5.0 .4 .4 .4 .4 .4 .4 .4 .4 .4 .4 .4 .4 5.0
Admin 5 GM EMG 15.0 1.3 1.3 1.3 1.3 1.3 1.3 1.3 1.3 1.3 1.3 1.3 1.3 15.0
Admin 6 US EMG/Commute 65.0 5.4 5.4 5.4 5.4 5.4 5.4 5.4 5.4 5.4 5.4 5.4 5.4 65.0
Admin 7 EU EMG 10.0 .8 .8 .8 .8 .8 .8 .8 .8 .8 .8 .8 .8 10.0
Admin 8 .0 25.0 .0 25.0
Admin 9 .0 .0 .0 15.0 .0 .0 .0 .0 .0 .0 .0 .0 .0 15.0
Admin 10 .0 .0 .0 .0 .0 .0 .0 .0 .0 .0 .0 .0 .0 .0
Total Administration 190.0 40.4 15.4 30.4 15.4 15.4 15.4 15.0 15.0 15.0 15.0 15.0 15.0 222.5
Marketing
Misc US VP Global Marketing 5.0 .4 .4 .4 .4 .4 .4 .4 .4 .4 .4 .4 .4 5.0
Total Marketing 5.0 .4 .4 .4 .4 .4 .4 .4 .4 .4 .4 .4 .4 5.0
Sales - US .0
Sales 1 US Chief Sales Officer 50.0 4.2 4.2 4.2 4.2 4.2 4.2 4.2 4.2 4.2 4.2 4.2 4.2 50.0
Recruit - Sales Support #2 US Sales Operations Mgr. .0 .0 .0 .0 .0 .0 .0 .0 .0 .0 .0
Salea 2 US VP for iPlan Dedicated Sales 22.5 1.9 1.9 1.9 1.9 1.9 1.9 1.9 1.9 1.9 1.9 1.9 1.9 22.5
Recruit - Team #1 US VP Strategic Solutions - Team #1 19.5 1.6 1.6 1.6 1.6 1.6 1.6 1.6 1.6 1.6 1.6 16.3
Sales 3 US Account Director - Team #1 15.0 1.3 1.3 1.3 1.3 1.3 1.3 1.3 1.3 1.3 1.3 1.3 1.3 15.0
Recruit - Team #1 US Sr Account Manager - Team #1 15.0 1.3 1.3 1.3 1.3 1.3 1.3 1.3 1.3 1.3 11.3
Recruit - Team #1 US Account Manager - Team #1 15.0 1.3 1.3 1.3 1.3 1.3 1.3 7.5
Sales 4 US VP Strategic Solutions - Team #2 37.5 3.1 3.1 3.1 3.1 3.1 3.1 3.1 3.1 3.1 3.1 3.1 3.1 37.5
Sales 5 US Resigned .0 .0 .0
Recruit - Team #2 US Sr Account Manager - Team #2 12.5 1.0 1.0 1.0 1.0 1.0 1.0 1.0 1.0 1.0 9.4
Recruit - Team #2 US Account Manager - Team #2 12.5 1.0 1.0 1.0 1.0 1.0 1.0 6.3
Saels 6 US Account Director - Team #1 10.5 .9 .9 .9 .9 .9 .9 .9 .9 .9 .9 8.8
Sales 7 US Business Development Director .0 .0 .0 .0 .0 .0 .0 .0 .0 .0 .0 .0 .0 .0
Total Sales - US 210.0 10.4 10.4 12.9 15.2 15.2 15.2 17.5 17.5 17.5 17.5 17.5 17.5 184.4
Sales - EU
Sales 8 EU VP Strategic Solutions Team #1 30.0 2.5 2.5 2.5 2.5 2.5 2.5 2.5 2.5 2.5 2.5 2.5 2.5 30.0
Sales 9 EU VP Strategic Solutions Team #2 22.5 1.9 1.9 1.9 1.9 1.9 1.9 1.9 1.9 1.9 1.9 1.9 1.9 22.5
Recruit - Team #2 EU Sr Account Manager - Team #2 7.5 .6 .6 .6 .6 .6 .6 .6 4.4
Sales 10 GM VP Strategic Solutions Team #3 22.5 1.9 1.9 1.9 1.9 1.9 1.9 1.9 1.9 1.9 1.9 1.9 1.9 22.5
Sales 11 GM Account Director - Team #1 15.0 1.3 1.3 1.3 1.3 1.3 1.3 1.3 1.3 1.3 1.3 1.3 1.3 15.0
Sales 12 GM Account Director - Team #3 12.5 1.0 1.0 1.0 1.0 1.0 1.0 .0 .0 .0 .0 .0 .0 6.3
Sales 13 GM Sr Account Manager - Team #3 10.0 .8 .8 .8 .8 .8 .8 .8 .8 .8 .8 .8 .8 10.0
Sales 14 GM Sr Account Manager - Team #1 15.0 1.3 1.3 1.3 1.3 1.3 1.3 1.3 1.3 1.3 1.3 1.3 1.3 15.0
Sales 15 GM Account Manager - Team #2 7.5 .6 .6 .6 .6 .6 .6 .6 .6 .6 .6 .6 .6 7.5
Sales 16 GM Sr Account Manager - Team #1 15.0 1.3 1.3 1.3 1.3 1.3 1.3 1.3 1.3 1.3 1.3 1.3 1.3 15.0
Sales 17 BD/UK Business Dev. Manager .0 .0 .0 .0 .0 .0 .0 .0 .0 .0 .0 .0 .0 .0
Total Sales - EU 157.5 12.5 12.5 12.5 12.5 12.5 13.1 12.1 12.1 12.1 12.1 12.1 12.1 148.1
Total Sales 367.5 22.9 22.9 25.4 27.7 27.7 28.3 29.6 29.6 29.6 29.6 29.6 29.6 332.5
Client Operations - US
General 70.0 5.8 5.8 5.8 5.8 5.8 5.8 5.8 5.8 5.8 5.8 5.8 5.8 70.0
Total Client Operations - US 70.0 5.8 5.8 5.8 5.8 5.8 5.8 5.8 5.8 5.8 5.8 5.8 5.8 70.0
Client Operations - EU
General 80.0 6.7 6.7 6.7 6.7 6.7 6.7 6.7 6.7 6.7 6.7 6.7 6.7 80.0
Total Client Operations - EU 80.0 6.7 6.7 6.7 6.7 6.7 6.7 6.7 6.7 6.7 6.7 6.7 6.7 80.0
Total Client Operations 150.0 12.5 12.5 12.5 12.5 12.5 12.5 12.5 12.5 12.5 12.5 12.5 12.5 150.0
Technology
General UKR Project Operator 20.0 1.7 1.7 1.7 1.7 1.7 1.7 1.7 1.7 1.7 1.7 1.7 1.7 20.0
Total Technology 20.0 1.7 1.7 1.7 1.7 1.7 1.7 1.7 1.7 1.7 1.7 1.7 1.7 20.0
Information Research
General UKR Jr. Research Manager 10.0 .8 .8 .8 .8 .8 .8 .8 .8 .8 .8 .8 .8 10.0
Total Research 10.0 .8 .8 .8 .8 .8 .8 .8 .8 .8 .8 .8 .8 10.0
BPO Services
General UKR Knowledge Specialist 10.0 .8 .8 .8 .8 .8 .8 .8 .8 .8 .8 .8 .8 10.0
SME Consulting Dept January-13 February-13 March-13 April-13 May-13 June-13 July-13 August-13 September-13 October-13 November-13 December-13 Total
Assumed NB Using Consultnat 2000
Assumed Consulting Rate 10%
SME Consultant 10 10 10 10 10 10 17 17 17 17 17 17 160
Total SME Consultant 10,000$ 10,000$ 10,000$ 10,000$ 10,000$ 10,000$ 16,667$ 16,667$ 16,667$ 16,667$ 16,667$ 16,667$ 160,000$
% of Revenue 1.14% 0.99% 1.17% 1.37% 1.30% 0.83% 1.63% 1.61% 1.55% 1.49% 1.31% 1.10% 1.28%
Maketing January-13 February-13 March-13 April-13 May-13 June-13 July-13 August-13 September-13 October-13 November-13 December-13 Total
website redesign & optimization .0 5.0 5.0 10.0
rebranding .0 .0 .0
analyst .0 .0 .0 .0 .0 .0 .0 .0 .0 .0 .0 .0 .0
advisory boards (client & scientific) .0 .0 .0 .0 .0 .0 .0 .0 .0 .0 .0 .0 .0
website maintenance .0 1.0 1.0 2.0
search engine optimization .0 .0 1.0 .0 1.0 1.0 3.0
adboard meetings (4) .0 2.0 2.0 2.0 6.0
web-based advertising .0 2.5 2.5 5.0
PR Agency (monthly retainer) 8.0 8.0 .0 .0 .0 .0 .0 .0 .0 .0 .0 .0 16.0
webinars (4) .0 .0 2.8 2.8 5.5
event exhibition/sponsorships (1) .0 10.0 10.0
direct marketing .0 .0 .0 1.0 1.0
coop advertising .0 .0 .0 .0 .0
association memberships .0 .5 .5
translation services .0 2.0 2.0
outside consulting services 5.1 5.1
printing 5.0 5.0
product demo videos .0 5.5 5.5
promotional materials 4.2 4.2
sales training .0 .0 .0
outside creative services .0 5.0 5.0
Total Marketing 13.1 13.0 14.2 7.5 12.8 4.0 17.3 .0 3.0 .0 .0 1.0 85.8
% of Revenue 1.49% 1.29% 1.66% 1.03% 1.65% 0.33% 1.69% 0.00% 0.28% 0.00% 0.00% 0.07% 0.69%
Silent Partner Loans
Germany
1 2 1 1 1 Total
Date of Note 6/1/2011 6/1/2011 6/1/2011 6/1/2011 6/1/2011
Note Amount (Euro) 200 500 300 300 260 1560
Note Amt ($ - 1.3) 260 650 390 390 338 2028
Current Int Rate 8.00% 7.50% 7.74% 7.74% 7.74%
Date Note due 20% 6/30/2017 6/30/2018 6/30/2019 6/30/2019 6/30/2019
20% 6/30/2018 6/30/2019 6/30/2020 6/30/2020 6/30/2020
60% 6/30/2019 6/30/2020 6/30/2021 6/30/2021 6/30/2021
365/366 day year
Interest payment dates Quarter
Beg Total # of Total Quarterly Interest Interest Principal Cash End
Principal Daily Rate Days Interest Payable Payments Repayment Payment Principal
Monthly version on the above schedule: 2012 and 2013
1/1/2013 2028.0 10.5 10.5 2028.0
2/5/2013 2028.0 10.5 21.0 2028.0
3/7/2013 2028.0 10.5 .0 -31.5 2028.0
4/6/2013 2028.0 10.5 10.5 2028.0
5/6/2013 2028.0 10.5 21.0 2028.0
6/5/2013 2028.0 10.5 .0 -31.5 2028.0
7/5/2013 2028.0 10.5 10.5 2028.0
8/4/2013 2028.0 10.5 21.0 2028.0
9/3/2013 2028.0 10.5 .0 -31.5 2028.0
10/3/2013 2028.0 10.5 10.5 2028.0
11/2/2013 2028.0 10.5 21.0 2028.0
12/2/2013 2028.0 10.5 .0 -31.5 2028.0
A-B A C Total
Date of Note
Note Amount (Euro) 32 42 190 264
Note Amt ($ - 1.3) 42 55 247 343
Current Int Rate 8.00% 8.00% 6.00%
Date Note due
365/366 day year
Interest payment dates Quarter
Beg Total # of Total Quarterly Interest Interest Principal Cash End
Principal Daily Rate Days Interest Payable Payments Repayment Payment Principal
Monthly version on the above schedule: 2012 and 2013
1/1/2013 343.2 1.9 1.9 343.2
2/5/2013 343.2 1.9 3.8 343.2
3/7/2013 343.2 1.9 .0 -5.6 343.2
4/6/2013 343.2 1.9 1.9 343.2
5/6/2013 343.2 1.9 3.8 343.2
6/5/2013 343.2 1.9 .0 -5.6 343.2
7/5/2013 343.2 1.9 1.9 343.2
8/4/2013 343.2 1.9 3.8 343.2
9/3/2013 343.2 1.9 .0 -5.6 343.2
10/3/2013 343.2 1.9 1.9 343.2
11/2/2013 343.2 1.9 3.8 343.2
12/2/2013 343.2 1.9 .0 -5.6 343.2
For Interest Calculation Purposes
Investment Partners SBIC
Sela 2, Inc.
Date of Note 6/1/2011
Note Amount 3000
Current Int Rate 10.00%
PIK Int Rate 2.00%
Total Interest 12.00%
Applicable Cash Percentage 0.833333333
Date Note due 6/1/2016
365/366 day year
Interest payment dates Quarter
Beg Total # of Total Quarterly Interest Interest Applicable Cash PIK Principal Cash End Interest
Principal Daily Rate Days Interest Payable Payments Interest Due Interest Repayment Payment Principal Receivable
Monthly version on the above schedule: 2012 and 2013
1/26/2012 3035.1 30.2 25.2 5.0 3040.2
2/25/2012 3040.2 30.2 25.2 5.0 3045.2
3/26/2012 3045.2 30.2 25.2 5.0 3050.2
4/25/2012 3050.2 30.3 25.3 5.1 3055.3
5/25/2012 3055.3 30.3 25.3 5.1 3060.3
6/24/2012 3060.3 30.3 25.3 5.1 3065.4
7/24/2012 3065.4 30.8 25.7 5.1 3070.5
8/23/2012 3070.5 30.8 25.7 5.1 3075.7
9/22/2012 3075.7 30.8 25.7 5.1 3080.8
10/22/2012 3080.8 31.0 25.8 5.2 3086.0
11/21/2012 3086.0 31.0 25.8 5.2 3091.1
12/21/2012 3091.1 31.0 25.8 5.2 3096.3
1/20/2013 3096.3 30.5 30.5 25.4 5.1 3101.4
2/19/2013 3101.4 30.5 61.1 25.4 5.1 3106.5
3/21/2013 3106.5 30.5 .0 -91.6 25.4 5.1 3111.6
4/20/2013 3111.6 31.0 31.0 25.9 5.2 3116.7
5/20/2013 3116.7 31.0 62.1 25.9 5.2 3121.9
6/19/2013 3121.9 31.0 .0 -93.1 25.9 5.2 3127.1
7/19/2013 3127.1 31.5 31.5 26.3 5.3 3132.3
8/18/2013 3132.3 31.5 63.1 26.3 5.3 3137.6
9/17/2013 3137.6 31.5 .0 -94.6 26.3 5.3 3142.8
10/17/2013 3142.8 31.7 31.7 26.4 5.3 3148.1
11/16/2013 3148.1 31.7 63.4 26.4 5.3 3153.4
12/16/2013 3153.4 31.7 .0 -95.1 26.4 5.3 3158.7
For Interest Calculation Purposes
Asset Type Asset Descrip. Year CapitalizedOringial cost Years Depr Method Acc. Depreci Depreciation Depreciation Net
Date in Service 12.31.12 Monthly 2013 YTD Assets 12.31.13
Computer Hardware HP equipment 2009 3,608$ 3 Srt Line/Half Yr 3,608$ (0)$
Computer Hardware HP equipment 2009 4,360$ 3 Srt Line/Half Yr 4,360$ (0)$
Computer Hardware HP equipment 2011 6,796$ 3 Srt Line/Half Yr 2,775$ 189$ 189 3,832$
Computer Hardware Server - Ukrn 2012 9,243$ 3 Srt Line/Half Yr 770$ 257$ 257 8,216$
24,007$ 11,513$ 446$ 446 12,048$
Furniture & Fixtures Office Furniture & Fixt. 2004 11,257$ 7 Srt Line/Half Yr 7,800$ 134$ 134 3,189$
ACCOUNT 1821
Computer Software Caching Servers 2011 25,306$ 3 Srt Line/Half Yr 13,356$ 703$ 703 10,544$
Computer Software Data Loaders 2011 48,211$ 3 Srt Line/Half Yr 25,444$ 1,339$ 1,339 20,089$
Computer Software iMarket 2011 29,905.56$ 3 Srt Line/Half Yr 15,784$ 831$ 831 12,460$
Computer Software iAlliance 2011 18,700.00$ 3 Srt Line/Half Yr 9,869$ 519$ 519 7,792$
Computer Software iPlan 2011 30,444.44$ 3 Srt Line/Half Yr 16,068$ 846$ 846 12,685$
Computer Software iMedical 2011 12,461.11$ 3 Srt Line/Half Yr 6,577$ 346$ 346 5,192$
Computer Software iPerformance 2011 9,777.78$ 3 Srt Line/Half Yr 5,160$ 272$ 272 4,074$
Computer Software MI-KOL 2011 128,006$ 3 Srt Line/Half Yr 67,559$ 3,556$ 3,556 53,335$
Computer Software Version 11.5 2011 300,443$ 3 Srt Line/Half Yr 158,567$ 8,346$ 8,346 125,184$
Computer Software iMarket 3/31/2013 2012 25,000$ 3 Srt Line/Half Yr -$ 694$ - 24,306$
Computer Software iPlan 3/31/2013 2012 25,000$ 3 Srt Line/Half Yr -$ 694$ - 24,306$
Computer Software iMarket 6/30/2013 2012 25,000$ 3 Srt Line/Half Yr -$ 694$ - 24,306$
Computer Software iPlan 6/30/2013 2012 25,000$ 3 Srt Line/Half Yr -$ 694$ - 24,306$
Computer Software iMarket 9/30/2013 2012 25,000$ 3 Srt Line/Half Yr -$ 694$ - 24,306$
Computer Software iPlan 9/30/2013 2012 25,000$ 3 Srt Line/Half Yr -$ 694$ - 24,306$
753,255$ 318,385$ 20,924$ 16,757 397,189$
Total 788,519$ 337,698$ 21,503$ 17,337 412,427$
Consolidated Summary Financials January February March April May June July August September October November December Full Year
Revenue
Total Software Revenue 310 310 327 327 350 400 424 442 483 490 541 612 5017
Total Data Revenue 569 701 531 403 422 809 596 596 596 630 733 897 7483
Total Revenue 879 1011 858 730 772 1209 1020 1037 1078 1120 1275 1509 12500
Cost of Goods Sold
Cost of Sales 104 110 148 122 129 129 136 136 136 136 136 136 1558
Other 36 36 36 36 36 36 43 43 43 43 43 43 472
Total Cost of Goods Sold 140 146 184 158 165 165 179 179 179 179 179 178 2030
Total Gross Profit 740 865 674 572 607 1044 841 859 900 942 1096 1331 10470
Margin %
Expenses
Payroll
Salaries 430 420 454 499 491 536 507 502 496 496 496 496 5822
Payroll Taxes 45 45 46 50 50 53 51 46 46 44 43 41 561
Benefits 20 20 23 27 28 30 31 31 31 31 31 31 333
Bonus
Comissions 15 26 39 42 46 59 64 65 69 75 86 104 690
Other
Total Payroll 511 510 562 618 614 677 653 644 642 646 656 672 7406
Marketing
Marketing 13 13 14 8 13 4 17 3 1 86
Total Marketing 13 13 14 8 13 4 17 3 1 86
Facilities
Rent 40 40 40 40 40 40 40 40 40 40 40 40 474
Utilities 9 9 9 9 9 9 6 6 6 6 6 6 91
Other 2 2 2 2 2 2 1 1 1 1 1 1 21
Total Facilities 50 50 50 50 50 50 47 47 47 47 47 47 586
SG&A
Dues & Subscriptions 1 1 1 1 1 1 1 1 1 1 1 1 6
Insurance 11 11 11 11 11 11 11 11 11 11 11 11 128
Accounting 16 16 16 16 16 16 16 16 16 16 16 16 186
Legal 11 11 11 11 11 11 11 11 11 11 11 11 126
Telephone & Internet 15 15 15 15 15 16 15 15 15 15 15 15 180
Travel & Entertainment 67 42 60 47 47 48 48 48 48 48 48 48 600
Consulting 2 2 12 22 22 22 22 22 22 22 22 22 217
IT Expense 5 5 5 5 5 5 5 5 5 5 5 5 54
Office Expense 13 13 13 13 13 13 13 13 13 13 13 13 158
Recruiting 5 5 5 5 5 5 5 5 5 5 5 5 54
Postage
Equipment Leases 5 5 5 5 5 5 5 5 5 5 5 5 65
Education & Training 3 3 3 3 3 3 3 3 3 3 3 3 31
Bank Charges 6 6 6 6 6 6 6 6 6 6 6 6 70
Other 1 1 1 1 1 1 1 1 1 1 1 1 12
Total SG&A 158 133 161 158 158 159 160 160 160 160 160 160 1887
Total Expenses 732 707 787 835 836 891 877 851 852 853 863 880 9965
EBITDA 7 158 -113 -262 -229 152 -36 8 47 89 233 451 505
Budget Yr Consolidated - Monthly 9/18/2013
Consolidated Summary Financials Sales - US Sales -SA
Client Ops
- US
Client Ops
- SA Marketing
Technolog
y BPO
Informatio
n Research
Administr
ation Total 2013
Revenue
Software
iPlan 724 482 1206
iLeader 96 64 161
iMarket 892 595 1487
Other 1298 865 2163
Total Software Revenue 3010 2007 5017
Data
R&D Cube
iBlkship 468 312 780
iAccess 58 38 96
iOpinion 234 156 391
iField
Other 3730 2486 6216
Total Data Revenue 4490 2993 7483
Total Revenue 7500 5000 12500
Cost of Goods Sold
Cost of Sales
Other 96 64 312 472
Total Cost of Goods Sold 96 64 312 472
Total Gross Profit 7404 4936 -312 12028
Margin % #DIV/0! #DIV/0! #DIV/0! #DIV/0! #DIV/0! #DIV/0! #DIV/0!
Expenses
Payroll
Salaries 1431 1221 608 530 350 1170 116 405 1128 6960
Payroll Taxes 103 101 50 91 35 114 16 89 103 702
Benefits 130 25 78 6 28 49 8 7 85 417
Bonus
Comissions 412 278 690
Other
Total Payroll 2077 1625 736 627 413 1333 140 502 1316 8769
Marketing
Marketing 86 86
Total Marketing 86 86
Facilities
Rent 474 474
Utilities 91 91
Other 21 21
Total Facilities 586 586
SG&A
Dues & Subscriptions 6 6
Insurance 128 128
Accounting 186 186
Legal 126 126
Telephone & Internet 13 40 9 6 3 19 2 5 98 195
Travel & Entertainment 184 148 70 80 5 20 10 10 223 750
Consulting 190 27 217
IT Expense 54 54
Office Expense 158 158
Recruiting 30 54 84
Postage
Equipment Leases 65 65
Education & Training 31 31
Bank Charges 70 70
Other 12 12
Total SG&A 198 188 109 86 8 229 12 15 1237 2082
Total Expenses 2274 1813 845 713 507 1562 152 517 3139 11523
EBITDA 5130 3123 -845 -713 -507 -1562 -152 -829 -3139 505
Non-Operating
Taxes
Net Interest 523 523
Depreciation/Amortzation 233 233
Other 71 71
Total Non-Operating 827 827
Net Income (Loss) 5130 3123 -845 -713 -507 -1562 -152 -829 -3966 -322
Monthly Budget - Administration January February March April May June July August September October November December Full Year
Revenue
Total Software Revenue
Total Data Revenue
Total Revenue
Cost of Goods Sold
Cost of Sales
Other
Total Cost of Goods Sold
Total Gross Profit
Margin %
Expenses
Payroll
Salaries 89 89 88 95 95 115 93 93 93 93 93 93 1128
Payroll Taxes 9 9 9 10 10 11 10 8 8 7 7 5 103
Benefits 5 5 5 6 6 8 8 8 8 8 8 8 85
Bonus
Comissions
Other
Total Payroll 103 103 102 111 111 134 111 109 109 108 108 107 1316
Marketing
Marketing
Total Marketing
Facilities
Rent 40 40 40 40 40 40 40 40 40 40 40 40 474
Utilities 9 9 9 9 9 9 6 6 6 6 6 6 91
Other 2 2 2 2 2 2 1 1 1 1 1 1 21
Total Facilities 50 50 50 50 50 50 47 47 47 47 47 47 586
SG&A
Dues & Subscriptions 1 1 1 1 1 1 1 1 1 1 1 1 6
Insurance 11 11 11 11 11 11 11 11 11 11 11 11 128
Accounting 16 16 16 16 16 16 16 16 16 16 16 16 186
Legal 11 11 11 11 11 11 11 11 11 11 11 11 126
Telephone & Internet 8 8 8 8 8 8 8 8 8 8 8 8 98
Travel & Entertainment 40 15 30 15 15 15 15 15 15 15 15 15 223
Consulting 2 2 2 2 2 2 2 2 2 2 2 2 27
IT Expense 5 5 5 5 5 5 5 5 5 5 5 5 54
Office Expense 13 13 13 13 13 13 13 13 13 13 13 13 158
Recruiting 5 5 5 5 5 5 5 5 5 5 5 5 54
Postage
Equipment Leases 5 5 5 5 5 5 5 5 5 5 5 5 65
Education & Training 3 3 3 3 3 3 3 3 3 3 3 3 31
Bank Charges 6 6 6 6 6 6 6 6 6 6 6 6 70
Other 1 1 1 1 1 1 1 1 1 1 1 1 12
Total SG&A 125 100 115 100 100 100 100 100 100 100 100 100 1237
Total Expenses 278 253 267 261 261 285 258 256 256 255 255 254 3139
EBITDA -278 -253 -267 -261 -261 -285 -258 -256 -256 -255 -255 -254 -3139
Non-Operating
Taxes
Net Interest 43 43 43 43 43 43 44 44 44 44 44 44 523
Depreciation/Amortzation 17 17 17 19 19 19 20 20 20 22 22 22 233
Other 8 3 3 3 3 3 8 8 8 8 8 8 71
Total Non-Operating 68 63 63 65 65 65 72 72 72 74 74 74 827
Net Income (Loss) -347 -317 -331 -326 -326 -350 -330 -328 -328 -329 -329 -327 -3966
Monthly Budget - Client Operations Total January February March April May June July August September October November December Full Year
Revenue
Total Software Revenue
Total Data Revenue
Total Revenue
Cost of Goods Sold
Cost of Sales
Other
Total Cost of Goods Sold
Total Gross Profit
Margin % #DIV/0! #DIV/0! #DIV/0! #DIV/0! #DIV/0! #DIV/0! #DIV/0! #DIV/0! #DIV/0! #DIV/0! #DIV/0! #DIV/0! #DIV/0!
Expenses
Payroll
Salaries 72 79 85 89 96 96 103 103 103 103 103 103 1138
Payroll Taxes 11 11 12 12 12 12 12 12 12 12 12 11 141
Benefits 7 7 7 7 7 7 7 7 7 7 7 7 84
Bonus
Comissions
Other
Total Payroll 90 97 104 108 115 115 122 122 122 122 122 122 1363
Marketing
Marketing
Total Marketing
Facilities
Rent
Utilities
Other
Total Facilities
SG&A
Dues & Subscriptions
Insurance
Accounting
Legal
Telephone & Internet 1 1 1 1 1 1 1 1 1 1 1 1 15
Travel & Entertainment 13 13 13 13 13 13 13 13 13 13 13 13 150
Consulting
IT Expense
Office Expense
Recruiting 30 30
Postage
Equipment Leases
Education & Training
Bank Charges
Other
Total SG&A 13 13 44 14 14 14 14 14 14 14 14 14 195
Total Expenses 104 110 148 122 129 129 136 136 136 136 136 136 1558
EBITDA -104 -110 -148 -122 -129 -129 -136 -136 -136 -136 -136 -136 -1558
Non-Operating
Taxes
Net Interest
Depreciation/Amortzation
Other
Total Non-Operating
Net Income (Loss) -104 -110 -148 -122 -129 -129 -136 -136 -136 -136 -136 -136 -1558
Monthly Budget - Client Ops - US January February March April May June July August September October November December Full Year
Revenue
Total Software Revenue
Total Data Revenue
Total Revenue
Cost of Goods Sold
Cost of Sales
Other
Total Cost of Goods Sold
Total Gross Profit
Margin % #DIV/0! #DIV/0! #DIV/0! #DIV/0! #DIV/0! #DIV/0! #DIV/0! #DIV/0! #DIV/0! #DIV/0! #DIV/0! #DIV/0! #DIV/0!
Expenses
Payroll
Salaries 43 43 49 53 53 53 53 53 53 53 53 53 608
Payroll Taxes 4 4 4 4 4 4 4 4 4 4 4 4 50
Benefits 6 6 7 7 7 7 7 7 7 7 7 7 78
Bonus
Comissions
Other
Total Payroll 52 52 60 64 64 64 64 64 64 64 64 63 736
Marketing
Marketing
Total Marketing
Facilities
Rent
Utilities
Other
Total Facilities
SG&A
Dues & Subscriptions
Insurance
Accounting
Legal
Telephone & Internet 1 1 1 1 1 1 1 1 1 1 1 1 9
Travel & Entertainment 6 6 6 6 6 6 6 6 6 6 6 6 70
Consulting
IT Expense
Office Expense
Recruiting 30 30
Postage
Equipment Leases
Education & Training
Bank Charges
Other
Total SG&A 6 6 37 7 7 7 7 7 7 7 7 7 109
Total Expenses 59 59 96 70 70 70 70 70 70 70 70 70 845
EBITDA -59 -59 -96 -70 -70 -70 -70 -70 -70 -70 -70 -70 -845
Non-Operating
Taxes
Net Interest
Depreciation/Amortzation
Other
Total Non-Operating
Net Income (Loss) -59 -59 -96 -70 -70 -70 -70 -70 -70 -70 -70 -70 -845
Monthly Budget - Client Ops EU January February March April May June July August September October November December Full Year
Revenue
Total Software Revenue
Total Data Revenue
Total Revenue
Cost of Goods Sold
Cost of Sales
Other
Total Cost of Goods Sold
Total Gross Profit
Margin % #DIV/0! #DIV/0! #DIV/0! #DIV/0! #DIV/0! #DIV/0! #DIV/0! #DIV/0! #DIV/0! #DIV/0! #DIV/0! #DIV/0! #DIV/0!
Expenses
Payroll
Salaries 30 36 36 36 44 44 51 51 51 51 51 51 530
Payroll Taxes 8 8 8 8 8 8 8 8 8 8 8 8 91
Benefits 1 1 1 1 1 1 1 1 6
Bonus
Comissions
Other
Total Payroll 38 45 45 45 52 52 59 59 59 59 59 59 627
Marketing
Marketing
Total Marketing
Facilities
Rent
Utilities
Other
Total Facilities
SG&A
Dues & Subscriptions
Insurance
Accounting
Legal
Telephone & Internet 1 1 1 1 1 1 6
Travel & Entertainment 7 7 7 7 7 7 7 7 7 7 7 7 80
Consulting
IT Expense
Office Expense
Recruiting
Postage
Equipment Leases
Education & Training
Bank Charges
Other
Total SG&A 7 7 7 7 7 7 7 7 7 7 7 7 86
Total Expenses 45 52 52 52 59 59 66 66 66 66 66 66 713
EBITDA -45 -52 -52 -52 -59 -59 -66 -66 -66 -66 -66 -66 -713
Non-Operating
Taxes
Net Interest
Depreciation/Amortzation
Other
Total Non-Operating
Net Income (Loss) -45 -52 -52 -52 -59 -59 -66 -66 -66 -66 -66 -66 -713
Monthly Budget - Sales Total January February March April May June July August September October November December Full Year
Revenue
Total Software Revenue 310 310 327 327 350 400 424 442 483 490 541 612 5017
Total Data Revenue 569 701 531 403 422 809 596 596 596 630 733 897 7483
Total Revenue 879 1011 858 730 772 1209 1020 1037 1078 1120 1275 1509 12500
Cost of Goods Sold
Cost of Sales
Other 10 10 10 10 10 10 17 17 17 17 17 17 160
Total Cost of Goods Sold 10 10 10 10 10 10 17 17 17 17 17 17 160
Total Gross Profit 869 1001 848 720 762 1199 1004 1021 1062 1104 1258 1492 12340
Margin %
Expenses
Payroll
Salaries 169 159 187 227 227 237 244 244 239 239 239 239 2652
Payroll Taxes 14 14 15 18 18 20 20 18 18 17 16 16 204
Benefits 8 8 9 12 13 14 15 15 15 15 15 15 156
Bonus
Comissions 15 26 39 42 46 59 64 65 69 75 86 104 690
Other
Total Payroll 207 207 249 300 304 330 343 343 341 346 356 374 3702
Marketing
Marketing
Total Marketing
Facilities
Rent
Utilities
Other
Total Facilities
SG&A
Dues & Subscriptions
Insurance
Accounting
Legal
Telephone & Internet 4 4 4 5 5 5 4 4 4 4 4 4 53
Travel & Entertainment 23 23 25 28 28 28 30 30 30 30 30 30 333
Consulting
IT Expense
Office Expense
Recruiting
Postage
Equipment Leases
Education & Training
Bank Charges
Other
Total SG&A 27 27 30 32 32 33 34 34 34 34 34 34 385
Total Expenses 234 234 279 333 337 363 377 377 375 380 390 408 4088
EBITDA 635 768 569 387 425 835 626 644 686 724 868 1084 8252
Non-Operating
Taxes
Net Interest
Depreciation/Amortzation
Other
Total Non-Operating
Net Income (Loss) 635 768 569 387 425 835 626 644 686 724 868 1084 8252
Monthly Budget - Sales US January February March April May June July August September October November December Full Year
Total Retail Jobs
Revenue
Software
iPlan 72 72 72 60 60 60 60 60 51 51 51 51 724
iLeader 9 9 9 9 9 9 9 9 7 7 7 7 96
iMarket 90 84 80 80 80 80 80 80 80 55 53 49 892
Other 15 21 35 47 61 91 106 116 151 181 213 260 1298
Total Software Revenue 186 186 196 196 210 240 255 265 290 294 325 367 3010
Data
R&D Cube
iBlkship 287 84 98 468
iAccess 58 58
iOpinion 136 99 234
iField
Other 55 201 220 242 253 330 357 357 358 378 440 538 3730
Total Data Revenue 342 421 319 242 253 485 357 357 358 378 440 538 4490
Total Revenue 528 607 515 438 463 725 612 622 647 672 765 905 7500
Cost of Goods Sold
Cost of Sales
Other 6 6 6 6 6 6 10 10 10 10 10 10 96
Total Cost of Goods Sold 6 6 6 6 6 6 10 10 10 10 10 10 96
Total Gross Profit 522 601 509 432 457 719 602 612 637 662 755 895 7404
Margin %
Expenses
Payroll
Salaries 74 64 83 123 123 123 140 140 140 140 140 140 1431
Payroll Taxes 6 5 7 10 10 10 12 9 9 9 8 8 103
Benefits 6 6 7 10 11 12 13 13 13 13 13 13 130
Bonus
Comissions 24 31 25 20 22 41 33 34 37 40 47 58 412
Other
Total Payroll 110 106 121 164 167 187 198 197 199 202 208 219 2077
Marketing
Marketing
Total Marketing
Facilities
Rent
Utilities
Other
Total Facilities
SG&A
Dues & Subscriptions
Insurance
Accounting
Legal
Telephone & Internet 1 1 1 1 1 1 1 1 1 1 1 1 13
Travel & Entertainment 10 10 13 15 15 15 18 18 18 18 18 18 184
Consulting
IT Expense
Office Expense
Recruiting
Postage
Equipment Leases
Education & Training
Bank Charges
Other
Total SG&A 11 11 14 16 16 16 19 19 19 19 19 19 198
Total Expenses 121 117 135 180 183 203 216 215 218 221 227 237 2274
EBITDA 400 484 374 252 274 516 386 397 419 441 528 658 5130
Non-Operating
Taxes
Net Interest
Depreciation/Amortzation
Other
Total Non-Operating
Net Income (Loss) 400 484 374 252 274 516 386 397 419 441 528 658 5130
Monthly Budget - Sales EU January February March April May June July August September October November December Full Year
Total Retail Jobs
Revenue
Software
iPlan 48 48 48 40 40 40 40 40 34 34 34 34 482
iLeader 6 6 6 6 6 6 6 6 5 5 5 5 64
iMarket 60 56 53 53 53 53 53 53 53 37 36 33 595
Other 10 14 23 32 41 61 71 77 101 121 142 173 865
Total Software Revenue 124 124 131 131 140 160 170 177 193 196 217 245 2007
Data
R&D Cube
iBlkship 191 56 65 312
iAccess 38 38
iOpinion 90 66 156
iField
Other 37 134 147 161 169 220 238 238 238 252 293 359 2486
Total Data Revenue 228 280 212 161 169 323 238 238 238 252 293 359 2993
Total Revenue 352 405 343 292 309 483 408 415 431 448 510 604 5000
Cost of Goods Sold
Cost of Sales
Other 4 4 4 4 4 4 7 7 7 7 7 7 64
Total Cost of Goods Sold 4 4 4 4 4 4 7 7 7 7 7 7 64
Total Gross Profit 348 401 339 288 305 479 401 408 425 442 503 597 4936
Margin %
Expenses
Payroll
Salaries 95 95 104 104 104 114 104 104 99 99 99 99 1221
Payroll Taxes 8 8 8 8 8 10 8 8 8 8 8 8 101
Benefits 2 2 2 2 2 2 2 2 2 2 2 2 25
Bonus
Comissions -8 -5 14 22 23 18 31 31 33 34 39 46 278
Other
Total Payroll 97 101 128 136 138 144 146 146 142 144 148 156 1625
Marketing
Marketing
Total Marketing
Facilities
Rent
Utilities
Other
Total Facilities
SG&A
Dues & Subscriptions
Insurance
Accounting
Legal
Telephone & Internet 4 4 4 4 4 4 3 3 3 3 3 3 40
Travel & Entertainment 13 13 13 13 13 13 12 12 12 12 12 12 148
Consulting
IT Expense
Office Expense
Recruiting
Postage
Equipment Leases
Education & Training
Bank Charges
Other
Total SG&A 16 16 16 16 16 17 15 15 15 15 15 15 188
Total Expenses 113 117 144 152 154 160 161 162 157 159 163 171 1813
EBITDA 235 284 195 136 151 319 240 247 267 283 340 426 3123
Non-Operating
Taxes
Net Interest
Depreciation/Amortzation
Other
Total Non-Operating
Net Income (Loss) 235 284 195 136 151 319 240 247 267 283 340 426 3123
Budget Yr Sales (SA) - Monthly 9/18/2013
Monthly Budget - Technology January February March April May June July August September October November December Full Year
Revenue
Software Technology
Data Consulting
Total Revenue
Cost of Goods Sold
Cost of Sales
Other
Total Cost of Goods Sold
Total Gross Profit
Margin % #DIV/0! #DIV/0! #DIV/0! #DIV/0! #DIV/0! #DIV/0! #DIV/0! #DIV/0! #DIV/0! #DIV/0! #DIV/0! #DIV/0! #DIV/0!
Expenses
Payroll
Salaries 88 88 100 100 100 109 98 98 98 98 98 98 1170
Payroll Taxes 9 9 10 10 10 10 10 10 10 10 9 9 114
Benefits 3 3 4 4 4 4 4 4 4 4 4 4 49
Bonus
Comissions
Other
Total Payroll 100 100 114 114 114 123 112 112 112 112 111 111 1333
Marketing
Marketing
Total Marketing
Facilities
Rent
Utilities
Other
Total Facilities
SG&A
Dues & Subscriptions
Insurance
Accounting
Legal
Telephone & Internet 2 2 2 2 2 2 2 2 2 2 2 2 19
Travel & Entertainment 2 2 2 2 2 2 2 2 2 2 2 2 20
Consulting 10 20 20 20 20 20 20 20 20 20 190
IT Expense
Office Expense
Recruiting
Postage
Equipment Leases
Education & Training
Bank Charges
Other
Total SG&A 3 3 13 23 23 23 23 23 23 23 23 23 229
Total Expenses 103 103 127 137 137 147 135 135 135 135 134 134 1562
EBITDA -103 -103 -127 -137 -137 -147 -135 -135 -135 -135 -134 -134 -1562
Non-Operating
Taxes
Net Interest
Depreciation/Amortzation
Other
Total Non-Operating
Net Income (Loss) -103 -103 -127 -137 -137 -147 -135 -135 -135 -135 -134 -134 -1562
Budget Yr Technology - Monthly 9/18/2013
Monthly Budget - Information Research January February March April May June July August September October November December Full Year
Revenue
Total Software Revenue -$ -$ -$ -$ -$ -$ -$ -$ -$ -$ -$ -$ -$
Total Data Revenue -$ -$ -$ -$ -$ -$ -$ -$ -$ -$ -$ -$ -$
Total Revenue -$ -$ -$ -$ -$ -$ -$ -$ -$ -$ -$ -$ -$
Cost of Goods Sold
Cost of Sales -$ -$ -$ -$ -$ -$ -$ -$ -$ -$ -$ -$ -$
Other 26,000 26,000 26,000 26,000 26,000 26,000 26,000 26,000 26,000 26,000 26,000 26,000 312,000
Total Cost of Goods Sold 26,000$ 26,000$ 26,000$ 26,000$ 26,000$ 26,000$ 26,000$ 26,000$ 26,000$ 26,000$ 26,000$ 26,000$ 312,000$
Total Gross Profit (26,000)$ (26,000)$ (26,000)$ (26,000)$ (26,000)$ (26,000)$ (26,000)$ (26,000)$ (26,000)$ (26,000)$ (26,000)$ (26,000)$ (312,000)$
Margin % #DIV/0! #DIV/0! #DIV/0! #DIV/0! #DIV/0! #DIV/0! #DIV/0! #DIV/0! #DIV/0! #DIV/0! #DIV/0! #DIV/0! #DIV/0!
Expenses
Payroll
Salaries 33,458$ 33,458$ 36,458$ 33,558$ 33,558$ 33,558$ 33,558$ 33,558$ 33,558$ 33,558$ 33,558$ 33,558$ 405,398$
Payroll Taxes 7,404 7,404 7,454 7,470 7,470 7,470 7,470 7,470 7,470 7,470 7,470 7,470 89,495
Benefits 317 317 574 659 659 659 659 659 659 659 659 659 7,139
Bonus - - - - - - - - - - - - -
Comissions - - - - - - - - - - - - -
Other - Odesk - - - - - - - - - - - - -
Total Payroll 41,179$ 41,179$ 44,485$ 41,688$ 41,688$ 41,688$ 41,688$ 41,688$ 41,688$ 41,688$ 41,688$ 41,688$ 502,032$
Marketing
Marketing - - - - - - - - - - - - -
Total Marketing -$ -$ -$ -$ -$ -$ -$ -$ -$ -$ -$ -$ -$
Facilities
Rent -$ -$ -$ -$ -$ -$ -$ -$ -$ -$ -$ -$ -$
Utilities - - - - - - - - - - - - -
Other - - - - - - - - - - - - -
Total Facilities -$ -$ -$ -$ -$ -$ -$ -$ -$ -$ -$ -$ -$
SG&A
Dues & Subscriptions -$ -$ -$ -$ -$ -$ -$ -$ -$ -$ -$ -$ -$
Insurance - - - - - - - - - - - - -
Accounting - - - - - - - - - - - - -
Legal - - - - - - - - - - - - -
Telephone & Internet 435 435 435 375 375 375 375 375 375 375 375 375 4,680
Travel & Entertainment 833 833 833 833 833 833 833 833 833 833 833 833 10,000
Consulting - - - - - - - - - - - - -
IT Expense - - - - - - - - - - - - -
Office Expense - - - - - - - - - - - - -
Recruiting - - - - - - - - - - - - -
Postage - - - - - - - - - - - - -
Equipment Leases - - - - - - - - - - - - -
Education & Training - - - - - - - - - - - - -
Bank Charges - - - - - - - - - - - - -
Other - - - - - - - - - - - - -
Total SG&A 1,268$ 1,268$ 1,268$ 1,208$ 1,208$ 1,208$ 1,208$ 1,208$ 1,208$ 1,208$ 1,208$ 1,208$ 14,680$
Total Expenses 42,447$ 42,447$ 45,754$ 42,896$ 42,896$ 42,896$ 42,896$ 42,896$ 42,896$ 42,896$ 42,896$ 42,896$ 516,712$
EBITDA (68,447)$ (68,447)$ (71,754)$ (68,896)$ (68,896)$ (68,896)$ (68,896)$ (68,896)$ (68,896)$ (68,896)$ (68,896)$ (68,896)$ (828,712)$
Non-Operating
Taxes -$ -$ -$ -$ -$ -$ -$ -$ -$ -$ -$ -$ -
Net Interest - - - - - - - - - - - - -
Depreciation/Amortzation - - - - - - - - - - - - -
Other - - - - - - - - - - - - -
Total Non-Operating -$ -$ -$ -$ -$ -$ -$ -$ -$ -$ -$ -$ -$
Net Income (Loss) (68,447)$ (68,447)$ (71,754)$ (68,896)$ (68,896)$ (68,896)$ (68,896)$ (68,896)$ (68,896)$ (68,896)$ (68,896)$ (68,896)$ (828,712)$
Monthly Budget - BPO Services January February March April May June July August September October November December Full Year
Revenue
Total Software Revenue
Total Data Revenue
Total Revenue
Cost of Goods Sold
Cost of Sales
Other
Total Cost of Goods Sold
Total Gross Profit
Margin % #DIV/0! #DIV/0! #DIV/0! #DIV/0! #DIV/0! #DIV/0! #DIV/0! #DIV/0! #DIV/0! #DIV/0! #DIV/0! #DIV/0! #DIV/0!
Expenses
Payroll
Salaries 10 10 10 10 10 10 10 10 10 10 10 10 116
Payroll Taxes 1 1 1 1 1 1 1 1 1 1 1 1 16
Benefits 1 1 1 1 1 1 1 1 1 1 1 1 8
Bonus
Comissions
Other
Total Payroll 12 12 12 12 12 12 12 12 12 12 12 12 140
Marketing
Marketing
Total Marketing
Facilities
Rent
Utilities
Other
Total Facilities
SG&A
Dues & Subscriptions
Insurance
Accounting
Legal
Telephone & Internet 2
Travel & Entertainment 1 1 1 1 1 1 1 1 1 1 1 1 10
Consulting
IT Expense
Office Expense
Recruiting
Postage
Equipment Leases
Education & Training
Bank Charges
Other
Total SG&A 1 1 1 1 1 1 1 1 1 1 1 1 12
Total Expenses 13 13 13 13 13 13 13 13 13 13 13 13 152
EBITDA -13 -13 -13 -13 -13 -13 -13 -13 -13 -13 -13 -13 -152
Non-Operating
Taxes
Net Interest
Depreciation/Amortzation
Other
Total Non-Operating
Net Income (Loss) -13 -13 -13 -13 -13 -13 -13 -13 -13 -13 -13 -13 -152
Budget Yr BPO Services - Monthly 9/18/2013
New Business January February March April May June July AugustSeptemberOctoberNovemberDecemberFull Year
Pipe Line
1 Year -
3 Year
3 Months
New Business - Projection
1 Year 150 210 240 210 240 450 285 240 450 312 375 810 3973
3 Year 75 105 120 105 120 225 143 120 225 312 375 375 2300
3 Months 275 385 440 385 440 825 523 440 825 625 750 1315 7227
500 700 800 700 800 1500 950 800 1500 1250 1500 2500 13500
Total
1 Year 150 210 240 210 240 450 285 240 450 312 375 810 3973
3 Year 75 105 120 105 120 225 143 120 225 312 375 375 2300
3 Months 275 385 440 385 440 825 523 440 825 625 750 1315 7227
500 700 800 700 800 1500 950 800 1500 1250 1500 2500 13500
Billing January February March April May June July AugustSeptemberOctoberNovemberDecemberFull Year
1 Year 60 60 30 150
84 84 42 210
96 96 48 240
84 84 42 210
96 96 48 240
180 180 90 450
114 114 285
96 96 240
180 180 450
125 312
150 375
324 810
60 84 96 144 180 276 228 234 408 281 294 594 3973
3 Year 10 10 5 75
14 14 7 105
16 16 8 120
14 14 7 105
16 16 8 120
30 30 15 225
19 19 143
16 16 120
30 30 225
42 312
50 375
50 375
10 14 16 24 30 46 38 39 68 68 74 95 2300
3 Month 92 183 275
128 257 385
147 293 440
128 257 385
147 293 440
275 550 825
174 348 523
147 293 440
275 550 825
208 625
250 750
438 1315
92 128 147 312 403 568 431 440 825 557 543 988 7227
NB Billing 162 226 259 480 613 890 697 713 1301 905 911 1677 8835
NB Collection 81 194 243 369 546 752 794 705 1007 1103 908 6702
BackLog Collection 1321 620 916 399 183 328 270 332 118 44 427 70 5029
BackLog Billing 355 657 291 255 299 301 225 81 236 249 99 129 3178
Accounts Receivable January February March April May June July August September October NovemberDecember Full Year
Opening Balance 2044 1239 1422 862 956 1316 1633 1533 1202 1915 2018 1498 2044
Total Billing 516 884 549 735 912 1191 922 794 1537 1154 1010 1807 12012
Total Collection 1321 701 1110 641 552 875 1022 1126 823 1051 1530 979 11730
AR Balance 1239 1422 862 956 1316 1633 1533 1202 1915 2018 1498 2326 2326
Cash Flow Extract January February March April May June July August September October November December
Cash from or used in operating activities
Receipts for Customer 1321 701 1110 641 552 875 1022 1126 823 1051 1530 979
Other Receipts
Less
Payroll Less Comm -495 -484 -523 -576 -569 -619 -589 -578 -573 -571 -570 -568
Commission -34 -36 -50 -44 -48 -84 -68 -67 -86 -85 -108 -130
Facilities Expenes -50 -50 -50 -50 -50 -50 -47 -47 -47 -47 -47 -47
Cost of Sales -140 -146 -184 -158 -165 -165 -179 -179 -179 -179 -179 -178
Accounts Payable -150 -150 -180 -242 -188 -188 -188 -188 -188 -188 -188 -188
Interest to Finance Institution -113 -115 -116 -116
Net Operating Cash Flow 452 -166 9 -429 -469 -346 -49 66 -365 -19 438 -249
Financing Activities
Short-Term Loan Payment
Capital Expenditure -25 -25 -50
Net Cash from Financing -25 -25 -50
Net Cash Flow 452 -166 -16 -429 -469 -371 -49 66 -415 -19 438 -249
Add:Opening Balance 59 510 345 328 -101 -569 -940 -989 -923 -1338 -1358 -920
Closing Balance 510 345 328 -101 -569 -940 -989 -923 -1338 -1358 -920 -1169
Deferred Revenue January February March April May June July August September October November December Full Year
963
Opening 963 601 473 164 169 310 292 194 -49 409 443 178 12012
Add:Billing 516 884 549 735 912 1191 922 794 1537 1154 1010 1807 12500
Less:Revenue 879 1011 858 730 772 1209 1020 1037 1078 1120 1275 1509 476
Closing Balance 601 473 164 169 310 292 194 -49 409 443 178 476
Accounts Payable January February March April May June July August September October November December Full Year
524
Opening 524 553 552 550 477 463 442 439 419 401 381 361 1887
Add:S G & A 158 133 161 158 158 159 160 160 160 160 160 160 86
Marketing 13 13 14 8 13 4 17 3 1 71
Other 8 3 3 3 3 3 8 8 8 8 8 8 2226
Less:Payments 150 150 180 242 188 188 188 188 188 188 188 188 341
Closing Balance 553 552 550 477 463 442 439 419 401 381 361 341
Interest Expenes January February March April May June July August September October November December Full Year
Opening Balance 38 76 38 76 39 77 39 78 374
Add:Expenses 31 31 31 31 31 31 32 32 32 32 32 32 62
Less: PIK 5 5 5 5 5 5 5 5 5 5 5 5 23
Add: Silent Partner (1) 2 2 2 2 2 2 2 2 2 2 2 2 126
Add: Silent Partner (2) 10 10 10 10 10 10 10 10 10 10 10 10 460
Less:Payments 113 115 116 116
Closing Balance Payable 38 76 38 76 39 77 39 78
Investment Partners January February March April May June July August September October November December Full Year
3052
Opening Balance 3052 3057 3062 3067 3073 3078 3083 3088 3093 3099 3104 3109 62
Add:PIK 5 5 5 5 5 5 5 5 5 5 5 5
Less:Payments 3115
Closing Balance 3057 3062 3067 3073 3078 3083 3088 3093 3099 3104 3109 3115
Balance Sheet Dec-12 January February March April May June July August September October November December
ASSETS
Current Assets
Cash and Cash Equivalents 59 510 345 328 -101 -569 -940 -989 -923 -1338 -1358 -920 -1169
Accounts Receivable 2044 1239 1422 862 956 1316 1633 1533 1202 1915 2018 1498 2326
Deferred Commission 86 108 135 156 166 181 234 242 236 279 299 325 408
Other Assets 670 670 670 670 670 670 670 670 670 670 670 670 670
Total Current Assets 2859 2528 2571 2016 1691 1597 1597 1455 1185 1526 1629 1573 2235
Property and Equipment, HW/SW Net 1537 1520 1502 1510 1491 1473 1479 1459 1439 1469 1447 1426 1404
Intangible Assets, Net 8045 8045 8045 8045 8045 8045 8045 8045 8045 8045 8045 8045 8045
Security Deposits 110 110 110 110 110 110 110 110 110 110 110 110 110
TOTAL ASSETS 12551 12203 12229 11682 11338 11226 11231 11070 10779 11150 11231 11154 11795
LIABILITIES AND STOCKHOLDERS' EQUITY
Liabilities
Current Liabilities
Accounts Payable 524 553 552 550 477 463 442 439 419 401 381 361 341
Accrued Commission 87 90 107 116 125 137 165 169 162 189 198 202 260
Accrued Expenses/Provisions & Other Liabilities736 774 812 736 775 813 736 775 814 736 775 814 736
Notes Payable 356 356 356 356 356 356 356 356 356 356 356 356 356
Deferred Revenue 963 601 473 164 169 310 292 194 -49 409 443 178 476
Total Current Liabilities 2666 2374 2300 1923 1901 2078 1992 1933 1701 2092 2153 1910 2169
Capitalized Lease Obligations 7 7 7 7 7 7 7 7 7 7 7 7 7
Loan Agreement - Silent Partnership 1875 1875 1875 1875 1875 1875 1875 1875 1875 1875 1875 1875 1875
Long Term Debt 3052 3057 3062 3067 3073 3078 3083 3088 3093 3099 3104 3109 3115
Total Liabilities 7600 7313 7244 6873 6856 7038 6957 6903 6677 7073 7139 6902 7166
Stockholders' Equity
Stocks 10250 10250 10250 10250 10250 10250 10250 10250 10250 10250 10250 10250 10250
Additional Paid In Capital
Accumulated Deficit -2295 -4954 -4954 -4954 -4954 -4954 -4954 -4954 -4954 -4954 -4954 -4954 -4954
Fiscal YTD Income (Deficit) -2659 -61 34 -142 -469 -763 -676 -784 -849 -873 -858 -699 -322
Other Comprehensive Income -
Foreign Currency Translation
Difference -345 -345 -345 -345 -345 -345 -345 -345 -345 -345 -345 -345 -345
Total Stockholders' Equity 4951 4890 4985 4809 4481 4187 4274 4166 4102 4077 4092 4252 4629
TOTAL LIABILITIES AND STOCKHOLDERS' EQUITY12551 12203 12229 11682 11338 11226 11231 11070 10779 11150 11231 11154 11795
Cash Flow Dec-12 January February March April May June July August September October November December Full Year
NET INCOME 209 -61 95 -176 -328 -294 87 -108 -64 -25 15 159 377 -322
Add: Non-Cash Expenses -269 17 17 17 19 19 19 20 20 20 22 22 22 233
(Depreciation, Amortization, etc)
Add: Working Capital -206 490 -283 162 -125 -198 -457 34 105 -366 -61 252 -653 -1101
Cash from Operating Activities -267 447 -171 4 -434 -474 -351 -54 61 -371 -24 433 -254 -1190
Capital Expenditure
Sale of Fixed Assets
Cash from Investing Activies
Invested Capital 5 5 5 5 5 5 5 5 5 5 5 5 62
Other 193 -25 -25 -50 -100
Cash from Financing Activies 193 5 5 -20 5 5 -20 5 5 -45 5 5 5 -38
Beginning Cash Balance 133 59 510 345 328 -101 -569 -940 -989 -923 -1338 -1358 -920 59
Net Cash Flow -74 452 -166 -16 -429 -469 -371 -49 66 -415 -19 438 -249 -1227
Ending Cash Balance 59 510 345 328 -101 -569 -940 -989 -923 -1338 -1358 -920 -1169 -1169

Mais conteúdo relacionado

Destaque

Catalogo Digital - Naturisse
Catalogo Digital - NaturisseCatalogo Digital - Naturisse
Catalogo Digital - Naturissenaturisse
 
Sample pres for presentation demo
Sample pres for presentation demoSample pres for presentation demo
Sample pres for presentation demoEmily Stark
 
Landslides of disaster
Landslides of disasterLandslides of disaster
Landslides of disasterFairuz Raniah
 
Issues In The Media
Issues In The Media Issues In The Media
Issues In The Media aulonaism
 
Materi perilaku konsumen dan produsen
Materi perilaku konsumen dan produsen Materi perilaku konsumen dan produsen
Materi perilaku konsumen dan produsen Fairuz Raniah
 
Aviation english student's book
Aviation english student's bookAviation english student's book
Aviation english student's bookDiel Fernandes
 
Team OOF September Presentation
Team OOF September PresentationTeam OOF September Presentation
Team OOF September PresentationMyLocketMyStory
 
Situs hijau green marketing
Situs hijau   green marketingSitus hijau   green marketing
Situs hijau green marketingYuvita Dhita
 
calcium channel blockers
calcium channel blockerscalcium channel blockers
calcium channel blockersDocdhingra
 
Budget template
Budget templateBudget template
Budget templateKen Hicks
 
Advertising budgeting
Advertising budgetingAdvertising budgeting
Advertising budgetingNijaz N
 
Esl ebook-worksheets for beggining level
Esl ebook-worksheets for beggining levelEsl ebook-worksheets for beggining level
Esl ebook-worksheets for beggining levelDiel Fernandes
 
Sales budget & forecasting
Sales budget & forecastingSales budget & forecasting
Sales budget & forecastingAvinash Singh
 

Destaque (18)

SAP Basis
SAP BasisSAP Basis
SAP Basis
 
Catalogo Digital - Naturisse
Catalogo Digital - NaturisseCatalogo Digital - Naturisse
Catalogo Digital - Naturisse
 
Perfect
PerfectPerfect
Perfect
 
Sample pres for presentation demo
Sample pres for presentation demoSample pres for presentation demo
Sample pres for presentation demo
 
Linkedinsight-week4
Linkedinsight-week4Linkedinsight-week4
Linkedinsight-week4
 
Landslides of disaster
Landslides of disasterLandslides of disaster
Landslides of disaster
 
Activities super songs
Activities super songsActivities super songs
Activities super songs
 
Issues In The Media
Issues In The Media Issues In The Media
Issues In The Media
 
Materi perilaku konsumen dan produsen
Materi perilaku konsumen dan produsen Materi perilaku konsumen dan produsen
Materi perilaku konsumen dan produsen
 
Aviation english student's book
Aviation english student's bookAviation english student's book
Aviation english student's book
 
Team OOF September Presentation
Team OOF September PresentationTeam OOF September Presentation
Team OOF September Presentation
 
Situs hijau green marketing
Situs hijau   green marketingSitus hijau   green marketing
Situs hijau green marketing
 
calcium channel blockers
calcium channel blockerscalcium channel blockers
calcium channel blockers
 
IMC tools of Walton Bangladesh
IMC tools of Walton BangladeshIMC tools of Walton Bangladesh
IMC tools of Walton Bangladesh
 
Budget template
Budget templateBudget template
Budget template
 
Advertising budgeting
Advertising budgetingAdvertising budgeting
Advertising budgeting
 
Esl ebook-worksheets for beggining level
Esl ebook-worksheets for beggining levelEsl ebook-worksheets for beggining level
Esl ebook-worksheets for beggining level
 
Sales budget & forecasting
Sales budget & forecastingSales budget & forecasting
Sales budget & forecasting
 

Semelhante a Master Budget

SUPPLY CHAIN AND SOURCING_PROCUREMENT RAISING rev 2
SUPPLY CHAIN AND SOURCING_PROCUREMENT RAISING rev 2SUPPLY CHAIN AND SOURCING_PROCUREMENT RAISING rev 2
SUPPLY CHAIN AND SOURCING_PROCUREMENT RAISING rev 2Reinaldo Leopoldo
 
Seadrill Q1 2013 results presentation
Seadrill Q1 2013 results presentationSeadrill Q1 2013 results presentation
Seadrill Q1 2013 results presentationTradeWindsnews
 
Ppt 3 q15 en vfinal
Ppt 3 q15 en vfinalPpt 3 q15 en vfinal
Ppt 3 q15 en vfinalMagnesita_ri
 
Recommending a Strategy
Recommending a StrategyRecommending a Strategy
Recommending a StrategyBill Sims
 
Apresentação 3 q10
Apresentação    3 q10Apresentação    3 q10
Apresentação 3 q10Cia Hering RI
 
3Q 2015 Financial Results
3Q 2015 Financial Results 3Q 2015 Financial Results
3Q 2015 Financial Results Gruppo TIM
 
I phone 4s full Schematic Diagram
I phone 4s full Schematic DiagramI phone 4s full Schematic Diagram
I phone 4s full Schematic Diagramvipphone1 vipphone
 
iPhone 4s schematic
iPhone 4s schematiciPhone 4s schematic
iPhone 4s schematicPhonefix
 
iphone 4s full Schematic Diagram
iphone 4s full Schematic Diagramiphone 4s full Schematic Diagram
iphone 4s full Schematic Diagramdiyfix phone
 
I phone 4s full Schematic Diagram
I phone 4s full Schematic DiagramI phone 4s full Schematic Diagram
I phone 4s full Schematic Diagramdiyfix phone
 
Uniliver's financial modeling
Uniliver's financial modeling Uniliver's financial modeling
Uniliver's financial modeling Tooba Shafique
 
Conference Call 4Q14
Conference Call 4Q14Conference Call 4Q14
Conference Call 4Q14ItauRI
 
Gopika viswanath
Gopika viswanathGopika viswanath
Gopika viswanathgopika v
 
Presentations
PresentationsPresentations
PresentationsEucatexRI
 
Taxmann's CRACKER | Corporate & Economic Laws
Taxmann's CRACKER | Corporate & Economic LawsTaxmann's CRACKER | Corporate & Economic Laws
Taxmann's CRACKER | Corporate & Economic LawsTaxmann
 

Semelhante a Master Budget (20)

SUPPLY CHAIN AND SOURCING_PROCUREMENT RAISING rev 2
SUPPLY CHAIN AND SOURCING_PROCUREMENT RAISING rev 2SUPPLY CHAIN AND SOURCING_PROCUREMENT RAISING rev 2
SUPPLY CHAIN AND SOURCING_PROCUREMENT RAISING rev 2
 
RJ
RJRJ
RJ
 
Seadrill Q1 2013 results presentation
Seadrill Q1 2013 results presentationSeadrill Q1 2013 results presentation
Seadrill Q1 2013 results presentation
 
Ppt 3 q15 en vfinal
Ppt 3 q15 en vfinalPpt 3 q15 en vfinal
Ppt 3 q15 en vfinal
 
Ppt 3 q15 en v6
Ppt 3 q15 en v6Ppt 3 q15 en v6
Ppt 3 q15 en v6
 
Recommending a Strategy
Recommending a StrategyRecommending a Strategy
Recommending a Strategy
 
Apresentação 3 q10
Apresentação    3 q10Apresentação    3 q10
Apresentação 3 q10
 
3Q 2015 Financial Results
3Q 2015 Financial Results 3Q 2015 Financial Results
3Q 2015 Financial Results
 
I phone 4s full Schematic Diagram
I phone 4s full Schematic DiagramI phone 4s full Schematic Diagram
I phone 4s full Schematic Diagram
 
iPhone 4s schematic
iPhone 4s schematiciPhone 4s schematic
iPhone 4s schematic
 
iphone 4s full Schematic Diagram
iphone 4s full Schematic Diagramiphone 4s full Schematic Diagram
iphone 4s full Schematic Diagram
 
I phone 4s full Schematic Diagram
I phone 4s full Schematic DiagramI phone 4s full Schematic Diagram
I phone 4s full Schematic Diagram
 
Forecasting Assignment Help
Forecasting Assignment HelpForecasting Assignment Help
Forecasting Assignment Help
 
Uniliver's financial modeling
Uniliver's financial modeling Uniliver's financial modeling
Uniliver's financial modeling
 
Conference Call 4Q14
Conference Call 4Q14Conference Call 4Q14
Conference Call 4Q14
 
Qp nos-list-april
Qp nos-list-april Qp nos-list-april
Qp nos-list-april
 
Gopika viswanath
Gopika viswanathGopika viswanath
Gopika viswanath
 
Accelerate performance
Accelerate performanceAccelerate performance
Accelerate performance
 
Presentations
PresentationsPresentations
Presentations
 
Taxmann's CRACKER | Corporate & Economic Laws
Taxmann's CRACKER | Corporate & Economic LawsTaxmann's CRACKER | Corporate & Economic Laws
Taxmann's CRACKER | Corporate & Economic Laws
 

Último

PMFBY , Pradhan Mantri Fasal bima yojna
PMFBY , Pradhan Mantri  Fasal bima yojnaPMFBY , Pradhan Mantri  Fasal bima yojna
PMFBY , Pradhan Mantri Fasal bima yojnaDharmendra Kumar
 
INTERNATIONAL TRADE INSTITUTIONS[6].pptx
INTERNATIONAL TRADE INSTITUTIONS[6].pptxINTERNATIONAL TRADE INSTITUTIONS[6].pptx
INTERNATIONAL TRADE INSTITUTIONS[6].pptxaymenkhalfallah23
 
2024-04-09 - Pension Playpen roundtable - slides.pptx
2024-04-09 - Pension Playpen roundtable - slides.pptx2024-04-09 - Pension Playpen roundtable - slides.pptx
2024-04-09 - Pension Playpen roundtable - slides.pptxHenry Tapper
 
cost of capital questions financial management
cost of capital questions financial managementcost of capital questions financial management
cost of capital questions financial managementtanmayarora23
 
Uae-NO1 Black Magic Specialist In Lahore Black magic In Pakistan Kala Ilam Ex...
Uae-NO1 Black Magic Specialist In Lahore Black magic In Pakistan Kala Ilam Ex...Uae-NO1 Black Magic Specialist In Lahore Black magic In Pakistan Kala Ilam Ex...
Uae-NO1 Black Magic Specialist In Lahore Black magic In Pakistan Kala Ilam Ex...Amil baba
 
Uae-NO1 Pakistani Amil Baba Real Amil baba In Pakistan Najoomi Baba in Pakist...
Uae-NO1 Pakistani Amil Baba Real Amil baba In Pakistan Najoomi Baba in Pakist...Uae-NO1 Pakistani Amil Baba Real Amil baba In Pakistan Najoomi Baba in Pakist...
Uae-NO1 Pakistani Amil Baba Real Amil baba In Pakistan Najoomi Baba in Pakist...Amil baba
 
Banking: Commercial and Central Banking.pptx
Banking: Commercial and Central Banking.pptxBanking: Commercial and Central Banking.pptx
Banking: Commercial and Central Banking.pptxANTHONYAKINYOSOYE1
 
NO1 Certified kala jadu karne wale ka contact number kala jadu karne wale bab...
NO1 Certified kala jadu karne wale ka contact number kala jadu karne wale bab...NO1 Certified kala jadu karne wale ka contact number kala jadu karne wale bab...
NO1 Certified kala jadu karne wale ka contact number kala jadu karne wale bab...Amil baba
 
Guard Your Investments- Corporate Defaults Alarm.pdf
Guard Your Investments- Corporate Defaults Alarm.pdfGuard Your Investments- Corporate Defaults Alarm.pdf
Guard Your Investments- Corporate Defaults Alarm.pdfJasper Colin
 
Unit 4.1 financial markets operations .pdf
Unit 4.1 financial markets operations .pdfUnit 4.1 financial markets operations .pdf
Unit 4.1 financial markets operations .pdfSatyamSinghParihar2
 
Uae-NO1 Rohani Amil In Islamabad Amil Baba in Rawalpindi Kala Jadu Amil In Ra...
Uae-NO1 Rohani Amil In Islamabad Amil Baba in Rawalpindi Kala Jadu Amil In Ra...Uae-NO1 Rohani Amil In Islamabad Amil Baba in Rawalpindi Kala Jadu Amil In Ra...
Uae-NO1 Rohani Amil In Islamabad Amil Baba in Rawalpindi Kala Jadu Amil In Ra...Amil baba
 
Role of Information and technology in banking and finance .pptx
Role of Information and technology in banking and finance .pptxRole of Information and technology in banking and finance .pptx
Role of Information and technology in banking and finance .pptxNarayaniTripathi2
 
2024 Q1 Crypto Industry Report | CoinGecko
2024 Q1 Crypto Industry Report | CoinGecko2024 Q1 Crypto Industry Report | CoinGecko
2024 Q1 Crypto Industry Report | CoinGeckoCoinGecko
 
Overview of Inkel Unlisted Shares Price.
Overview of Inkel Unlisted Shares Price.Overview of Inkel Unlisted Shares Price.
Overview of Inkel Unlisted Shares Price.Precize Formely Leadoff
 
Money Forward Integrated Report “Forward Map” 2024
Money Forward Integrated Report “Forward Map” 2024Money Forward Integrated Report “Forward Map” 2024
Money Forward Integrated Report “Forward Map” 2024Money Forward
 
Stock Market Brief Deck FOR 4/17 video.pdf
Stock Market Brief Deck FOR 4/17 video.pdfStock Market Brief Deck FOR 4/17 video.pdf
Stock Market Brief Deck FOR 4/17 video.pdfMichael Silva
 
Uae-NO1 Kala Jadu specialist Expert in Pakistan kala ilam specialist Expert i...
Uae-NO1 Kala Jadu specialist Expert in Pakistan kala ilam specialist Expert i...Uae-NO1 Kala Jadu specialist Expert in Pakistan kala ilam specialist Expert i...
Uae-NO1 Kala Jadu specialist Expert in Pakistan kala ilam specialist Expert i...Amil baba
 
NO1 Certified Black Magic Specialist Expert In Bahawalpur, Sargodha, Sialkot,...
NO1 Certified Black Magic Specialist Expert In Bahawalpur, Sargodha, Sialkot,...NO1 Certified Black Magic Specialist Expert In Bahawalpur, Sargodha, Sialkot,...
NO1 Certified Black Magic Specialist Expert In Bahawalpur, Sargodha, Sialkot,...Amil baba
 
《加拿大本地办假证-寻找办理Dalhousie毕业证和达尔豪斯大学毕业证书的中介代理》
《加拿大本地办假证-寻找办理Dalhousie毕业证和达尔豪斯大学毕业证书的中介代理》《加拿大本地办假证-寻找办理Dalhousie毕业证和达尔豪斯大学毕业证书的中介代理》
《加拿大本地办假证-寻找办理Dalhousie毕业证和达尔豪斯大学毕业证书的中介代理》rnrncn29
 

Último (20)

PMFBY , Pradhan Mantri Fasal bima yojna
PMFBY , Pradhan Mantri  Fasal bima yojnaPMFBY , Pradhan Mantri  Fasal bima yojna
PMFBY , Pradhan Mantri Fasal bima yojna
 
INTERNATIONAL TRADE INSTITUTIONS[6].pptx
INTERNATIONAL TRADE INSTITUTIONS[6].pptxINTERNATIONAL TRADE INSTITUTIONS[6].pptx
INTERNATIONAL TRADE INSTITUTIONS[6].pptx
 
2024-04-09 - Pension Playpen roundtable - slides.pptx
2024-04-09 - Pension Playpen roundtable - slides.pptx2024-04-09 - Pension Playpen roundtable - slides.pptx
2024-04-09 - Pension Playpen roundtable - slides.pptx
 
cost of capital questions financial management
cost of capital questions financial managementcost of capital questions financial management
cost of capital questions financial management
 
Uae-NO1 Black Magic Specialist In Lahore Black magic In Pakistan Kala Ilam Ex...
Uae-NO1 Black Magic Specialist In Lahore Black magic In Pakistan Kala Ilam Ex...Uae-NO1 Black Magic Specialist In Lahore Black magic In Pakistan Kala Ilam Ex...
Uae-NO1 Black Magic Specialist In Lahore Black magic In Pakistan Kala Ilam Ex...
 
Uae-NO1 Pakistani Amil Baba Real Amil baba In Pakistan Najoomi Baba in Pakist...
Uae-NO1 Pakistani Amil Baba Real Amil baba In Pakistan Najoomi Baba in Pakist...Uae-NO1 Pakistani Amil Baba Real Amil baba In Pakistan Najoomi Baba in Pakist...
Uae-NO1 Pakistani Amil Baba Real Amil baba In Pakistan Najoomi Baba in Pakist...
 
Banking: Commercial and Central Banking.pptx
Banking: Commercial and Central Banking.pptxBanking: Commercial and Central Banking.pptx
Banking: Commercial and Central Banking.pptx
 
NO1 Certified kala jadu karne wale ka contact number kala jadu karne wale bab...
NO1 Certified kala jadu karne wale ka contact number kala jadu karne wale bab...NO1 Certified kala jadu karne wale ka contact number kala jadu karne wale bab...
NO1 Certified kala jadu karne wale ka contact number kala jadu karne wale bab...
 
Guard Your Investments- Corporate Defaults Alarm.pdf
Guard Your Investments- Corporate Defaults Alarm.pdfGuard Your Investments- Corporate Defaults Alarm.pdf
Guard Your Investments- Corporate Defaults Alarm.pdf
 
Unit 4.1 financial markets operations .pdf
Unit 4.1 financial markets operations .pdfUnit 4.1 financial markets operations .pdf
Unit 4.1 financial markets operations .pdf
 
Uae-NO1 Rohani Amil In Islamabad Amil Baba in Rawalpindi Kala Jadu Amil In Ra...
Uae-NO1 Rohani Amil In Islamabad Amil Baba in Rawalpindi Kala Jadu Amil In Ra...Uae-NO1 Rohani Amil In Islamabad Amil Baba in Rawalpindi Kala Jadu Amil In Ra...
Uae-NO1 Rohani Amil In Islamabad Amil Baba in Rawalpindi Kala Jadu Amil In Ra...
 
Role of Information and technology in banking and finance .pptx
Role of Information and technology in banking and finance .pptxRole of Information and technology in banking and finance .pptx
Role of Information and technology in banking and finance .pptx
 
2024 Q1 Crypto Industry Report | CoinGecko
2024 Q1 Crypto Industry Report | CoinGecko2024 Q1 Crypto Industry Report | CoinGecko
2024 Q1 Crypto Industry Report | CoinGecko
 
Overview of Inkel Unlisted Shares Price.
Overview of Inkel Unlisted Shares Price.Overview of Inkel Unlisted Shares Price.
Overview of Inkel Unlisted Shares Price.
 
Q1 2024 Newsletter | Financial Synergies Wealth Advisors
Q1 2024 Newsletter | Financial Synergies Wealth AdvisorsQ1 2024 Newsletter | Financial Synergies Wealth Advisors
Q1 2024 Newsletter | Financial Synergies Wealth Advisors
 
Money Forward Integrated Report “Forward Map” 2024
Money Forward Integrated Report “Forward Map” 2024Money Forward Integrated Report “Forward Map” 2024
Money Forward Integrated Report “Forward Map” 2024
 
Stock Market Brief Deck FOR 4/17 video.pdf
Stock Market Brief Deck FOR 4/17 video.pdfStock Market Brief Deck FOR 4/17 video.pdf
Stock Market Brief Deck FOR 4/17 video.pdf
 
Uae-NO1 Kala Jadu specialist Expert in Pakistan kala ilam specialist Expert i...
Uae-NO1 Kala Jadu specialist Expert in Pakistan kala ilam specialist Expert i...Uae-NO1 Kala Jadu specialist Expert in Pakistan kala ilam specialist Expert i...
Uae-NO1 Kala Jadu specialist Expert in Pakistan kala ilam specialist Expert i...
 
NO1 Certified Black Magic Specialist Expert In Bahawalpur, Sargodha, Sialkot,...
NO1 Certified Black Magic Specialist Expert In Bahawalpur, Sargodha, Sialkot,...NO1 Certified Black Magic Specialist Expert In Bahawalpur, Sargodha, Sialkot,...
NO1 Certified Black Magic Specialist Expert In Bahawalpur, Sargodha, Sialkot,...
 
《加拿大本地办假证-寻找办理Dalhousie毕业证和达尔豪斯大学毕业证书的中介代理》
《加拿大本地办假证-寻找办理Dalhousie毕业证和达尔豪斯大学毕业证书的中介代理》《加拿大本地办假证-寻找办理Dalhousie毕业证和达尔豪斯大学毕业证书的中介代理》
《加拿大本地办假证-寻找办理Dalhousie毕业证和达尔豪斯大学毕业证书的中介代理》
 

Master Budget

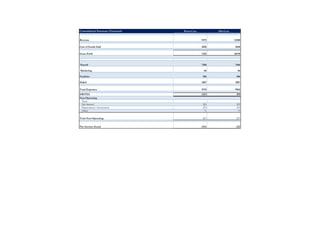
  • 1. Consolidated Summary Financials Worst-Case Mid-Case Revenue 9375 12500 Cost of Goods Sold 2030 2030 Gross Profit 7345 10470 Payroll 7200 7406 Marketing 86 86 Facilities 586 586 SG&A 1887 1887 Total Expenses 9759 9965 EBITDA -2414 505 Non-Operating Taxes Net Interest 523 523 Depreciation/Amortzation 233 233 Other 71 71 Total Non-Operating 827 827 Net Income (Loss) -3241 -322
  • 2. COGS: $2030 Payroll: $7406 Marketing: $86 Facilities: $586 S G& A $1887 EBIDA: $505 Dollar Distribution
  • 3. New Business January February March April May June July AugustSeptemberOctoberNovemberDecemberFull Year Pipe Line 1 Year - 3 Year 3 Months New Business - Projection 1 Year 150 210 240 210 240 450 285 240 450 312 375 810 3973 3 Year 75 105 120 105 120 225 143 120 225 312 375 375 2300 3 Months 275 385 440 385 440 825 523 440 825 625 750 1315 7227 500 700 800 700 800 1500 950 800 1500 1250 1500 2500 13500 Total 1 Year 150 210 240 210 240 450 285 240 450 312 375 810 3973 3 Year 75 105 120 105 120 225 143 120 225 312 375 375 2300 3 Months 275 385 440 385 440 825 523 440 825 625 750 1315 7227 500 700 800 700 800 1500 950 800 1500 1250 1500 2500 13500 Budgets were based on quartely estimate, to arrive at monthly number each quarter was divided into months to match with quarterly numbers.
  • 4. New Business - Revenue January February March April May June July August September October November December Full Year 13 13 13 13 13 13 13 13 13 13 13 13 150 18 18 18 18 18 18 18 18 18 18 18 193 20 20 20 20 20 20 20 20 20 20 200 18 18 18 18 18 18 18 18 18 158 20 20 20 20 20 20 20 20 160 37 37 37 37 37 37 37 262 24 24 24 24 24 24 143 20 20 20 20 20 100 38 38 38 38 150 26 26 26 78 31 31 63 68 68 2 2 2 2 2 2 2 2 2 2 2 2 25 3 3 3 3 3 3 3 3 3 3 3 32 3 3 3 3 3 3 3 3 3 3 33 3 3 6 4 3 6 9 10 10 56 3 6 4 3 6 9 10 10 53 6 4 3 6 9 10 10 49 4 3 6 9 10 10 43 3 6 9 10 10 39 6 9 10 10 36 9 10 10 30 10 10 21 10 10 92 92 92 275 128 128 128 385 147 147 147 440 128 128 128 385 147 147 147 440 275 275 275 825 174 174 174 523 147 147 147 440 275 275 275 825 208 208 208 625 250 250 500 438 438 15 35 58 79 102 152 173 194 252 301 355 433 2150 92 220 367 403 422 550 596 596 596 630 733 897 6101 106 255 425 482 524 702 769 790 848 931 1089 1330 8250 Backlog Revenue January February March April May June July August September October November December Full Year Total Retail Jobs Software iPlan 121 121 121 100 100 100 100 100 86 86 86 86 1206 iLeader 14 14 14 14 14 14 14 14 11 11 11 11 161 iMarket 150 140 133 133 133 133 133 133 133 92 89 82 1487 Other 10 4 14 Total Software Revenue 295 275 269 248 248 248 252 248 231 189 186 179 2868 Data R&D Cube iBlkship 478 140 163 780 iAccess 96 96 iOpinion 226 164 391 iField Other 115 115 Total Data Revenue 478 481 164 259 1382 Total Backlog Revenue 773 756 433 248 248 507 252 248 231 189 186 179 4250 TOTAL REVENUE 879 1011 858 730 772 1209 1020 1037 1078 1120 1275 1509 12500 Budget Yr 2013 New Business - Product 9/18/2013
  • 5. PAYROLL Location Current $ Pay Budget Adj Budgeted Annual Pay January February March April May June July August September October November December Total Administration Adm1 US 200 7 207 17 17 17 17 17 17 17 17 17 17 17 17 207 Adm2 US 60 60 5 5 5 5 5 5 30 Recruit #1 US 175 175 15 15 15 15 15 15 15 102 Recruit #2 US 80 80 7 7 7 7 7 7 7 7 7 60 Recruit #3 US 65 65 5 5 5 5 5 5 5 38 Adm3 US 140 140 12 12 12 12 12 12 12 12 12 12 12 12 140 Adm4 US 100 10 110 9 9 9 9 9 9 9 9 9 9 9 9 110 Adm5 US 38 1 39 3 3 3 3 3 3 3 3 3 3 3 3 39 Adm6 US 12 12 1 1 1 1 1 1 1 1 1 1 1 1 12 Adm7 UKR 9 9 1 1 1 1 1 1 1 1 1 1 1 1 9 Adm8 UKR 18 18 2 2 2 2 2 2 2 2 2 2 2 2 18 Adm9 GM 200 200 17 17 17 17 17 17 17 17 17 17 17 17 200 Adm10 GM 95 95 8 8 8 8 8 8 48 Adm11 GM 19 19 2 2 2 2 2 2 9 Adm12 GM 12 12 1 1 2 Adm13 GM 59 3 62 5 5 5 5 5 5 5 5 5 5 5 5 62 Adm14 GM 23 3 26 2 2 2 2 2 2 13 Adm15 GM 49 3 52 4 4 4 4 4 4 26 Adm16 GM 6 6 1 1 1 1 1 1 3 Total Administration 1360 27 1388 89 89 88 95 95 115 93 93 93 93 93 93 1128 # of Employees 16 16 15 16 16 18 12 12 12 12 12 12 Marketing Market1 US 180 180 15 15 15 15 8 68 Market2 US 130 10 140 11 11 22 Market3 US 77 77 6 6 13 Recruit #1 US N/A 150 13 13 13 13 13 13 13 88 Recruit #2 US N/A 130 11 11 11 11 11 11 11 11 11 11 108 Market4 GM 29 29 2 2 2 2 2 2 15 Market5 GM 65 65 5 5 5 5 5 5 5 38 Total Marketing 481 10 771 40 40 34 34 26 31 29 23 23 23 23 23 350 # of Employees 5 5 4 4 4 4 3 3 3 3 3 3 Sales - US Sales 1 US 220 220 18 18 18 18 18 18 18 18 18 18 18 18 220 Recruit - Sales Support #2 US April 120 10 10 10 10 10 10 10 10 10 90 Sales 2 US 195 195 16 16 16 16 16 16 16 16 16 16 16 16 195 Recruit - Team #1 US N/A March15 200 8 17 17 17 17 17 17 17 17 17 158 Sales 3 US 110 10 120 10 10 10 10 10 10 10 10 10 10 10 10 120 Recruit - Team #1 US N/A April 120 10 10 10 10 10 10 10 10 10 90 Recruit - Team #1 US N/A June 100 8 8 8 8 8 8 50 Sales 4 US 150 15 165 14 14 14 14 14 14 14 14 14 14 14 14 165 Sales 5 US 120 120 10 10 Recruit - Team #2 US N/A April 150 13 13 13 13 13 13 13 13 13 113 Recruit - Team #2 US N/A June 100 8 8 8 8 8 8 50 Sales 6 US March 120 10 10 10 10 10 10 10 10 10 10 100 Sales 7 US 70 70 6 6 6 6 6 6 6 6 6 6 6 6 70 Total Sales - US 865 25 1800 74 64 83 123 123 123 140 140 140 140 140 140 1431 # of Employees 6 5 7 10 10 10 12 12 12 12 12 12 Sales - EU Sales 8 EU 130 70 200 17 17 17 17 17 17 17 17 17 17 17 17 200 Sales 9 EU 215 215 9 9 18 18 18 18 18 18 18 18 18 18 197 Recruit - Team #2 EU June 120 10 10 10 10 10 10 10 70 Sales 10 GM 130 130 11 11 11 11 11 11 11 11 11 11 11 11 130 Sales 11 GM 110 110 9 9 9 9 9 9 9 9 9 9 9 9 110 Sales 12 GM 115 115 10 10 10 10 10 10 57 Sales 13 GM 129 129 11 11 11 11 11 11 11 11 11 11 11 11 129 Sales 14 GM 101 101 8 8 8 8 8 8 8 8 8 8 8 8 101 Sales 15 GM 99 99 8 8 8 8 8 8 8 8 8 8 8 8 99 Sales 16 GM 70 14 85 7 7 7 7 7 7 7 7 7 7 7 7 85 Sales 17 BD/UK 65 65 5 5 5 5 5 5 5 5 43 Total Sales - EU 1164 84 1368 95 95 104 104 104 114 104 104 99 99 99 99 1221 # of Employees 10 10 10 10 10 11 10 10 9 9 9 9 Total Sales 2029 109 3168 169 159 187 227 227 237 244 244 239 239 239 239 2652 # of Employees 16 15 17 20 20 21 22 22 21 21 21 21 Client Operations - US ClientOps 1 US 120 5 125 10 10 10 10 10 10 10 10 10 10 10 10 125 ClientOps 2 US 85 3 88 7 7 7 7 7 7 7 7 7 7 7 7 88 ClientOps 3 US 85 4 89 7 7 7 7 7 7 7 7 7 7 7 7 89 ClientOps 4 US 48 48 4 4 4 4 4 4 4 4 4 4 4 4 48 ClientOps 5 US 77 77 6 6 6 6 6 6 6 6 6 6 64 ClientOps 6 US 106 106 9 9 9 9 9 9 9 9 9 9 9 9 106 ClientOps 7 US 55 55 5 5 5 5 5 5 5 5 5 5 5 5 55 Recruit #1 US 45 45 4 4 4 4 4 4 4 4 4 34 Total Client Operations - US 621 11 632 43 43 49 53 53 53 53 53 53 53 53 53 608 # of Employees 6 6 7 8 8 8 8 8 8 8 8 8 Client Operations - EU ClientOps 8 GM 94 17 111 9 9 9 9 9 9 9 9 9 9 9 9 111 ClientOps 9 UKR 12 12 1 1 1 1 1 1 1 1 1 1 1 1 12 ClientOps 10 GM 56 2 58 5 5 5 5 5 5 5 5 5 5 5 5 58 ClientOps 10 UKR 31 31 3 3 3 3 3 3 3 3 3 3 3 3 31 ClientOps 11 GM 70 70 6 6 6 6 6 6 6 6 6 6 6 6 70 ClientOps 12 GM 78 78 7 7 7 7 7 7 7 7 7 7 7 72 ClientOps 13 GM 78 78 7 7 7 7 7 7 7 7 7 7 7 7 78 Recruit #1 GM 85 85 7 7 7 7 7 7 7 7 57 Recruit #2 GM 85 85 7 7 7 7 7 7 43 Total Client Operations - EU 588 19 607 30 36 36 36 44 44 51 51 51 51 51 51 530 # of Employees 6 7 7 7 8 8 9 9 9 9 9 9 Total Client Operations 1209 30 1239 72 79 85 89 96 96 103 103 103 103 103 103 1138 # of Employees 12 13 14 15 16 16 17 17 17 17 17 17 Technology Technology 1 UKR 16 16 1 1 1 1 1 1 1 1 1 1 1 1 16 Technology 2 UKR 13 13 1 1 1 1 1 1 1 1 1 1 1 1 13 Technology 3 UKR 18 18 2 2 2 2 2 2 2 2 2 2 2 2 18 Technology 4 UKR 16 16 1 1 1 1 1 1 1 1 1 1 1 1 16 Technology 5 UKR 16 16 1 1 1 1 1 1 1 1 1 1 1 1 16 Technology 6 US 20 20 2 2 2 2 2 2 2 2 2 2 2 2 20 Technology 7 UKR 17 17 1 1 1 1 1 1 1 1 1 1 1 1 17 Technology 8 UKR 38 38 3 3 3 3 3 3 3 3 3 3 3 3 38 Technology 9 UKR 38 38 3 3 3 3 3 3 3 3 3 3 3 3 38 Technology 10 UKR 17 17 1 1 1 1 1 1 1 1 1 1 1 1 17 Technology 11 UKR 12 12 1 1 1 1 1 1 1 1 1 1 1 1 12 Technology 12 UKR 20 20 2 2 2 2 2 2 2 2 2 2 2 2 20 Technology 13 UKR 24 24 2 2 2 2 2 2 2 2 2 2 2 2 24 Technology 14 UKR 13 13 1 1 1 1 1 1 1 1 1 1 1 1 13 Technology 15 UKR 28 28 2 2 2 2 2 2 2 2 2 2 2 2 28 Technology 16 UKR 48 48 4 4 4 4 4 4 4 4 4 4 4 4 48 Technology 17 UKR 24 24 2 2 2 2 2 2 2 2 2 2 2 2 24 Technology 18 UKR 24 24 2 2 2 2 2 2 2 2 2 2 2 2 24 Technology 19 UKR 19 19 2 2 2 2 2 2 2 2 2 2 2 2 19 Technology 20 UKR 17 17 1 1 1 1 1 1 1 1 1 1 1 1 17 Technology 21 UKR 24 24 2 2 2 2 2 2 2 2 2 2 2 2 24 Technology 22 UKR 10 10 1 1 1 1 1 1 1 1 1 1 1 1 10 Technology 23 UKR 12 12 1 1 1 1 1 1 1 1 1 1 1 1 12 Technology 24 UKR 20 20 2 2 2 2 2 2 2 2 2 2 2 2 20 Technology 25 UKR 6 6 1 1 1 1 1 1 1 1 1 1 1 1 6 Technology 26 UKR 11 11 1 1 1 1 1 1 1 1 1 1 1 1 11 Technology 27 GM 91 26 117 10 10 10 10 10 10 10 10 10 10 10 10 117 Technology 28 GM 87 87 7 7 7 7 7 7 44 Technology 29 GM 71 71 6 6 6 6 6 6 6 6 6 6 6 6 71 Technology 30 GM 70 9 79 7 7 7 7 7 7 7 7 7 7 7 7 79 Technology 31 GM 65 3 68 6 6 6 6 6 6 6 6 6 6 6 6 68 Technology 32 GM 53 53 4 4 4 4 4 4 27 Technology 33 GM 34 34 3 3 3 3 3 3 3 3 3 3 3 3 34 Technology 34 US 130 10 140 12 12 12 12 12 12 12 12 12 12 117 Recruit #1 UKR 26 26 2 2 2 2 2 2 2 2 2 2 2 2 26 Recruit #2 UKR 50 50 4 4 4 4 4 4 4 29 Recruit #3 UKR 24 24 2 2 2 2 2 2 2 14 Recruit #4 UKR 40 40 3 3 3 3 3 3 3 23 Total Technology 1263 48 1311 88 88 100 100 100 109 98 98 98 98 98 98 1170 # of Employees 34 34 35 35 35 38 36 36 36 36 36 36 Information Research Information Research 1 UKR 12 12 1 1 1 1 1 1 1 1 1 1 1 1 12 Information Research 2 GM 47 47 4 4 4 12 Information Research 3 GM 56 2 58 5 5 5 5 5 5 5 5 5 5 5 5 58 Information Research 4 GM 66 2 69 6 6 6 6 6 6 6 6 6 6 6 6 69 Information Research 5 GM 52 16 68 6 6 6 6 6 6 6 6 6 6 6 6 68 Information Research 6 GM 47 2 49 4 4 4 4 4 4 4 4 4 4 4 4 49 Information Research 7 UKR 12 12 1 1 1 1 1 1 1 1 1 1 1 1 12 Information Research 8 UKR 12 12 1 1 1 1 1 1 1 1 1 1 1 1 12 Recruit #1 UKR 12 12 1 1 1 1 1 1 1 1 1 1 10 Recruit #2 UKR 12 12 1 1 1 1 1 1 1 1 1 9 Recruit #3 UKR 12 12 1 1 1 1 1 1 1 1 1 1 10 Recruit #4 UKR 12 12 1 1 1 1 1 1 1 1 1 1 10 Temps 75 75 6 6 6 6 6 6 6 6 6 6 6 6 75 Total Research 427 23 449 33 33 36 34 34 34 34 34 34 34 34 34 405 # of Employees 9 9 12 12 12 12 12 12 12 12 12 12 BPO Services bpo Services 1 UKR 24 24 2 2 2 2 2 2 2 2 2 2 2 2 24 bpo Services 2 UKR 18 18 2 2 2 2 2 2 2 2 2 2 2 2 18 bpo Services 3 UKR 11 11 1 1 1 1 1 1 1 1 1 1 1 1 11 bpo Services 4 UKR 18 18 2 2 2 2 2 2 2 2 2 2 2 2 18 bpo Services 5 UKR 18 18 2 2 2 2 2 2 2 2 2 2 2 2 18 bpo Services 6 UKR 12 12 1 1 1 1 1 1 1 1 1 1 1 1 12 bpo Services 7 UKR 8 8 1 1 1 1 1 1 1 1 1 1 1 1 8 bpo Services 8 UKR 7 7 1 1 1 1 1 1 1 1 1 1 1 1 7 Total BPO Services 116 116 10 10 10 10 10 10 10 10 10 10 10 10 116 # of Employees 8 8 8 8 8 8 8 8 8 8 8 8 Total 6886 247 8443 502 498 539 588 587 632 610 605 599 599 599 599 6960 # of Employees 100 100 105 110 111 117 110 110 109 109 109 109 Payroll of Clients ops part of COGS 72 79 85 89 96 96 103 103 103 103 103 103 1138 Payroll Other Expenses 430 420 454 499 491 536 507 502 496 496 496 496 5822
  • 6. PAYROLL Location Rate Rate 2 Administration Adm1 US 8.25% 2.25% Adm2 US N/A N/A Recruit #1 US 8.25% 2.25% Recruit #2 US 8.25% 2.25% Recruit #3 US 8.25% 2.25% Adm3 US 8.25% 2.25% Adm4 US 8.25% 2.25% Adm5 US 8.25% 2.25% Adm6 US 8.25% 2.25% Adm7 UKR 36.77% N/A Adm8 UKR 36.77% N/A Adm9 GM 1,127.10$ -$ Adm10 GM 1,261.00$ -$ Adm11 GM 309.40$ -$ Adm12 GM 106.60$ -$ Adm13 GM 972.40$ -$ Adm14 GM 390.00$ -$ Adm15 GM 816.40$ -$ Adm16 GM 5.20$ -$ Total Administration Marketing Market1 US 8.25% 2.25% Market2 US 8.25% 2.25% Market3 US 8.25% 2.25% Recruit #1 US 8.25% 2.25% Recruit #2 US 8.25% 2.25% Market4 GM 490.10$ -$ Market5 GM 1,046.50$ -$ Total Marketing Sales - US Sales 1 US 8.25% 2.25% Recruit - Sales Support #2 US 8.25% 2.25% Sales 2 US 8.25% 2.25% Recruit - Team #1 US 8.25% 2.25% Sales 3 US 8.25% 2.25% Recruit - Team #1 US 8.25% 2.25% Recruit - Team #1 US 8.25% 2.25% Sales 4 US 8.25% 2.25% Sales 5 US 8.25% 2.25% Recruit - Team #2 US 8.25% 2.25% Recruit - Team #2 US 8.25% 2.25% Sales 6 US 8.25% 2.25% Sales 7 US 8.25% 2.25% Total Sales - US Sales - EU Sales 8 EU 0.00% 0.00% Sales 9 EU Recruit - Team #2 EU 1,264.90$ -$ Sales 10 GM 1,264.90$ -$ Sales 11 GM 1,134.90$ -$ Sales 12 GM 1,220.70$ -$ Sales 13 GM 1,089.40$ -$ Sales 14 GM 1,232.40$ -$ Sales 15 GM 1,236.30$ -$ Sales 16 GM 1,094.60$ -$ Sales 17 BD/UK -$ -$ Total Sales - EU Total Sales January February March April May June July August September October November December Total 1.4 1.4 1.4 1.4 1.4 1.4 1.4 .4 .4 .4 .4 .4 11.9 .0 .0 .0 1.2 1.2 1.2 1.2 1.2 1.2 .3 7.5 .6 .6 .6 .6 .6 .6 .6 .6 .2 4.6 .0 .0 .4 .4 .4 .4 .4 .4 .1 2.8 1.0 1.0 1.0 1.0 1.0 1.0 1.0 1.0 1.0 .3 .3 .3 9.5 .8 .8 .8 .8 .8 .8 .8 .8 .8 .8 .8 .8 9.1 .3 .3 .3 .3 .3 .3 .3 .3 .3 .3 .3 .3 3.2 .1 .1 .1 .1 .1 .1 .1 .1 .1 .1 .1 .1 1.0 .3 .3 .3 .3 .3 .3 .3 .3 .3 .3 .3 .3 3.4 .6 .6 .6 .6 .6 .6 .6 .6 .6 .6 .6 .6 6.6 1.1 1.1 1.1 1.1 1.1 1.1 1.1 1.1 1.1 1.1 1.1 1.1 13.5 1.3 1.3 1.3 1.3 1.3 1.3 .0 .0 .0 .0 .0 .0 7.6 .3 .3 .3 .3 .3 .3 .0 .0 .0 .0 .0 .0 1.9 .1 .1 .0 .0 .0 .0 .0 .0 .0 .0 .0 .0 .2 1.0 1.0 1.0 1.0 1.0 1.0 1.0 1.0 1.0 1.0 1.0 1.0 11.7 .4 .4 .4 .4 .4 .4 .4 .0 .0 .0 .0 .0 2.7 .8 .8 .8 .8 .8 .8 .8 .0 .0 .0 .0 .0 5.7 .0 .0 .0 .0 .0 .0 .0 .0 .0 .0 .0 .0 .0 9.3 9.3 9.2 9.8 9.8 11.4 9.8 7.6 7.6 6.9 6.9 5.3 102.8 1.2 1.2 1.2 1.2 .6 .0 .0 .0 .0 .0 .0 .0 5.6 .9 .9 .0 .0 .0 .0 .0 .0 .0 .0 .0 .0 1.8 .5 .5 .0 .0 .0 .0 .0 .0 .0 .0 .0 .0 1.1 .0 .0 .0 .0 .0 1.0 1.0 1.0 1.0 1.0 1.0 1.0 7.2 .0 .0 .9 .9 .9 .9 .9 .9 .9 .9 .9 .9 8.9 .5 .5 .5 .5 .5 .5 .0 .0 .0 .0 .0 .0 2.9 1.0 1.0 1.0 1.0 1.0 1.0 1.0 .0 .0 .0 .0 .0 7.3 4.2 4.2 3.7 3.7 3.0 3.5 3.0 1.9 1.9 1.9 1.9 1.9 34.8 1.5 1.5 1.5 1.5 1.5 1.5 1.5 .4 .4 .4 .4 .4 12.7 .8 .8 .8 .8 .8 .8 .8 .8 .8 7.4 1.3 1.3 1.3 1.3 1.3 1.3 1.3 .4 .4 .4 .4 .4 11.2 .7 1.4 1.4 1.4 1.4 1.4 1.4 1.4 .4 .4 11.1 .8 .8 .8 .8 .8 .8 .8 .8 .8 .8 .8 .8 9.9 .8 .8 .8 .8 .8 .8 .8 .8 .8 7.4 .0 .7 .7 .7 .7 .7 .7 4.1 1.1 1.1 1.1 1.1 1.1 1.1 1.1 1.1 1.1 .3 .3 .3 11.1 .8 .0 .0 .0 .0 .0 .0 .0 .0 .0 .0 .0 .8 1.0 1.0 1.0 1.0 1.0 1.0 1.0 1.0 1.0 9.3 .0 .0 .0 .7 .7 .7 .7 .7 .7 4.1 .0 .0 .8 .8 .8 .8 .8 .8 .8 .8 .8 .8 8.3 .5 .5 .5 .5 .5 .5 .5 .5 .5 .5 .5 .5 5.8 6.1 5.3 6.8 10.2 10.2 10.2 11.6 9.5 9.5 8.7 7.7 7.7 103.2 .0 .0 .0 .0 .0 .0 .0 .0 .0 .0 .0 .0 .0 .0 1.3 1.3 1.3 1.3 1.3 1.3 1.3 8.9 1.3 1.3 1.3 1.3 1.3 1.3 1.3 1.3 1.3 1.3 1.3 1.3 15.2 1.1 1.1 1.1 1.1 1.1 1.1 1.1 1.1 1.1 1.1 1.1 1.1 13.6 1.2 1.2 1.2 1.2 1.2 1.2 7.3 1.1 1.1 1.1 1.1 1.1 1.1 1.1 1.1 1.1 1.1 1.1 1.1 13.1 1.2 1.2 1.2 1.2 1.2 1.2 1.2 1.2 1.2 1.2 1.2 1.2 14.8 1.2 1.2 1.2 1.2 1.2 1.2 1.2 1.2 1.2 1.2 1.2 1.2 14.8 1.1 1.1 1.1 1.1 1.1 1.1 1.1 1.1 1.1 1.1 1.1 1.1 13.1 .0 .0 .0 .0 .0 .0 .0 .0 .0 .0 .0 .0 .0 8.3 8.3 8.3 8.3 8.3 9.5 8.3 8.3 8.3 8.3 8.3 8.3 100.8 14.4 13.6 15.1 18.4 18.4 19.7 19.9 17.8 17.8 17.0 16.0 16.0 204.0
  • 7. PAYROLL Location Health Benefit Pension Fund Car Other Total January February March April May June July August September October November December Total2 Administration Adm1 US .000 .000 18.000 .000 18.000 1.500 1.500 1.500 1.500 1.500 1.500 1.500 1.500 1.500 1.500 1.500 1.500 18.000 Adm2 US .000 .000 .000 .000 .000 .000 .000 .000 .000 .000 .000 .000 .000 .000 .000 .000 .000 .000 Recruit #1 US 15.000 .000 .000 .000 15.000 1.250 1.250 1.250 1.250 1.250 1.250 1.250 8.750 Recruit #2 US 15.000 .000 .000 .000 15.000 1.250 1.250 1.250 1.250 1.250 1.250 1.250 1.250 1.250 11.250 Recruit #3 US 10.000 .000 .000 .000 10.000 .833 .833 .833 .833 .833 .833 .833 5.833 Adm3 US 16.900 .000 6.000 .000 22.900 1.908 1.908 1.908 1.908 1.908 1.908 1.908 1.908 1.908 1.908 1.908 1.908 22.900 Adm4 US 11.900 .000 .000 .000 11.900 .992 .992 .992 .992 .992 .992 .992 .992 .992 .992 .992 .992 11.900 Adm5 US 5.100 .000 .000 .000 5.100 .425 .425 .425 .425 .425 .425 .425 .425 .425 .425 .425 .425 5.100 Adm6 US .000 .000 .000 .000 .000 .000 .000 .000 .000 .000 .000 .000 .000 .000 .000 .000 .000 .000 Adm7 UKR .367 .000 .000 .612 .979 .082 .082 .082 .082 .082 .082 .082 .082 .082 .082 .082 .082 .979 Adm8 UKR .367 .000 .000 .000 .367 .031 .031 .031 .031 .031 .031 .031 .031 .031 .031 .031 .031 .367 Adm9 GM .000 .000 .000 .000 .000 .000 .000 .000 .000 .000 .000 .000 .000 .000 .000 .000 .000 .000 Adm10 GM .000 .000 .000 .000 .000 .000 .000 .000 .000 .000 .000 .000 .000 .000 .000 .000 .000 .000 Adm11 GM .000 .000 .000 .000 .000 .000 .000 .000 .000 .000 .000 .000 .000 .000 .000 .000 .000 .000 Adm12 GM .000 .000 .000 .000 .000 .000 .000 .000 .000 .000 .000 .000 .000 .000 .000 .000 .000 .000 Adm13 GM .000 .000 .000 .000 .000 .000 .000 .000 .000 .000 .000 .000 .000 .000 .000 .000 .000 .000 Adm14 GM .000 .000 .000 .000 .000 .000 .000 .000 .000 .000 .000 .000 .000 .000 .000 .000 .000 .000 Adm15 GM .000 .000 .000 .000 .000 .000 .000 .000 .000 .000 .000 .000 .000 .000 .000 .000 .000 .000 Adm16 GM .000 .000 .000 .000 .000 .000 .000 .000 .000 .000 .000 .000 .000 .000 .000 .000 .000 .000 Total Administration 74.634 .000 24.000 .612 99.246 4.937 4.937 4.937 6.187 6.187 8.271 8.271 8.271 8.271 8.271 8.271 8.271 85.079 Marketing Market1 US 18.800 .000 7.200 .000 26.000 2.167 2.167 2.167 2.167 2.167 10.833 Market2 US 18.000 .000 .000 .000 18.000 1.500 1.500 3.000 Market3 US .000 .000 .000 .000 .000 .000 .000 .000 .000 .000 .000 .000 .000 .000 .000 .000 .000 .000 Recruit #1 US 10.000 10.000 .000 .833 .833 .833 .833 .833 .833 .833 5.833 Recruit #2 US 10.000 10.000 .833 .833 .833 .833 .833 .833 .833 .833 .833 .833 8.333 Market4 GM .000 .000 .000 .000 .000 .000 .000 .000 .000 .000 .000 .000 .000 .000 .000 .000 .000 .000 Market5 GM .000 .000 .000 .000 .000 .000 .000 .000 .000 .000 .000 .000 .000 .000 .000 .000 Total Marketing 56.800 .000 7.200 .000 64.000 3.667 3.667 3.000 3.000 3.000 1.667 1.667 1.667 1.667 1.667 1.667 1.667 28.000 Sales - US Sales 1 US .000 .000 .000 .000 .000 .000 .000 .000 .000 .000 .000 .000 .000 .000 .000 .000 .000 .000 Recruit - Sales Support #2 US 12.000 .000 12.000 1.000 1.000 1.000 1.000 1.000 1.000 1.000 1.000 1.000 9.000 Sales 2 US 17.900 .000 14.400 .000 32.300 2.692 2.692 2.692 2.692 2.692 2.692 2.692 2.692 2.692 2.692 2.692 2.692 32.300 Recruit - Team #1 US 12.000 .000 12.000 1.000 1.000 1.000 1.000 1.000 1.000 1.000 1.000 8.000 Sales 3 US 18.600 .000 .000 .000 18.600 1.550 1.550 1.550 1.550 1.550 1.550 1.550 1.550 1.550 1.550 1.550 1.550 18.600 Recruit - Team #1 US 12.000 .000 12.000 1.000 1.000 1.000 1.000 1.000 1.000 1.000 1.000 1.000 9.000 Recruit - Team #1 US 12.000 .000 12.000 1.000 1.000 1.000 1.000 1.000 1.000 6.000 Sales 4 US 18.700 .000 .000 .000 18.700 1.558 1.558 1.558 1.558 1.558 1.558 1.558 1.558 1.558 1.558 1.558 1.558 18.700 Sales 5 US .000 .000 .000 .000 .000 .000 .000 Recruit - Team #2 US 12.000 .000 12.000 1.000 1.000 1.000 1.000 1.000 1.000 1.000 1.000 1.000 9.000 Recruit - Team #2 US 12.000 .000 12.000 .000 1.000 1.000 1.000 1.000 1.000 1.000 1.000 7.000 Sales 6 US 15.000 15.000 1.250 1.250 1.250 1.250 1.250 1.250 1.250 1.250 1.250 1.250 12.500 Sales 7 US .180 .000 .000 .000 .180 .015 .015 .015 .015 .015 .015 .015 .015 .015 .015 .015 .015 .180 Total Sales - US 142.380 .000 14.400 .000 156.780 5.815 5.815 7.065 10.065 11.065 12.065 13.065 13.065 13.065 13.065 13.065 13.065 130.280 Sales - EU Sales 8 EU .000 .000 .000 .000 .000 .000 .000 .000 .000 .000 .000 .000 .000 .000 .000 .000 .000 .000 Sales 9 EU .000 .000 .000 .000 .000 .000 .000 .000 .000 .000 .000 .000 Recruit - Team #2 EU .000 .000 .000 .000 .000 .000 .000 .000 .000 Sales 10 GM .000 .000 11.622 .000 11.622 .969 .969 .969 .969 .969 .969 .969 .969 .969 .969 .969 .969 11.622 Sales 11 GM .000 .000 13.744 .000 13.744 1.145 1.145 1.145 1.145 1.145 1.145 1.145 1.145 1.145 1.145 1.145 1.145 13.744 Sales 12 GM .000 .000 .000 .000 .000 .000 .000 .000 .000 .000 .000 .000 .000 .000 .000 .000 .000 .000 Sales 13 GM .000 .000 .000 .000 .000 .000 .000 .000 .000 .000 .000 .000 .000 .000 .000 .000 .000 .000 Sales 14 GM .000 .000 .000 .000 .000 .000 .000 .000 .000 .000 .000 .000 .000 .000 .000 .000 .000 .000 Sales 15 GM .000 .000 .000 .000 .000 .000 .000 .000 .000 .000 .000 .000 .000 .000 .000 .000 .000 .000 Sales 16 GM .000 .000 .000 .000 .000 .000 .000 .000 .000 .000 .000 .000 .000 .000 .000 .000 .000 .000 Sales 17 BD/UK .000 .000 .000 .000 .000 .000 .000 .000 .000 .000 .000 .000 .000 .000 .000 .000 .000 .000 Total Sales - EU .000 .000 25.366 .000 25.366 2.114 2.114 2.114 2.114 2.114 2.114 2.114 2.114 2.114 2.114 2.114 2.114 25.366 Total Sales 142.380 .000 39.766 .000 182.146 7.929 7.929 9.179 12.179 13.179 14.179 15.179 15.179 15.179 15.179 15.179 15.179 155.646 Client Operations - US ClientOps 1 US 18.611 .000 .000 .000 18.611 1.551 1.551 1.551 1.551 1.551 1.551 1.551 1.551 1.551 1.551 1.551 1.551 18.611 ClientOps 2 US 17.800 .000 .000 .000 17.800 1.483 1.483 1.483 1.483 1.483 1.483 1.483 1.483 1.483 1.483 1.483 1.483 17.800 ClientOps 3 US 5.300 .000 .000 .000 5.300 .442 .442 .442 .442 .442 .442 .442 .442 .442 .442 .442 .442 5.300 ClientOps 4 US 5.200 .000 .000 .000 5.200 .433 .433 .433 .433 .433 .433 .433 .433 .433 .433 .433 .433 5.200 ClientOps 5 US 5.200 .000 .000 .000 5.200 .433 .433 .433 .433 .433 .433 .433 .433 .433 .433 4.333 ClientOps 6 US 17.000 .000 .000 .000 17.000 1.417 1.417 1.417 1.417 1.417 1.417 1.417 1.417 1.417 1.417 1.417 1.417 17.000 ClientOps 7 US .000 .000 .000 .000 .000 .000 .000 .000 .000 .000 .000 .000 .000 .000 .000 .000 .000 .000 Recruit #1 US 10.000 .000 .000 .000 10.000 .833 .833 .833 .833 .833 .833 .833 .833 .833 .833 .833 .833 10.000 Total Client Operations - US 79.111 .000 .000 .000 79.111 6.159 6.159 6.593 6.593 6.593 6.593 6.593 6.593 6.593 6.593 6.593 6.593 78.244 Client Operations - EU ClientOps 8 GM .000 .000 .000 .660 .660 .055 .055 .055 .055 .055 .055 .055 .055 .055 .055 .055 .055 .660 ClientOps 9 UKR .367 .660 .000 .000 1.027 .086 .086 .086 .086 .086 .086 .086 .086 .086 .086 .086 .086 1.027 ClientOps 10 GM .000 .000 .000 .660 .660 .055 .055 .055 .055 .055 .055 .055 .055 .055 .055 .055 .055 .660 ClientOps 10 UKR .367 .660 .000 .000 1.027 .086 .086 .086 .086 .086 .086 .086 .086 .086 .086 .086 .086 1.027 ClientOps 11 GM .000 .000 .000 .660 .660 .055 .055 .055 .055 .055 .055 .055 .055 .055 .055 .055 .055 .660 ClientOps 12 GM .000 .000 .000 .720 .720 .060 .060 .060 .060 .060 .060 .060 .060 .060 .060 .060 .660 ClientOps 13 GM .000 .000 .000 .660 .660 .055 .055 .055 .055 .055 .055 .055 .055 .055 .055 .055 .055 .660 Recruit #1 GM .000 .000 .000 .660 .660 .055 .055 .055 .055 .055 .055 .055 .055 .440 Recruit #2 GM .000 .000 .000 .660 .660 .055 .055 .055 .055 .055 .055 .330 Total Client Operations - EU .734 1.320 .000 4.680 6.734 .391 .451 .451 .451 .506 .506 .561 .561 .561 .561 .561 .561 6.124 Total Client Operations 79.845 1.320 .000 4.680 85.845 6.550 6.610 7.044 7.044 7.099 7.099 7.154 7.154 7.154 7.154 7.154 7.154 84.368 Technology Technology 1 UKR .367 .660 .000 .000 1.027 .086 .086 .086 .086 .086 .086 .086 .086 .086 .086 .086 .086 1.027 Technology 2 UKR .367 .660 .000 .612 1.639 .137 .137 .137 .137 .137 .137 .137 .137 .137 .137 .137 .137 1.639 Technology 3 UKR .367 .660 .000 .000 1.027 .086 .086 .086 .086 .086 .086 .086 .086 .086 .086 .086 .086 1.027 Technology 4 UKR .367 .660 .000 .000 1.027 .086 .086 .086 .086 .086 .086 .086 .086 .086 .086 .086 .086 1.027 Technology 5 UKR .367 .660 .000 .000 1.027 .086 .086 .086 .086 .086 .086 .086 .086 .086 .086 .086 .086 1.027 Technology 6 US .367 .000 .000 .612 .979 .082 .082 .082 .082 .082 .082 .082 .082 .082 .082 .082 .082 .979 Technology 7 UKR .367 .660 .000 .000 1.027 .086 .086 .086 .086 .086 .086 .086 .086 .086 .086 .086 .086 1.027 Technology 8 UKR .367 .660 .000 .000 1.027 .086 .086 .086 .086 .086 .086 .086 .086 .086 .086 .086 .086 1.027 Technology 9 UKR .367 .660 .000 .000 1.027 .086 .086 .086 .086 .086 .086 .086 .086 .086 .086 .086 .086 1.027 Technology 10 UKR .367 .660 .000 .000 1.027 .086 .086 .086 .086 .086 .086 .086 .086 .086 .086 .086 .086 1.027 Technology 11 UKR .367 .660 .000 .000 1.027 .086 .086 .086 .086 .086 .086 .086 .086 .086 .086 .086 .086 1.027 Technology 12 UKR .367 .660 .000 .612 1.639 .137 .137 .137 .137 .137 .137 .137 .137 .137 .137 .137 .137 1.639 Technology 13 UKR .367 .660 .000 .000 1.027 .086 .086 .086 .086 .086 .086 .086 .086 .086 .086 .086 .086 1.027 Technology 14 UKR .367 .660 .000 .000 1.027 .086 .086 .086 .086 .086 .086 .086 .086 .086 .086 .086 .086 1.027 Technology 15 UKR .367 .660 .000 .000 1.027 .086 .086 .086 .086 .086 .086 .086 .086 .086 .086 .086 .086 1.027 Technology 16 UKR .367 .660 .000 .000 1.027 .086 .086 .086 .086 .086 .086 .086 .086 .086 .086 .086 .086 1.027 Technology 17 UKR .367 .660 .000 .000 1.027 .086 .086 .086 .086 .086 .086 .086 .086 .086 .086 .086 .086 1.027 Technology 18 UKR .367 .660 .000 .000 1.027 .086 .086 .086 .086 .086 .086 .086 .086 .086 .086 .086 .086 1.027 Technology 19 UKR .367 .660 .000 .000 1.027 .086 .086 .086 .086 .086 .086 .086 .086 .086 .086 .086 .086 1.027 Technology 20 UKR .367 .660 .000 .000 1.027 .086 .086 .086 .086 .086 .086 .000 .000 .000 .000 .000 .000 .514 Technology 21 UKR .367 .660 .000 .000 1.027 .086 .086 .086 .086 .086 .086 .086 .086 .086 .086 .086 .086 1.027 Technology 22 UKR .367 .660 .000 .000 1.027 .086 .086 .086 .086 .086 .086 .086 .086 .086 .086 .086 .086 1.027 Technology 23 UKR .367 .660 .000 .000 1.027 .086 .086 .086 .086 .086 .086 .086 .086 .086 .086 .086 .086 1.027 Technology 24 UKR .367 .660 .000 .000 1.027 .086 .086 .086 .086 .086 .086 .086 .086 .086 .086 .086 .086 1.027 Technology 25 UKR .367 .660 .000 .000 1.027 .086 .086 .086 .086 .086 .086 .086 .086 .086 .086 .086 .086 1.027 Technology 26 UKR .367 .660 .000 .000 1.027 .086 .086 .086 .086 .086 .086 .086 .086 .086 .086 .086 .086 1.027 Technology 27 GM .000 .000 .000 .660 .660 .055 .055 .055 .055 .055 .055 .055 .055 .055 .055 .055 .055 .660 Technology 28 GM .000 .000 .000 .660 .660 .055 .055 .055 .055 .055 .055 .055 .055 .055 .055 .055 .055 .660 Technology 29 GM .000 .000 .000 .660 .660 .055 .055 .055 .055 .055 .055 .055 .055 .055 .055 .055 .055 .660 Technology 30 GM .000 .000 .000 .660 .660 .055 .055 .055 .055 .055 .055 .055 .055 .055 .055 .055 .055 .660 Technology 31 GM .000 .000 .000 .660 .660 .055 .055 .055 .055 .055 .055 .055 .055 .055 .055 .055 .055 .660 Technology 32 GM .000 .000 .000 .660 .660 .055 .055 .055 .055 .055 .055 .330 Technology 33 GM .000 .000 .000 .660 .660 .055 .055 .055 .055 .055 .055 .055 .055 .055 .055 .055 .055 .660 Technology 34 US 18.000 .000 .000 .000 18.000 1.500 1.500 1.500 1.500 1.500 1.500 1.500 1.500 1.500 1.500 15.000 Recruit #1 UKR .367 .660 .000 .000 1.027 .086 .086 .086 .086 .086 .086 .086 .086 .086 .086 .086 .086 1.027 Recruit #2 UKR .367 .660 .000 .000 1.027 .086 .086 .086 .086 .086 .086 .514 Recruit #3 UKR .367 .660 .000 .000 1.027 .086 .086 .086 .086 .086 .086 .514 Recruit #4 UKR .367 .660 .000 .000 1.027 .086 .086 .086 .086 .086 .086 .514 Total Technology 29.010 19.140 .000 6.456 54.606 2.794 2.794 4.294 4.294 4.294 4.294 4.410 4.410 4.410 4.410 4.410 4.410 49.222 Information Research Information Research 1 UKR .367 .660 .000 .720 1.747 .146 .146 .146 .146 .146 .146 .146 .146 .146 .146 .146 .146 1.747 Information Research 2 GM .000 .000 .000 .000 .000 .000 .000 .000 .000 Information Research 3 GM .000 .000 .000 .000 .000 .000 .000 .000 .000 .000 .000 .000 .000 .000 .000 .000 .000 .000 Information Research 4 GM .000 .000 .000 .000 .000 .000 .000 .000 .000 .000 .000 .000 .000 .000 .000 .000 .000 .000 Information Research 5 GM .000 .000 .000 .000 .000 .000 .000 .000 .000 .000 .000 .000 .000 .000 .000 .000 .000 .000 Information Research 6 GM .000 .000 .000 .000 .000 .000 .000 .000 .000 .000 .000 .000 .000 .000 .000 .000 .000 .000 Information Research 7 UKR .367 .660 .000 .000 1.027 .086 .086 .086 .086 .086 .086 .086 .086 .086 .086 .086 .086 1.027 Information Research 8 UKR .367 .660 .000 .000 1.027 .086 .086 .086 .086 .086 .086 .086 .086 .086 .086 .086 .086 1.027 Recruit #1 UKR .367 .660 .000 .000 1.027 .086 .086 .086 .086 .086 .086 .086 .086 .086 .086 .856 Recruit #2 UKR .367 .660 .000 1.027 .086 .086 .086 .086 .086 .086 .086 .086 .086 .770 Recruit #3 UKR .367 .660 .000 1.027 .086 .086 .086 .086 .086 .086 .086 .086 .086 .086 .856 Recruit #4 UKR .367 .660 .000 1.027 .086 .086 .086 .086 .086 .086 .086 .086 .086 .086 .856 Temps 0 .000 .000 .000 .000 .000 .000 .000 .000 .000 .000 .000 .000 .000 .000 Total Research 2.569 4.620 .000 .720 7.909 .317 .317 .574 .659 .659 .659 .659 .659 .659 .659 .659 .659 7.139 BPO Services bpo Services 1 UKR .367 .000 .000 .000 .367 .031 .031 .031 .031 .031 .031 .031 .031 .031 .031 .031 .031 .367 bpo Services 2 UKR .367 .660 .000 .000 1.027 .086 .086 .086 .086 .086 .086 .086 .086 .086 .086 .086 .086 1.027 bpo Services 3 UKR .367 .660 .000 .000 1.027 .086 .086 .086 .086 .086 .086 .086 .086 .086 .086 .086 .086 1.027 bpo Services 4 UKR .367 .000 .000 .000 .367 .031 .031 .031 .031 .031 .031 .031 .031 .031 .031 .031 .031 .367 bpo Services 5 UKR .367 .660 .000 .000 1.027 .086 .086 .086 .086 .086 .086 .086 .086 .086 .086 .086 .086 1.027 bpo Services 6 UKR .367 .660 .000 .000 1.027 .086 .086 .086 .086 .086 .086 .086 .086 .086 .086 .086 .086 1.027 bpo Services 7 UKR .367 .660 .000 .000 1.027 .086 .086 .086 .086 .086 .086 .086 .086 .086 .086 .086 .086 1.027 bpo Services 8 UKR .367 .660 .000 .660 1.687 .141 .141 .141 .141 .141 .141 .141 .141 .141 .141 .141 .141 1.687 Total BPO Services 3 4 1 8 1 1 1 1 1 1 1 1 1 1 1 1 8 Total 388 29 71 13 501 27 27 30 34 35 37 38 38 38 38 38 38 417
  • 8. FACILITY Location Rent Rent NJ US 25 Germany GM 14 Total Rent 40 % of Revenue Utilities NJ US 4 Germany GM 5 Total Utilities 9 % of Revenue Other Facilities NJ US 1 Germany GM 1 Total Other Facilities 2 % of Revenue Total Facilites % of Revenue January February March April May June July August September October November December Total2 25 25 25 25 25 25 25 25 25 25 25 25 303 14 14 14 14 14 14 14 14 14 14 14 14 172 40 40 40 40 40 40 40 40 40 40 40 40 474 4% 4% 5% 5% 5% 3% 4% 4% 4% 4% 3% 3% 4 4 4 4 4 4 4 4 4 4 4 4 46 5 5 5 5 5 5 3 3 3 3 3 3 45 9 9 9 9 9 9 6 6 6 6 6 6 91 1% 1% 1% 1% 1% 1% 1% 1% 1% 1% 0% 0% 1 1 1 1 1 1 1 1 1 1 1 1 9 1 1 1 1 1 1 1 1 1 1 1 1 12 2 2 2 2 2 2 1 1 1 1 1 1 21 0% 0% 0% 0% 0% 0% 0% 0% 0% 0% 0% 0% 50 50 50 50 50 50 47 47 47 47 47 47 586 6% 5% 6% 7% 7% 4% 5% 5% 4% 4% 4% 3% 5%
  • 9. Column1 Column2 Column3 Column4 Column5 Column6 Column7 Column8 Column9 Column10 Column11 Column12 Column13 Column14 Column15 Column16 G & A Fixed Monthly January-13 February-13 March-13 April-13 May-13 June-13 July-13 August-13 September-13 October-13 November-13 December-13 Total Dues & Subscriptions 201 Littleton Road, Morris Plains, NJ .25 .25 .25 .25 .25 .25 .25 .25 .25 .25 .25 .25 .25 3.00 Germany .25 .25 .25 .25 .25 .25 .25 .25 .25 .25 .25 .25 .25 3.00 Total Dues & Subscriptions .5 .5 .5 .5 .5 .5 .5 .5 .5 .5 .5 .5 .5 6.0 % of Revenue 0% 0% 0% 0% 0% 0% 0% 0% 0% 0% 0% 0% Insurance US General Liability 3.2 3.2 3.2 3.2 3.2 3.2 3.2 3.2 3.2 3.2 3.2 3.2 3.2 38.7 Workers Compensation 2.3 2.3 2.3 2.3 2.3 2.3 2.3 2.3 2.3 2.3 2.3 2.3 2.3 27.6 D&O Insurance 3.2 3.2 3.2 3.2 3.2 3.2 3.2 3.2 3.2 3.2 3.2 3.2 3.2 37.8 Total Insurance - US 8.7 8.7 8.7 8.7 8.7 8.7 8.7 8.7 8.7 8.7 8.7 8.7 8.7 104.1 Germany Insurance Premiums .8 .8 .8 .8 .8 .8 .8 .8 .8 .8 .8 .8 .8 9.0 Workers Compensation 1.3 1.3 1.3 1.3 1.3 1.3 1.3 1.3 1.3 1.3 1.3 1.3 1.3 15.0 Total Insurance - Germany 2.0 2.0 2.0 2.0 2.0 2.0 2.0 2.0 2.0 2.0 2.0 2.0 2.0 24.0 Total Insurance 10.7 10.7 10.7 10.7 10.7 10.7 10.7 10.7 10.7 10.7 10.7 10.7 10.7 128.1 % of Revenue 1.21% 1.06% 1.24% 1.46% 1.38% 0.88% 1.05% 1.03% 0.99% 0.95% 0.84% 0.71% Accounting US Audit 4.0 4.0 4.0 4.0 4.0 4.0 4.0 4.0 4.0 4.0 4.0 4.0 4.0 48.0 Tax 2.0 2.0 2.0 2.0 2.0 2.0 2.0 2.0 2.0 2.0 2.0 2.0 2.0 24.0 Other 2.0 2.0 2.0 2.0 2.0 2.0 2.0 2.0 2.0 2.0 2.0 2.0 2.0 24.0 Total Accounting - US 8.0 8.0 8.0 8.0 8.0 8.0 8.0 8.0 8.0 8.0 8.0 8.0 8.0 96.0 Germany Audit 2.0 2.0 2.0 2.0 2.0 2.0 2.0 2.0 2.0 2.0 2.0 2.0 2.0 24.0 Tax 1.0 1.0 1.0 1.0 1.0 1.0 1.0 1.0 1.0 1.0 1.0 1.0 1.0 12.0 Other 4.5 4.5 4.5 4.5 4.5 4.5 4.5 4.5 4.5 4.5 4.5 4.5 4.5 54.0 Total Accounting - Germany 7.5 7.5 7.5 7.5 7.5 7.5 7.5 7.5 7.5 7.5 7.5 7.5 7.5 90.0 Total Accounting 15.5 15.5 15.5 15.5 15.5 15.5 15.5 15.5 15.5 15.5 15.5 15.5 15.5 186.0 % of Revenue 1.76% 1.53% 1.81% 2.12% 2.01% 1.28% 1.52% 1.49% 1.44% 1.38% 1.22% 1.03% Legal US General 7.5 7.5 7.5 7.5 7.5 7.5 7.5 7.5 7.5 7.5 7.5 7.5 7.5 90.0 Total Legal - US 7.5 7.5 7.5 7.5 7.5 7.5 7.5 7.5 7.5 7.5 7.5 7.5 7.5 90.0 Germany General 3.0 3.0 3.0 3.0 3.0 3.0 3.0 3.0 3.0 3.0 3.0 3.0 3.0 36.0 Total Legal - Germany 3.0 3.0 3.0 3.0 3.0 3.0 3.0 3.0 3.0 3.0 3.0 3.0 3.0 36.0 Total Legal 10.5 10.5 10.5 10.5 10.5 10.5 10.5 10.5 10.5 10.5 10.5 10.5 10.5 126.0 % of Revenue 1.19% 1.04% 1.22% 1.44% 1.36% 0.87% 1.03% 1.01% 0.97% 0.94% 0.82% 0.70%
  • 10. Non-Operating - Other Director 1 Director 2 Director 3 Total Other % of Revenue January-13 February-13 March-13 April-13 May-13 June-13 July-13 August-13 September-13 October-13 November-13 December-13 Total .0 .0 .0 .0 .0 .0 5.0 5.0 5.0 5.0 5.0 5.0 30.0 3.0 3.0 3.0 3.0 3.0 3.0 3.0 3.0 3.0 3.0 3.0 3.0 36.0 5.0 8.0 3.0 3.0 3.0 3.0 3.0 8.0 8.0 8.0 8.0 8.0 8.0 66.0 0.91% 0.30% 0.35% 0.41% 0.39% 0.25% 0.78% 0.77% 0.74% 0.71% 0.63% 0.53%
  • 11. TRAVEL AND EXPENSES Location Title 2013 Annual Salary January-13 February-13 March-13 April-13 May-13 June-13 July-13 August-13 September-13 October-13 November-13 December-13 Total Administration Admin 1 US EMG/Sales 75.0 6.3 6.3 6.3 6.3 6.3 6.3 6.3 6.3 6.3 6.3 6.3 6.3 75.0 Admin 2 US CFO 10.0 .8 .8 .8 .8 .8 .8 5.0 Recruit #1 US CFO 5.0 .0 .4 .4 .4 .4 .4 .4 2.5 Admin 3 US VP Global Talent Dev & Admin 5.0 .4 .4 .4 .4 .4 .4 .4 .4 .4 .4 .4 .4 5.0 Admin 4 US Controller 5.0 .4 .4 .4 .4 .4 .4 .4 .4 .4 .4 .4 .4 5.0 Admin 5 GM EMG 15.0 1.3 1.3 1.3 1.3 1.3 1.3 1.3 1.3 1.3 1.3 1.3 1.3 15.0 Admin 6 US EMG/Commute 65.0 5.4 5.4 5.4 5.4 5.4 5.4 5.4 5.4 5.4 5.4 5.4 5.4 65.0 Admin 7 EU EMG 10.0 .8 .8 .8 .8 .8 .8 .8 .8 .8 .8 .8 .8 10.0 Admin 8 .0 25.0 .0 25.0 Admin 9 .0 .0 .0 15.0 .0 .0 .0 .0 .0 .0 .0 .0 .0 15.0 Admin 10 .0 .0 .0 .0 .0 .0 .0 .0 .0 .0 .0 .0 .0 .0 Total Administration 190.0 40.4 15.4 30.4 15.4 15.4 15.4 15.0 15.0 15.0 15.0 15.0 15.0 222.5 Marketing Misc US VP Global Marketing 5.0 .4 .4 .4 .4 .4 .4 .4 .4 .4 .4 .4 .4 5.0 Total Marketing 5.0 .4 .4 .4 .4 .4 .4 .4 .4 .4 .4 .4 .4 5.0 Sales - US .0 Sales 1 US Chief Sales Officer 50.0 4.2 4.2 4.2 4.2 4.2 4.2 4.2 4.2 4.2 4.2 4.2 4.2 50.0 Recruit - Sales Support #2 US Sales Operations Mgr. .0 .0 .0 .0 .0 .0 .0 .0 .0 .0 .0 Salea 2 US VP for iPlan Dedicated Sales 22.5 1.9 1.9 1.9 1.9 1.9 1.9 1.9 1.9 1.9 1.9 1.9 1.9 22.5 Recruit - Team #1 US VP Strategic Solutions - Team #1 19.5 1.6 1.6 1.6 1.6 1.6 1.6 1.6 1.6 1.6 1.6 16.3 Sales 3 US Account Director - Team #1 15.0 1.3 1.3 1.3 1.3 1.3 1.3 1.3 1.3 1.3 1.3 1.3 1.3 15.0 Recruit - Team #1 US Sr Account Manager - Team #1 15.0 1.3 1.3 1.3 1.3 1.3 1.3 1.3 1.3 1.3 11.3 Recruit - Team #1 US Account Manager - Team #1 15.0 1.3 1.3 1.3 1.3 1.3 1.3 7.5 Sales 4 US VP Strategic Solutions - Team #2 37.5 3.1 3.1 3.1 3.1 3.1 3.1 3.1 3.1 3.1 3.1 3.1 3.1 37.5 Sales 5 US Resigned .0 .0 .0 Recruit - Team #2 US Sr Account Manager - Team #2 12.5 1.0 1.0 1.0 1.0 1.0 1.0 1.0 1.0 1.0 9.4 Recruit - Team #2 US Account Manager - Team #2 12.5 1.0 1.0 1.0 1.0 1.0 1.0 6.3 Saels 6 US Account Director - Team #1 10.5 .9 .9 .9 .9 .9 .9 .9 .9 .9 .9 8.8 Sales 7 US Business Development Director .0 .0 .0 .0 .0 .0 .0 .0 .0 .0 .0 .0 .0 .0 Total Sales - US 210.0 10.4 10.4 12.9 15.2 15.2 15.2 17.5 17.5 17.5 17.5 17.5 17.5 184.4 Sales - EU Sales 8 EU VP Strategic Solutions Team #1 30.0 2.5 2.5 2.5 2.5 2.5 2.5 2.5 2.5 2.5 2.5 2.5 2.5 30.0 Sales 9 EU VP Strategic Solutions Team #2 22.5 1.9 1.9 1.9 1.9 1.9 1.9 1.9 1.9 1.9 1.9 1.9 1.9 22.5 Recruit - Team #2 EU Sr Account Manager - Team #2 7.5 .6 .6 .6 .6 .6 .6 .6 4.4 Sales 10 GM VP Strategic Solutions Team #3 22.5 1.9 1.9 1.9 1.9 1.9 1.9 1.9 1.9 1.9 1.9 1.9 1.9 22.5 Sales 11 GM Account Director - Team #1 15.0 1.3 1.3 1.3 1.3 1.3 1.3 1.3 1.3 1.3 1.3 1.3 1.3 15.0 Sales 12 GM Account Director - Team #3 12.5 1.0 1.0 1.0 1.0 1.0 1.0 .0 .0 .0 .0 .0 .0 6.3 Sales 13 GM Sr Account Manager - Team #3 10.0 .8 .8 .8 .8 .8 .8 .8 .8 .8 .8 .8 .8 10.0 Sales 14 GM Sr Account Manager - Team #1 15.0 1.3 1.3 1.3 1.3 1.3 1.3 1.3 1.3 1.3 1.3 1.3 1.3 15.0 Sales 15 GM Account Manager - Team #2 7.5 .6 .6 .6 .6 .6 .6 .6 .6 .6 .6 .6 .6 7.5 Sales 16 GM Sr Account Manager - Team #1 15.0 1.3 1.3 1.3 1.3 1.3 1.3 1.3 1.3 1.3 1.3 1.3 1.3 15.0 Sales 17 BD/UK Business Dev. Manager .0 .0 .0 .0 .0 .0 .0 .0 .0 .0 .0 .0 .0 .0 Total Sales - EU 157.5 12.5 12.5 12.5 12.5 12.5 13.1 12.1 12.1 12.1 12.1 12.1 12.1 148.1 Total Sales 367.5 22.9 22.9 25.4 27.7 27.7 28.3 29.6 29.6 29.6 29.6 29.6 29.6 332.5 Client Operations - US General 70.0 5.8 5.8 5.8 5.8 5.8 5.8 5.8 5.8 5.8 5.8 5.8 5.8 70.0 Total Client Operations - US 70.0 5.8 5.8 5.8 5.8 5.8 5.8 5.8 5.8 5.8 5.8 5.8 5.8 70.0 Client Operations - EU General 80.0 6.7 6.7 6.7 6.7 6.7 6.7 6.7 6.7 6.7 6.7 6.7 6.7 80.0 Total Client Operations - EU 80.0 6.7 6.7 6.7 6.7 6.7 6.7 6.7 6.7 6.7 6.7 6.7 6.7 80.0 Total Client Operations 150.0 12.5 12.5 12.5 12.5 12.5 12.5 12.5 12.5 12.5 12.5 12.5 12.5 150.0 Technology General UKR Project Operator 20.0 1.7 1.7 1.7 1.7 1.7 1.7 1.7 1.7 1.7 1.7 1.7 1.7 20.0 Total Technology 20.0 1.7 1.7 1.7 1.7 1.7 1.7 1.7 1.7 1.7 1.7 1.7 1.7 20.0 Information Research General UKR Jr. Research Manager 10.0 .8 .8 .8 .8 .8 .8 .8 .8 .8 .8 .8 .8 10.0 Total Research 10.0 .8 .8 .8 .8 .8 .8 .8 .8 .8 .8 .8 .8 10.0 BPO Services General UKR Knowledge Specialist 10.0 .8 .8 .8 .8 .8 .8 .8 .8 .8 .8 .8 .8 10.0
  • 12. SME Consulting Dept January-13 February-13 March-13 April-13 May-13 June-13 July-13 August-13 September-13 October-13 November-13 December-13 Total Assumed NB Using Consultnat 2000 Assumed Consulting Rate 10% SME Consultant 10 10 10 10 10 10 17 17 17 17 17 17 160 Total SME Consultant 10,000$ 10,000$ 10,000$ 10,000$ 10,000$ 10,000$ 16,667$ 16,667$ 16,667$ 16,667$ 16,667$ 16,667$ 160,000$ % of Revenue 1.14% 0.99% 1.17% 1.37% 1.30% 0.83% 1.63% 1.61% 1.55% 1.49% 1.31% 1.10% 1.28%
  • 13. Maketing January-13 February-13 March-13 April-13 May-13 June-13 July-13 August-13 September-13 October-13 November-13 December-13 Total website redesign & optimization .0 5.0 5.0 10.0 rebranding .0 .0 .0 analyst .0 .0 .0 .0 .0 .0 .0 .0 .0 .0 .0 .0 .0 advisory boards (client & scientific) .0 .0 .0 .0 .0 .0 .0 .0 .0 .0 .0 .0 .0 website maintenance .0 1.0 1.0 2.0 search engine optimization .0 .0 1.0 .0 1.0 1.0 3.0 adboard meetings (4) .0 2.0 2.0 2.0 6.0 web-based advertising .0 2.5 2.5 5.0 PR Agency (monthly retainer) 8.0 8.0 .0 .0 .0 .0 .0 .0 .0 .0 .0 .0 16.0 webinars (4) .0 .0 2.8 2.8 5.5 event exhibition/sponsorships (1) .0 10.0 10.0 direct marketing .0 .0 .0 1.0 1.0 coop advertising .0 .0 .0 .0 .0 association memberships .0 .5 .5 translation services .0 2.0 2.0 outside consulting services 5.1 5.1 printing 5.0 5.0 product demo videos .0 5.5 5.5 promotional materials 4.2 4.2 sales training .0 .0 .0 outside creative services .0 5.0 5.0 Total Marketing 13.1 13.0 14.2 7.5 12.8 4.0 17.3 .0 3.0 .0 .0 1.0 85.8 % of Revenue 1.49% 1.29% 1.66% 1.03% 1.65% 0.33% 1.69% 0.00% 0.28% 0.00% 0.00% 0.07% 0.69%
  • 14. Silent Partner Loans Germany 1 2 1 1 1 Total Date of Note 6/1/2011 6/1/2011 6/1/2011 6/1/2011 6/1/2011 Note Amount (Euro) 200 500 300 300 260 1560 Note Amt ($ - 1.3) 260 650 390 390 338 2028 Current Int Rate 8.00% 7.50% 7.74% 7.74% 7.74% Date Note due 20% 6/30/2017 6/30/2018 6/30/2019 6/30/2019 6/30/2019 20% 6/30/2018 6/30/2019 6/30/2020 6/30/2020 6/30/2020 60% 6/30/2019 6/30/2020 6/30/2021 6/30/2021 6/30/2021 365/366 day year Interest payment dates Quarter Beg Total # of Total Quarterly Interest Interest Principal Cash End Principal Daily Rate Days Interest Payable Payments Repayment Payment Principal Monthly version on the above schedule: 2012 and 2013 1/1/2013 2028.0 10.5 10.5 2028.0 2/5/2013 2028.0 10.5 21.0 2028.0 3/7/2013 2028.0 10.5 .0 -31.5 2028.0 4/6/2013 2028.0 10.5 10.5 2028.0 5/6/2013 2028.0 10.5 21.0 2028.0 6/5/2013 2028.0 10.5 .0 -31.5 2028.0 7/5/2013 2028.0 10.5 10.5 2028.0 8/4/2013 2028.0 10.5 21.0 2028.0 9/3/2013 2028.0 10.5 .0 -31.5 2028.0 10/3/2013 2028.0 10.5 10.5 2028.0 11/2/2013 2028.0 10.5 21.0 2028.0 12/2/2013 2028.0 10.5 .0 -31.5 2028.0 A-B A C Total Date of Note Note Amount (Euro) 32 42 190 264 Note Amt ($ - 1.3) 42 55 247 343 Current Int Rate 8.00% 8.00% 6.00% Date Note due 365/366 day year Interest payment dates Quarter Beg Total # of Total Quarterly Interest Interest Principal Cash End Principal Daily Rate Days Interest Payable Payments Repayment Payment Principal Monthly version on the above schedule: 2012 and 2013 1/1/2013 343.2 1.9 1.9 343.2 2/5/2013 343.2 1.9 3.8 343.2 3/7/2013 343.2 1.9 .0 -5.6 343.2 4/6/2013 343.2 1.9 1.9 343.2 5/6/2013 343.2 1.9 3.8 343.2 6/5/2013 343.2 1.9 .0 -5.6 343.2 7/5/2013 343.2 1.9 1.9 343.2 8/4/2013 343.2 1.9 3.8 343.2 9/3/2013 343.2 1.9 .0 -5.6 343.2 10/3/2013 343.2 1.9 1.9 343.2 11/2/2013 343.2 1.9 3.8 343.2 12/2/2013 343.2 1.9 .0 -5.6 343.2 For Interest Calculation Purposes For Interest Calculation Purposes
  • 15. Investment Partners SBIC Sela 2, Inc. Date of Note 6/1/2011 Note Amount 3000 Current Int Rate 10.00% PIK Int Rate 2.00% Total Interest 12.00% Applicable Cash Percentage 0.833333333 Date Note due 6/1/2016 365/366 day year Interest payment dates Quarter Beg Total # of Total Quarterly Interest Interest Applicable Cash PIK Principal Cash End Interest Principal Daily Rate Days Interest Payable Payments Interest Due Interest Repayment Payment Principal Receivable Monthly version on the above schedule: 2012 and 2013 1/26/2012 3035.1 30.2 25.2 5.0 3040.2 2/25/2012 3040.2 30.2 25.2 5.0 3045.2 3/26/2012 3045.2 30.2 25.2 5.0 3050.2 4/25/2012 3050.2 30.3 25.3 5.1 3055.3 5/25/2012 3055.3 30.3 25.3 5.1 3060.3 6/24/2012 3060.3 30.3 25.3 5.1 3065.4 7/24/2012 3065.4 30.8 25.7 5.1 3070.5 8/23/2012 3070.5 30.8 25.7 5.1 3075.7 9/22/2012 3075.7 30.8 25.7 5.1 3080.8 10/22/2012 3080.8 31.0 25.8 5.2 3086.0 11/21/2012 3086.0 31.0 25.8 5.2 3091.1 12/21/2012 3091.1 31.0 25.8 5.2 3096.3 1/20/2013 3096.3 30.5 30.5 25.4 5.1 3101.4 2/19/2013 3101.4 30.5 61.1 25.4 5.1 3106.5 3/21/2013 3106.5 30.5 .0 -91.6 25.4 5.1 3111.6 4/20/2013 3111.6 31.0 31.0 25.9 5.2 3116.7 5/20/2013 3116.7 31.0 62.1 25.9 5.2 3121.9 6/19/2013 3121.9 31.0 .0 -93.1 25.9 5.2 3127.1 7/19/2013 3127.1 31.5 31.5 26.3 5.3 3132.3 8/18/2013 3132.3 31.5 63.1 26.3 5.3 3137.6 9/17/2013 3137.6 31.5 .0 -94.6 26.3 5.3 3142.8 10/17/2013 3142.8 31.7 31.7 26.4 5.3 3148.1 11/16/2013 3148.1 31.7 63.4 26.4 5.3 3153.4 12/16/2013 3153.4 31.7 .0 -95.1 26.4 5.3 3158.7 For Interest Calculation Purposes
  • 16. Asset Type Asset Descrip. Year CapitalizedOringial cost Years Depr Method Acc. Depreci Depreciation Depreciation Net Date in Service 12.31.12 Monthly 2013 YTD Assets 12.31.13 Computer Hardware HP equipment 2009 3,608$ 3 Srt Line/Half Yr 3,608$ (0)$ Computer Hardware HP equipment 2009 4,360$ 3 Srt Line/Half Yr 4,360$ (0)$ Computer Hardware HP equipment 2011 6,796$ 3 Srt Line/Half Yr 2,775$ 189$ 189 3,832$ Computer Hardware Server - Ukrn 2012 9,243$ 3 Srt Line/Half Yr 770$ 257$ 257 8,216$ 24,007$ 11,513$ 446$ 446 12,048$ Furniture & Fixtures Office Furniture & Fixt. 2004 11,257$ 7 Srt Line/Half Yr 7,800$ 134$ 134 3,189$ ACCOUNT 1821 Computer Software Caching Servers 2011 25,306$ 3 Srt Line/Half Yr 13,356$ 703$ 703 10,544$ Computer Software Data Loaders 2011 48,211$ 3 Srt Line/Half Yr 25,444$ 1,339$ 1,339 20,089$ Computer Software iMarket 2011 29,905.56$ 3 Srt Line/Half Yr 15,784$ 831$ 831 12,460$ Computer Software iAlliance 2011 18,700.00$ 3 Srt Line/Half Yr 9,869$ 519$ 519 7,792$ Computer Software iPlan 2011 30,444.44$ 3 Srt Line/Half Yr 16,068$ 846$ 846 12,685$ Computer Software iMedical 2011 12,461.11$ 3 Srt Line/Half Yr 6,577$ 346$ 346 5,192$ Computer Software iPerformance 2011 9,777.78$ 3 Srt Line/Half Yr 5,160$ 272$ 272 4,074$ Computer Software MI-KOL 2011 128,006$ 3 Srt Line/Half Yr 67,559$ 3,556$ 3,556 53,335$ Computer Software Version 11.5 2011 300,443$ 3 Srt Line/Half Yr 158,567$ 8,346$ 8,346 125,184$ Computer Software iMarket 3/31/2013 2012 25,000$ 3 Srt Line/Half Yr -$ 694$ - 24,306$ Computer Software iPlan 3/31/2013 2012 25,000$ 3 Srt Line/Half Yr -$ 694$ - 24,306$ Computer Software iMarket 6/30/2013 2012 25,000$ 3 Srt Line/Half Yr -$ 694$ - 24,306$ Computer Software iPlan 6/30/2013 2012 25,000$ 3 Srt Line/Half Yr -$ 694$ - 24,306$ Computer Software iMarket 9/30/2013 2012 25,000$ 3 Srt Line/Half Yr -$ 694$ - 24,306$ Computer Software iPlan 9/30/2013 2012 25,000$ 3 Srt Line/Half Yr -$ 694$ - 24,306$ 753,255$ 318,385$ 20,924$ 16,757 397,189$ Total 788,519$ 337,698$ 21,503$ 17,337 412,427$
  • 17. Consolidated Summary Financials January February March April May June July August September October November December Full Year Revenue Total Software Revenue 310 310 327 327 350 400 424 442 483 490 541 612 5017 Total Data Revenue 569 701 531 403 422 809 596 596 596 630 733 897 7483 Total Revenue 879 1011 858 730 772 1209 1020 1037 1078 1120 1275 1509 12500 Cost of Goods Sold Cost of Sales 104 110 148 122 129 129 136 136 136 136 136 136 1558 Other 36 36 36 36 36 36 43 43 43 43 43 43 472 Total Cost of Goods Sold 140 146 184 158 165 165 179 179 179 179 179 178 2030 Total Gross Profit 740 865 674 572 607 1044 841 859 900 942 1096 1331 10470 Margin % Expenses Payroll Salaries 430 420 454 499 491 536 507 502 496 496 496 496 5822 Payroll Taxes 45 45 46 50 50 53 51 46 46 44 43 41 561 Benefits 20 20 23 27 28 30 31 31 31 31 31 31 333 Bonus Comissions 15 26 39 42 46 59 64 65 69 75 86 104 690 Other Total Payroll 511 510 562 618 614 677 653 644 642 646 656 672 7406 Marketing Marketing 13 13 14 8 13 4 17 3 1 86 Total Marketing 13 13 14 8 13 4 17 3 1 86 Facilities Rent 40 40 40 40 40 40 40 40 40 40 40 40 474 Utilities 9 9 9 9 9 9 6 6 6 6 6 6 91 Other 2 2 2 2 2 2 1 1 1 1 1 1 21 Total Facilities 50 50 50 50 50 50 47 47 47 47 47 47 586 SG&A Dues & Subscriptions 1 1 1 1 1 1 1 1 1 1 1 1 6 Insurance 11 11 11 11 11 11 11 11 11 11 11 11 128 Accounting 16 16 16 16 16 16 16 16 16 16 16 16 186 Legal 11 11 11 11 11 11 11 11 11 11 11 11 126 Telephone & Internet 15 15 15 15 15 16 15 15 15 15 15 15 180 Travel & Entertainment 67 42 60 47 47 48 48 48 48 48 48 48 600 Consulting 2 2 12 22 22 22 22 22 22 22 22 22 217 IT Expense 5 5 5 5 5 5 5 5 5 5 5 5 54 Office Expense 13 13 13 13 13 13 13 13 13 13 13 13 158 Recruiting 5 5 5 5 5 5 5 5 5 5 5 5 54 Postage Equipment Leases 5 5 5 5 5 5 5 5 5 5 5 5 65 Education & Training 3 3 3 3 3 3 3 3 3 3 3 3 31 Bank Charges 6 6 6 6 6 6 6 6 6 6 6 6 70 Other 1 1 1 1 1 1 1 1 1 1 1 1 12 Total SG&A 158 133 161 158 158 159 160 160 160 160 160 160 1887 Total Expenses 732 707 787 835 836 891 877 851 852 853 863 880 9965 EBITDA 7 158 -113 -262 -229 152 -36 8 47 89 233 451 505 Budget Yr Consolidated - Monthly 9/18/2013
  • 18. Consolidated Summary Financials Sales - US Sales -SA Client Ops - US Client Ops - SA Marketing Technolog y BPO Informatio n Research Administr ation Total 2013 Revenue Software iPlan 724 482 1206 iLeader 96 64 161 iMarket 892 595 1487 Other 1298 865 2163 Total Software Revenue 3010 2007 5017 Data R&D Cube iBlkship 468 312 780 iAccess 58 38 96 iOpinion 234 156 391 iField Other 3730 2486 6216 Total Data Revenue 4490 2993 7483 Total Revenue 7500 5000 12500 Cost of Goods Sold Cost of Sales Other 96 64 312 472 Total Cost of Goods Sold 96 64 312 472 Total Gross Profit 7404 4936 -312 12028 Margin % #DIV/0! #DIV/0! #DIV/0! #DIV/0! #DIV/0! #DIV/0! #DIV/0! Expenses Payroll Salaries 1431 1221 608 530 350 1170 116 405 1128 6960 Payroll Taxes 103 101 50 91 35 114 16 89 103 702 Benefits 130 25 78 6 28 49 8 7 85 417 Bonus Comissions 412 278 690 Other Total Payroll 2077 1625 736 627 413 1333 140 502 1316 8769 Marketing Marketing 86 86 Total Marketing 86 86 Facilities Rent 474 474 Utilities 91 91 Other 21 21 Total Facilities 586 586 SG&A Dues & Subscriptions 6 6 Insurance 128 128 Accounting 186 186 Legal 126 126 Telephone & Internet 13 40 9 6 3 19 2 5 98 195 Travel & Entertainment 184 148 70 80 5 20 10 10 223 750 Consulting 190 27 217 IT Expense 54 54 Office Expense 158 158 Recruiting 30 54 84 Postage Equipment Leases 65 65 Education & Training 31 31 Bank Charges 70 70 Other 12 12 Total SG&A 198 188 109 86 8 229 12 15 1237 2082 Total Expenses 2274 1813 845 713 507 1562 152 517 3139 11523 EBITDA 5130 3123 -845 -713 -507 -1562 -152 -829 -3139 505 Non-Operating Taxes Net Interest 523 523 Depreciation/Amortzation 233 233 Other 71 71 Total Non-Operating 827 827 Net Income (Loss) 5130 3123 -845 -713 -507 -1562 -152 -829 -3966 -322
  • 19. Monthly Budget - Administration January February March April May June July August September October November December Full Year Revenue Total Software Revenue Total Data Revenue Total Revenue Cost of Goods Sold Cost of Sales Other Total Cost of Goods Sold Total Gross Profit Margin % Expenses Payroll Salaries 89 89 88 95 95 115 93 93 93 93 93 93 1128 Payroll Taxes 9 9 9 10 10 11 10 8 8 7 7 5 103 Benefits 5 5 5 6 6 8 8 8 8 8 8 8 85 Bonus Comissions Other Total Payroll 103 103 102 111 111 134 111 109 109 108 108 107 1316 Marketing Marketing Total Marketing Facilities Rent 40 40 40 40 40 40 40 40 40 40 40 40 474 Utilities 9 9 9 9 9 9 6 6 6 6 6 6 91 Other 2 2 2 2 2 2 1 1 1 1 1 1 21 Total Facilities 50 50 50 50 50 50 47 47 47 47 47 47 586 SG&A Dues & Subscriptions 1 1 1 1 1 1 1 1 1 1 1 1 6 Insurance 11 11 11 11 11 11 11 11 11 11 11 11 128 Accounting 16 16 16 16 16 16 16 16 16 16 16 16 186 Legal 11 11 11 11 11 11 11 11 11 11 11 11 126 Telephone & Internet 8 8 8 8 8 8 8 8 8 8 8 8 98 Travel & Entertainment 40 15 30 15 15 15 15 15 15 15 15 15 223 Consulting 2 2 2 2 2 2 2 2 2 2 2 2 27 IT Expense 5 5 5 5 5 5 5 5 5 5 5 5 54 Office Expense 13 13 13 13 13 13 13 13 13 13 13 13 158 Recruiting 5 5 5 5 5 5 5 5 5 5 5 5 54 Postage Equipment Leases 5 5 5 5 5 5 5 5 5 5 5 5 65 Education & Training 3 3 3 3 3 3 3 3 3 3 3 3 31 Bank Charges 6 6 6 6 6 6 6 6 6 6 6 6 70 Other 1 1 1 1 1 1 1 1 1 1 1 1 12 Total SG&A 125 100 115 100 100 100 100 100 100 100 100 100 1237 Total Expenses 278 253 267 261 261 285 258 256 256 255 255 254 3139 EBITDA -278 -253 -267 -261 -261 -285 -258 -256 -256 -255 -255 -254 -3139 Non-Operating Taxes Net Interest 43 43 43 43 43 43 44 44 44 44 44 44 523 Depreciation/Amortzation 17 17 17 19 19 19 20 20 20 22 22 22 233 Other 8 3 3 3 3 3 8 8 8 8 8 8 71 Total Non-Operating 68 63 63 65 65 65 72 72 72 74 74 74 827 Net Income (Loss) -347 -317 -331 -326 -326 -350 -330 -328 -328 -329 -329 -327 -3966
  • 20. Monthly Budget - Client Operations Total January February March April May June July August September October November December Full Year Revenue Total Software Revenue Total Data Revenue Total Revenue Cost of Goods Sold Cost of Sales Other Total Cost of Goods Sold Total Gross Profit Margin % #DIV/0! #DIV/0! #DIV/0! #DIV/0! #DIV/0! #DIV/0! #DIV/0! #DIV/0! #DIV/0! #DIV/0! #DIV/0! #DIV/0! #DIV/0! Expenses Payroll Salaries 72 79 85 89 96 96 103 103 103 103 103 103 1138 Payroll Taxes 11 11 12 12 12 12 12 12 12 12 12 11 141 Benefits 7 7 7 7 7 7 7 7 7 7 7 7 84 Bonus Comissions Other Total Payroll 90 97 104 108 115 115 122 122 122 122 122 122 1363 Marketing Marketing Total Marketing Facilities Rent Utilities Other Total Facilities SG&A Dues & Subscriptions Insurance Accounting Legal Telephone & Internet 1 1 1 1 1 1 1 1 1 1 1 1 15 Travel & Entertainment 13 13 13 13 13 13 13 13 13 13 13 13 150 Consulting IT Expense Office Expense Recruiting 30 30 Postage Equipment Leases Education & Training Bank Charges Other Total SG&A 13 13 44 14 14 14 14 14 14 14 14 14 195 Total Expenses 104 110 148 122 129 129 136 136 136 136 136 136 1558 EBITDA -104 -110 -148 -122 -129 -129 -136 -136 -136 -136 -136 -136 -1558 Non-Operating Taxes Net Interest Depreciation/Amortzation Other Total Non-Operating Net Income (Loss) -104 -110 -148 -122 -129 -129 -136 -136 -136 -136 -136 -136 -1558
  • 21. Monthly Budget - Client Ops - US January February March April May June July August September October November December Full Year Revenue Total Software Revenue Total Data Revenue Total Revenue Cost of Goods Sold Cost of Sales Other Total Cost of Goods Sold Total Gross Profit Margin % #DIV/0! #DIV/0! #DIV/0! #DIV/0! #DIV/0! #DIV/0! #DIV/0! #DIV/0! #DIV/0! #DIV/0! #DIV/0! #DIV/0! #DIV/0! Expenses Payroll Salaries 43 43 49 53 53 53 53 53 53 53 53 53 608 Payroll Taxes 4 4 4 4 4 4 4 4 4 4 4 4 50 Benefits 6 6 7 7 7 7 7 7 7 7 7 7 78 Bonus Comissions Other Total Payroll 52 52 60 64 64 64 64 64 64 64 64 63 736 Marketing Marketing Total Marketing Facilities Rent Utilities Other Total Facilities SG&A Dues & Subscriptions Insurance Accounting Legal Telephone & Internet 1 1 1 1 1 1 1 1 1 1 1 1 9 Travel & Entertainment 6 6 6 6 6 6 6 6 6 6 6 6 70 Consulting IT Expense Office Expense Recruiting 30 30 Postage Equipment Leases Education & Training Bank Charges Other Total SG&A 6 6 37 7 7 7 7 7 7 7 7 7 109 Total Expenses 59 59 96 70 70 70 70 70 70 70 70 70 845 EBITDA -59 -59 -96 -70 -70 -70 -70 -70 -70 -70 -70 -70 -845 Non-Operating Taxes Net Interest Depreciation/Amortzation Other Total Non-Operating Net Income (Loss) -59 -59 -96 -70 -70 -70 -70 -70 -70 -70 -70 -70 -845
  • 22. Monthly Budget - Client Ops EU January February March April May June July August September October November December Full Year Revenue Total Software Revenue Total Data Revenue Total Revenue Cost of Goods Sold Cost of Sales Other Total Cost of Goods Sold Total Gross Profit Margin % #DIV/0! #DIV/0! #DIV/0! #DIV/0! #DIV/0! #DIV/0! #DIV/0! #DIV/0! #DIV/0! #DIV/0! #DIV/0! #DIV/0! #DIV/0! Expenses Payroll Salaries 30 36 36 36 44 44 51 51 51 51 51 51 530 Payroll Taxes 8 8 8 8 8 8 8 8 8 8 8 8 91 Benefits 1 1 1 1 1 1 1 1 6 Bonus Comissions Other Total Payroll 38 45 45 45 52 52 59 59 59 59 59 59 627 Marketing Marketing Total Marketing Facilities Rent Utilities Other Total Facilities SG&A Dues & Subscriptions Insurance Accounting Legal Telephone & Internet 1 1 1 1 1 1 6 Travel & Entertainment 7 7 7 7 7 7 7 7 7 7 7 7 80 Consulting IT Expense Office Expense Recruiting Postage Equipment Leases Education & Training Bank Charges Other Total SG&A 7 7 7 7 7 7 7 7 7 7 7 7 86 Total Expenses 45 52 52 52 59 59 66 66 66 66 66 66 713 EBITDA -45 -52 -52 -52 -59 -59 -66 -66 -66 -66 -66 -66 -713 Non-Operating Taxes Net Interest Depreciation/Amortzation Other Total Non-Operating Net Income (Loss) -45 -52 -52 -52 -59 -59 -66 -66 -66 -66 -66 -66 -713
  • 23. Monthly Budget - Sales Total January February March April May June July August September October November December Full Year Revenue Total Software Revenue 310 310 327 327 350 400 424 442 483 490 541 612 5017 Total Data Revenue 569 701 531 403 422 809 596 596 596 630 733 897 7483 Total Revenue 879 1011 858 730 772 1209 1020 1037 1078 1120 1275 1509 12500 Cost of Goods Sold Cost of Sales Other 10 10 10 10 10 10 17 17 17 17 17 17 160 Total Cost of Goods Sold 10 10 10 10 10 10 17 17 17 17 17 17 160 Total Gross Profit 869 1001 848 720 762 1199 1004 1021 1062 1104 1258 1492 12340 Margin % Expenses Payroll Salaries 169 159 187 227 227 237 244 244 239 239 239 239 2652 Payroll Taxes 14 14 15 18 18 20 20 18 18 17 16 16 204 Benefits 8 8 9 12 13 14 15 15 15 15 15 15 156 Bonus Comissions 15 26 39 42 46 59 64 65 69 75 86 104 690 Other Total Payroll 207 207 249 300 304 330 343 343 341 346 356 374 3702 Marketing Marketing Total Marketing Facilities Rent Utilities Other Total Facilities SG&A Dues & Subscriptions Insurance Accounting Legal Telephone & Internet 4 4 4 5 5 5 4 4 4 4 4 4 53 Travel & Entertainment 23 23 25 28 28 28 30 30 30 30 30 30 333 Consulting IT Expense Office Expense Recruiting Postage Equipment Leases Education & Training Bank Charges Other Total SG&A 27 27 30 32 32 33 34 34 34 34 34 34 385 Total Expenses 234 234 279 333 337 363 377 377 375 380 390 408 4088 EBITDA 635 768 569 387 425 835 626 644 686 724 868 1084 8252 Non-Operating Taxes Net Interest Depreciation/Amortzation Other Total Non-Operating Net Income (Loss) 635 768 569 387 425 835 626 644 686 724 868 1084 8252
  • 24. Monthly Budget - Sales US January February March April May June July August September October November December Full Year Total Retail Jobs Revenue Software iPlan 72 72 72 60 60 60 60 60 51 51 51 51 724 iLeader 9 9 9 9 9 9 9 9 7 7 7 7 96 iMarket 90 84 80 80 80 80 80 80 80 55 53 49 892 Other 15 21 35 47 61 91 106 116 151 181 213 260 1298 Total Software Revenue 186 186 196 196 210 240 255 265 290 294 325 367 3010 Data R&D Cube iBlkship 287 84 98 468 iAccess 58 58 iOpinion 136 99 234 iField Other 55 201 220 242 253 330 357 357 358 378 440 538 3730 Total Data Revenue 342 421 319 242 253 485 357 357 358 378 440 538 4490 Total Revenue 528 607 515 438 463 725 612 622 647 672 765 905 7500 Cost of Goods Sold Cost of Sales Other 6 6 6 6 6 6 10 10 10 10 10 10 96 Total Cost of Goods Sold 6 6 6 6 6 6 10 10 10 10 10 10 96 Total Gross Profit 522 601 509 432 457 719 602 612 637 662 755 895 7404 Margin % Expenses Payroll Salaries 74 64 83 123 123 123 140 140 140 140 140 140 1431 Payroll Taxes 6 5 7 10 10 10 12 9 9 9 8 8 103 Benefits 6 6 7 10 11 12 13 13 13 13 13 13 130 Bonus Comissions 24 31 25 20 22 41 33 34 37 40 47 58 412 Other Total Payroll 110 106 121 164 167 187 198 197 199 202 208 219 2077 Marketing Marketing Total Marketing Facilities Rent Utilities Other Total Facilities SG&A Dues & Subscriptions Insurance Accounting Legal Telephone & Internet 1 1 1 1 1 1 1 1 1 1 1 1 13 Travel & Entertainment 10 10 13 15 15 15 18 18 18 18 18 18 184 Consulting IT Expense Office Expense Recruiting Postage Equipment Leases Education & Training Bank Charges Other Total SG&A 11 11 14 16 16 16 19 19 19 19 19 19 198 Total Expenses 121 117 135 180 183 203 216 215 218 221 227 237 2274 EBITDA 400 484 374 252 274 516 386 397 419 441 528 658 5130 Non-Operating Taxes Net Interest Depreciation/Amortzation Other Total Non-Operating Net Income (Loss) 400 484 374 252 274 516 386 397 419 441 528 658 5130
  • 25. Monthly Budget - Sales EU January February March April May June July August September October November December Full Year Total Retail Jobs Revenue Software iPlan 48 48 48 40 40 40 40 40 34 34 34 34 482 iLeader 6 6 6 6 6 6 6 6 5 5 5 5 64 iMarket 60 56 53 53 53 53 53 53 53 37 36 33 595 Other 10 14 23 32 41 61 71 77 101 121 142 173 865 Total Software Revenue 124 124 131 131 140 160 170 177 193 196 217 245 2007 Data R&D Cube iBlkship 191 56 65 312 iAccess 38 38 iOpinion 90 66 156 iField Other 37 134 147 161 169 220 238 238 238 252 293 359 2486 Total Data Revenue 228 280 212 161 169 323 238 238 238 252 293 359 2993 Total Revenue 352 405 343 292 309 483 408 415 431 448 510 604 5000 Cost of Goods Sold Cost of Sales Other 4 4 4 4 4 4 7 7 7 7 7 7 64 Total Cost of Goods Sold 4 4 4 4 4 4 7 7 7 7 7 7 64 Total Gross Profit 348 401 339 288 305 479 401 408 425 442 503 597 4936 Margin % Expenses Payroll Salaries 95 95 104 104 104 114 104 104 99 99 99 99 1221 Payroll Taxes 8 8 8 8 8 10 8 8 8 8 8 8 101 Benefits 2 2 2 2 2 2 2 2 2 2 2 2 25 Bonus Comissions -8 -5 14 22 23 18 31 31 33 34 39 46 278 Other Total Payroll 97 101 128 136 138 144 146 146 142 144 148 156 1625 Marketing Marketing Total Marketing Facilities Rent Utilities Other Total Facilities SG&A Dues & Subscriptions Insurance Accounting Legal Telephone & Internet 4 4 4 4 4 4 3 3 3 3 3 3 40 Travel & Entertainment 13 13 13 13 13 13 12 12 12 12 12 12 148 Consulting IT Expense Office Expense Recruiting Postage Equipment Leases Education & Training Bank Charges Other Total SG&A 16 16 16 16 16 17 15 15 15 15 15 15 188 Total Expenses 113 117 144 152 154 160 161 162 157 159 163 171 1813 EBITDA 235 284 195 136 151 319 240 247 267 283 340 426 3123 Non-Operating Taxes Net Interest Depreciation/Amortzation Other Total Non-Operating Net Income (Loss) 235 284 195 136 151 319 240 247 267 283 340 426 3123 Budget Yr Sales (SA) - Monthly 9/18/2013
  • 26. Monthly Budget - Technology January February March April May June July August September October November December Full Year Revenue Software Technology Data Consulting Total Revenue Cost of Goods Sold Cost of Sales Other Total Cost of Goods Sold Total Gross Profit Margin % #DIV/0! #DIV/0! #DIV/0! #DIV/0! #DIV/0! #DIV/0! #DIV/0! #DIV/0! #DIV/0! #DIV/0! #DIV/0! #DIV/0! #DIV/0! Expenses Payroll Salaries 88 88 100 100 100 109 98 98 98 98 98 98 1170 Payroll Taxes 9 9 10 10 10 10 10 10 10 10 9 9 114 Benefits 3 3 4 4 4 4 4 4 4 4 4 4 49 Bonus Comissions Other Total Payroll 100 100 114 114 114 123 112 112 112 112 111 111 1333 Marketing Marketing Total Marketing Facilities Rent Utilities Other Total Facilities SG&A Dues & Subscriptions Insurance Accounting Legal Telephone & Internet 2 2 2 2 2 2 2 2 2 2 2 2 19 Travel & Entertainment 2 2 2 2 2 2 2 2 2 2 2 2 20 Consulting 10 20 20 20 20 20 20 20 20 20 190 IT Expense Office Expense Recruiting Postage Equipment Leases Education & Training Bank Charges Other Total SG&A 3 3 13 23 23 23 23 23 23 23 23 23 229 Total Expenses 103 103 127 137 137 147 135 135 135 135 134 134 1562 EBITDA -103 -103 -127 -137 -137 -147 -135 -135 -135 -135 -134 -134 -1562 Non-Operating Taxes Net Interest Depreciation/Amortzation Other Total Non-Operating Net Income (Loss) -103 -103 -127 -137 -137 -147 -135 -135 -135 -135 -134 -134 -1562 Budget Yr Technology - Monthly 9/18/2013
  • 27. Monthly Budget - Information Research January February March April May June July August September October November December Full Year Revenue Total Software Revenue -$ -$ -$ -$ -$ -$ -$ -$ -$ -$ -$ -$ -$ Total Data Revenue -$ -$ -$ -$ -$ -$ -$ -$ -$ -$ -$ -$ -$ Total Revenue -$ -$ -$ -$ -$ -$ -$ -$ -$ -$ -$ -$ -$ Cost of Goods Sold Cost of Sales -$ -$ -$ -$ -$ -$ -$ -$ -$ -$ -$ -$ -$ Other 26,000 26,000 26,000 26,000 26,000 26,000 26,000 26,000 26,000 26,000 26,000 26,000 312,000 Total Cost of Goods Sold 26,000$ 26,000$ 26,000$ 26,000$ 26,000$ 26,000$ 26,000$ 26,000$ 26,000$ 26,000$ 26,000$ 26,000$ 312,000$ Total Gross Profit (26,000)$ (26,000)$ (26,000)$ (26,000)$ (26,000)$ (26,000)$ (26,000)$ (26,000)$ (26,000)$ (26,000)$ (26,000)$ (26,000)$ (312,000)$ Margin % #DIV/0! #DIV/0! #DIV/0! #DIV/0! #DIV/0! #DIV/0! #DIV/0! #DIV/0! #DIV/0! #DIV/0! #DIV/0! #DIV/0! #DIV/0! Expenses Payroll Salaries 33,458$ 33,458$ 36,458$ 33,558$ 33,558$ 33,558$ 33,558$ 33,558$ 33,558$ 33,558$ 33,558$ 33,558$ 405,398$ Payroll Taxes 7,404 7,404 7,454 7,470 7,470 7,470 7,470 7,470 7,470 7,470 7,470 7,470 89,495 Benefits 317 317 574 659 659 659 659 659 659 659 659 659 7,139 Bonus - - - - - - - - - - - - - Comissions - - - - - - - - - - - - - Other - Odesk - - - - - - - - - - - - - Total Payroll 41,179$ 41,179$ 44,485$ 41,688$ 41,688$ 41,688$ 41,688$ 41,688$ 41,688$ 41,688$ 41,688$ 41,688$ 502,032$ Marketing Marketing - - - - - - - - - - - - - Total Marketing -$ -$ -$ -$ -$ -$ -$ -$ -$ -$ -$ -$ -$ Facilities Rent -$ -$ -$ -$ -$ -$ -$ -$ -$ -$ -$ -$ -$ Utilities - - - - - - - - - - - - - Other - - - - - - - - - - - - - Total Facilities -$ -$ -$ -$ -$ -$ -$ -$ -$ -$ -$ -$ -$ SG&A Dues & Subscriptions -$ -$ -$ -$ -$ -$ -$ -$ -$ -$ -$ -$ -$ Insurance - - - - - - - - - - - - - Accounting - - - - - - - - - - - - - Legal - - - - - - - - - - - - - Telephone & Internet 435 435 435 375 375 375 375 375 375 375 375 375 4,680 Travel & Entertainment 833 833 833 833 833 833 833 833 833 833 833 833 10,000 Consulting - - - - - - - - - - - - - IT Expense - - - - - - - - - - - - - Office Expense - - - - - - - - - - - - - Recruiting - - - - - - - - - - - - - Postage - - - - - - - - - - - - - Equipment Leases - - - - - - - - - - - - - Education & Training - - - - - - - - - - - - - Bank Charges - - - - - - - - - - - - - Other - - - - - - - - - - - - - Total SG&A 1,268$ 1,268$ 1,268$ 1,208$ 1,208$ 1,208$ 1,208$ 1,208$ 1,208$ 1,208$ 1,208$ 1,208$ 14,680$ Total Expenses 42,447$ 42,447$ 45,754$ 42,896$ 42,896$ 42,896$ 42,896$ 42,896$ 42,896$ 42,896$ 42,896$ 42,896$ 516,712$ EBITDA (68,447)$ (68,447)$ (71,754)$ (68,896)$ (68,896)$ (68,896)$ (68,896)$ (68,896)$ (68,896)$ (68,896)$ (68,896)$ (68,896)$ (828,712)$ Non-Operating Taxes -$ -$ -$ -$ -$ -$ -$ -$ -$ -$ -$ -$ - Net Interest - - - - - - - - - - - - - Depreciation/Amortzation - - - - - - - - - - - - - Other - - - - - - - - - - - - - Total Non-Operating -$ -$ -$ -$ -$ -$ -$ -$ -$ -$ -$ -$ -$ Net Income (Loss) (68,447)$ (68,447)$ (71,754)$ (68,896)$ (68,896)$ (68,896)$ (68,896)$ (68,896)$ (68,896)$ (68,896)$ (68,896)$ (68,896)$ (828,712)$
  • 28. Monthly Budget - BPO Services January February March April May June July August September October November December Full Year Revenue Total Software Revenue Total Data Revenue Total Revenue Cost of Goods Sold Cost of Sales Other Total Cost of Goods Sold Total Gross Profit Margin % #DIV/0! #DIV/0! #DIV/0! #DIV/0! #DIV/0! #DIV/0! #DIV/0! #DIV/0! #DIV/0! #DIV/0! #DIV/0! #DIV/0! #DIV/0! Expenses Payroll Salaries 10 10 10 10 10 10 10 10 10 10 10 10 116 Payroll Taxes 1 1 1 1 1 1 1 1 1 1 1 1 16 Benefits 1 1 1 1 1 1 1 1 1 1 1 1 8 Bonus Comissions Other Total Payroll 12 12 12 12 12 12 12 12 12 12 12 12 140 Marketing Marketing Total Marketing Facilities Rent Utilities Other Total Facilities SG&A Dues & Subscriptions Insurance Accounting Legal Telephone & Internet 2 Travel & Entertainment 1 1 1 1 1 1 1 1 1 1 1 1 10 Consulting IT Expense Office Expense Recruiting Postage Equipment Leases Education & Training Bank Charges Other Total SG&A 1 1 1 1 1 1 1 1 1 1 1 1 12 Total Expenses 13 13 13 13 13 13 13 13 13 13 13 13 152 EBITDA -13 -13 -13 -13 -13 -13 -13 -13 -13 -13 -13 -13 -152 Non-Operating Taxes Net Interest Depreciation/Amortzation Other Total Non-Operating Net Income (Loss) -13 -13 -13 -13 -13 -13 -13 -13 -13 -13 -13 -13 -152 Budget Yr BPO Services - Monthly 9/18/2013
  • 29. New Business January February March April May June July AugustSeptemberOctoberNovemberDecemberFull Year Pipe Line 1 Year - 3 Year 3 Months New Business - Projection 1 Year 150 210 240 210 240 450 285 240 450 312 375 810 3973 3 Year 75 105 120 105 120 225 143 120 225 312 375 375 2300 3 Months 275 385 440 385 440 825 523 440 825 625 750 1315 7227 500 700 800 700 800 1500 950 800 1500 1250 1500 2500 13500 Total 1 Year 150 210 240 210 240 450 285 240 450 312 375 810 3973 3 Year 75 105 120 105 120 225 143 120 225 312 375 375 2300 3 Months 275 385 440 385 440 825 523 440 825 625 750 1315 7227 500 700 800 700 800 1500 950 800 1500 1250 1500 2500 13500 Billing January February March April May June July AugustSeptemberOctoberNovemberDecemberFull Year 1 Year 60 60 30 150 84 84 42 210 96 96 48 240 84 84 42 210 96 96 48 240 180 180 90 450 114 114 285 96 96 240 180 180 450 125 312 150 375 324 810 60 84 96 144 180 276 228 234 408 281 294 594 3973 3 Year 10 10 5 75 14 14 7 105 16 16 8 120 14 14 7 105 16 16 8 120 30 30 15 225 19 19 143 16 16 120 30 30 225 42 312 50 375 50 375 10 14 16 24 30 46 38 39 68 68 74 95 2300 3 Month 92 183 275 128 257 385 147 293 440 128 257 385 147 293 440 275 550 825 174 348 523 147 293 440 275 550 825 208 625 250 750 438 1315 92 128 147 312 403 568 431 440 825 557 543 988 7227 NB Billing 162 226 259 480 613 890 697 713 1301 905 911 1677 8835 NB Collection 81 194 243 369 546 752 794 705 1007 1103 908 6702 BackLog Collection 1321 620 916 399 183 328 270 332 118 44 427 70 5029 BackLog Billing 355 657 291 255 299 301 225 81 236 249 99 129 3178 Accounts Receivable January February March April May June July August September October NovemberDecember Full Year Opening Balance 2044 1239 1422 862 956 1316 1633 1533 1202 1915 2018 1498 2044 Total Billing 516 884 549 735 912 1191 922 794 1537 1154 1010 1807 12012 Total Collection 1321 701 1110 641 552 875 1022 1126 823 1051 1530 979 11730 AR Balance 1239 1422 862 956 1316 1633 1533 1202 1915 2018 1498 2326 2326
  • 30. Cash Flow Extract January February March April May June July August September October November December Cash from or used in operating activities Receipts for Customer 1321 701 1110 641 552 875 1022 1126 823 1051 1530 979 Other Receipts Less Payroll Less Comm -495 -484 -523 -576 -569 -619 -589 -578 -573 -571 -570 -568 Commission -34 -36 -50 -44 -48 -84 -68 -67 -86 -85 -108 -130 Facilities Expenes -50 -50 -50 -50 -50 -50 -47 -47 -47 -47 -47 -47 Cost of Sales -140 -146 -184 -158 -165 -165 -179 -179 -179 -179 -179 -178 Accounts Payable -150 -150 -180 -242 -188 -188 -188 -188 -188 -188 -188 -188 Interest to Finance Institution -113 -115 -116 -116 Net Operating Cash Flow 452 -166 9 -429 -469 -346 -49 66 -365 -19 438 -249 Financing Activities Short-Term Loan Payment Capital Expenditure -25 -25 -50 Net Cash from Financing -25 -25 -50 Net Cash Flow 452 -166 -16 -429 -469 -371 -49 66 -415 -19 438 -249 Add:Opening Balance 59 510 345 328 -101 -569 -940 -989 -923 -1338 -1358 -920 Closing Balance 510 345 328 -101 -569 -940 -989 -923 -1338 -1358 -920 -1169 Deferred Revenue January February March April May June July August September October November December Full Year 963 Opening 963 601 473 164 169 310 292 194 -49 409 443 178 12012 Add:Billing 516 884 549 735 912 1191 922 794 1537 1154 1010 1807 12500 Less:Revenue 879 1011 858 730 772 1209 1020 1037 1078 1120 1275 1509 476 Closing Balance 601 473 164 169 310 292 194 -49 409 443 178 476 Accounts Payable January February March April May June July August September October November December Full Year 524 Opening 524 553 552 550 477 463 442 439 419 401 381 361 1887 Add:S G & A 158 133 161 158 158 159 160 160 160 160 160 160 86 Marketing 13 13 14 8 13 4 17 3 1 71 Other 8 3 3 3 3 3 8 8 8 8 8 8 2226 Less:Payments 150 150 180 242 188 188 188 188 188 188 188 188 341 Closing Balance 553 552 550 477 463 442 439 419 401 381 361 341 Interest Expenes January February March April May June July August September October November December Full Year Opening Balance 38 76 38 76 39 77 39 78 374 Add:Expenses 31 31 31 31 31 31 32 32 32 32 32 32 62 Less: PIK 5 5 5 5 5 5 5 5 5 5 5 5 23 Add: Silent Partner (1) 2 2 2 2 2 2 2 2 2 2 2 2 126 Add: Silent Partner (2) 10 10 10 10 10 10 10 10 10 10 10 10 460 Less:Payments 113 115 116 116 Closing Balance Payable 38 76 38 76 39 77 39 78 Investment Partners January February March April May June July August September October November December Full Year 3052 Opening Balance 3052 3057 3062 3067 3073 3078 3083 3088 3093 3099 3104 3109 62 Add:PIK 5 5 5 5 5 5 5 5 5 5 5 5 Less:Payments 3115 Closing Balance 3057 3062 3067 3073 3078 3083 3088 3093 3099 3104 3109 3115
  • 31. Balance Sheet Dec-12 January February March April May June July August September October November December ASSETS Current Assets Cash and Cash Equivalents 59 510 345 328 -101 -569 -940 -989 -923 -1338 -1358 -920 -1169 Accounts Receivable 2044 1239 1422 862 956 1316 1633 1533 1202 1915 2018 1498 2326 Deferred Commission 86 108 135 156 166 181 234 242 236 279 299 325 408 Other Assets 670 670 670 670 670 670 670 670 670 670 670 670 670 Total Current Assets 2859 2528 2571 2016 1691 1597 1597 1455 1185 1526 1629 1573 2235 Property and Equipment, HW/SW Net 1537 1520 1502 1510 1491 1473 1479 1459 1439 1469 1447 1426 1404 Intangible Assets, Net 8045 8045 8045 8045 8045 8045 8045 8045 8045 8045 8045 8045 8045 Security Deposits 110 110 110 110 110 110 110 110 110 110 110 110 110 TOTAL ASSETS 12551 12203 12229 11682 11338 11226 11231 11070 10779 11150 11231 11154 11795 LIABILITIES AND STOCKHOLDERS' EQUITY Liabilities Current Liabilities Accounts Payable 524 553 552 550 477 463 442 439 419 401 381 361 341 Accrued Commission 87 90 107 116 125 137 165 169 162 189 198 202 260 Accrued Expenses/Provisions & Other Liabilities736 774 812 736 775 813 736 775 814 736 775 814 736 Notes Payable 356 356 356 356 356 356 356 356 356 356 356 356 356 Deferred Revenue 963 601 473 164 169 310 292 194 -49 409 443 178 476 Total Current Liabilities 2666 2374 2300 1923 1901 2078 1992 1933 1701 2092 2153 1910 2169 Capitalized Lease Obligations 7 7 7 7 7 7 7 7 7 7 7 7 7 Loan Agreement - Silent Partnership 1875 1875 1875 1875 1875 1875 1875 1875 1875 1875 1875 1875 1875 Long Term Debt 3052 3057 3062 3067 3073 3078 3083 3088 3093 3099 3104 3109 3115 Total Liabilities 7600 7313 7244 6873 6856 7038 6957 6903 6677 7073 7139 6902 7166 Stockholders' Equity Stocks 10250 10250 10250 10250 10250 10250 10250 10250 10250 10250 10250 10250 10250 Additional Paid In Capital Accumulated Deficit -2295 -4954 -4954 -4954 -4954 -4954 -4954 -4954 -4954 -4954 -4954 -4954 -4954 Fiscal YTD Income (Deficit) -2659 -61 34 -142 -469 -763 -676 -784 -849 -873 -858 -699 -322 Other Comprehensive Income - Foreign Currency Translation Difference -345 -345 -345 -345 -345 -345 -345 -345 -345 -345 -345 -345 -345 Total Stockholders' Equity 4951 4890 4985 4809 4481 4187 4274 4166 4102 4077 4092 4252 4629 TOTAL LIABILITIES AND STOCKHOLDERS' EQUITY12551 12203 12229 11682 11338 11226 11231 11070 10779 11150 11231 11154 11795
  • 32. Cash Flow Dec-12 January February March April May June July August September October November December Full Year NET INCOME 209 -61 95 -176 -328 -294 87 -108 -64 -25 15 159 377 -322 Add: Non-Cash Expenses -269 17 17 17 19 19 19 20 20 20 22 22 22 233 (Depreciation, Amortization, etc) Add: Working Capital -206 490 -283 162 -125 -198 -457 34 105 -366 -61 252 -653 -1101 Cash from Operating Activities -267 447 -171 4 -434 -474 -351 -54 61 -371 -24 433 -254 -1190 Capital Expenditure Sale of Fixed Assets Cash from Investing Activies Invested Capital 5 5 5 5 5 5 5 5 5 5 5 5 62 Other 193 -25 -25 -50 -100 Cash from Financing Activies 193 5 5 -20 5 5 -20 5 5 -45 5 5 5 -38 Beginning Cash Balance 133 59 510 345 328 -101 -569 -940 -989 -923 -1338 -1358 -920 59 Net Cash Flow -74 452 -166 -16 -429 -469 -371 -49 66 -415 -19 438 -249 -1227 Ending Cash Balance 59 510 345 328 -101 -569 -940 -989 -923 -1338 -1358 -920 -1169 -1169