Problem 8: Crashing a project network
•Transferir como XLSX, PDF•
0 gostou•471 visualizações


Recomendados
Mais conteúdo relacionado
Destaque
Semelhante a Problem 8: Crashing a project network
Semelhante a Problem 8: Crashing a project network (8)
Mais de Sameer Alam
Último
Último (20)
Problem 8: Crashing a project network
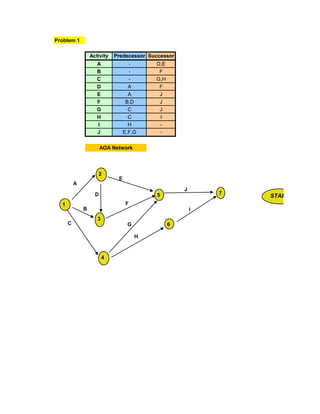
- 1. Problem 1 Activity Predecessor Successor A - D,E B - F C - G,H D A F E A J F B,D J G C J H C I I H - J E,F,G - AOA Network 2 E A J D 5 7 START 1 F B I 3 C G 6 H 4
- 2. AON Network A E D START B F J END G C H I
- 3. Problem 2 Activity Predecessor Successor a - c,f b - d,e c a h d b h e b h f a i g b i h c,d,e i i f,g,h - AOA Network 6 f h 2 i c a 5 g 7 1 d 3 b e 4 AON Network a f c START d h END i e b g
- 4. In the AOA Network representation a dummy task has to be incorporated into the network to allow for two predecessors of the task e. No such requirement is found in the AON representation. It appears that an AON representation is much easier than AOA.
- 5. Problem 7 Duration - 3 estimates Most Optimistic Likely Pessimistic Activity Predecessor (months) (months) (months) a - 2 4 9 b - 2 3 8 c b 4 7 14 d a 4 5 16 e b 5 7 12 f c,d 2 4 8 g c,d 6 8 14 h e,f 6 7 14 i g,h 2 3 9 Estimated (a) Activity Time Variance S.D. a 4.50 1.361 1.17 b 3.67 1.000 1.00 c 7.67 2.778 1.67 d 6.67 4.000 2.00 e 7.50 1.361 1.17 f 4.33 1.000 1.00 g 8.67 1.778 1.33 h 8.00 1.778 1.33 I 3.83 1.361 1.17 (b) AOA Network a:4.50 2 d:6.67 1 g:8.67 i:3.83 4 6 c:7.67 f:4.33 b:3.67 3 5 h:8.00 e:7.50 Estimated (c) Path Time Variance S.D. 3.83 1-2-4-6-7 23.67 8.500 2.92 0.17 1-2-4-5-6-7 27.33 9.500 3.08
- 6. 27.50 1-3-4-5-6-7 27.50 7.917 2.81 3.67 1-3-4-6-7 23.83 6.917 2.63 4.50 1-3-5-6-7 23.00 5.500 2.35 From the above table we see that the critical path is 1-2-4- 5-6-7 and the nearly critical path is 1-3-4-5-6-7 (d) Due date D = 36 Estimated time T = 27.50 Standard Deviation 3 2.81 Standard normal variate = 3.020979 Probability of completion in 40 months = 99.87 (e) Probability of completion = 0.8 Standard normal variate = 0.842 Estimated time T = 2 27.33 SD = 3.08 Due date D = 29.93 (f) For reduction in the project duration, activities on the critical path can be reviewed for crashing options.The firm must investigate methods that enables it to reduce the variance of some of the activities on the critical path. (g) The probability of completion in 36 months, on the near critical path is : Due date D = 36 Estimated time T = 27.33 Standard Deviation 3.08 Standard normal variate = 2.811838 Probability of completion in 36 months = 99.75 It is interesting to note that a near-critical path can potentially bring down the probability of completion compared to a critical path due to high path variance. Therefore the notion of an official critical path in PERT is not the same as in a CPM method.
- 7. What-if ?? Change the activity durations to assess the impact i:3.83 7
- 8. ritical path is 1-2-4- This observation does not hold if you change the 1-3-4-5-6-7 activity durations. months months % months months activities on the hing options.The firm it to reduce the the critical path. nths, on the near months months % critical path can of completion h path variance. itical path in PERT
- 9. Problem 8 Normal Crash Duration Duration Normal Crash Activity Predecessor (weeks) (weeks) Cost (Rs.) Cost (Rs.) a - 6 5 10,000 15,000 b - 4 3 12,000 14,000 c a 5 n.a. 16,000 n.a. d b 3 n.a. 18,000 n.a. e c 4 2 11,000 17,000 f d 4 2 24,000 32,000 g c 4 3 12,000 18,000 h d 9 6 50,000 68,000 i e,f 2 n.a. 16,000 n.a. j g,h,i 3 2 10,000 11,000 Indirect cost for the project per week (Rs.) 6,000 AON Network 4 g a: c e 6 5 START 4 f b d 4 4 3 h 9 We evaluate our options by the following table: Crash Normal Crash Max. Normal Time Time Cost NC Cost CC Crashing Activity (Weeks) (Weeks) (Rs.) (Rs.) (Weeks) a 6 5 10,000 15,000 1
- 10. b 4 3 12,000 14,000 1 c 5 n.a. 16,000 n.a. 0 d 3 n.a. 18,000 n.a. 0 e 4 2 11,000 17,000 2 f 4 2 24,000 32,000 2 g 4 3 12,000 18,000 1 h 9 6 50,000 68,000 3 i 2 n.a. 16,000 n.a. 0 j 3 2 10,000 11,000 1 Sum of the normal costs for all the activities in the above table con the direct cost without crashing The indirect cost is @ Rs. 6000 per week charged for the project dura weeks Crashable No. of Activities on Activitiy weeks Direct Project No. Critical path Crashed crashed Cost Duration 1 a,c,e,i,j None 0 179,000 20 2 a,c,e,i j 1 180,000 19 3 a,c,i e 2 186,000 17 4 c,i a 1 191,000 16 Therefore we find the optimum cost to be (Rs.) Savings obtained by crashing activities (Rs.) PREVIOUS SOLUTION
- 11. What-if ?? Change the cost structure to assess the impact 3 2 i j FINISH Crashing Cost/week 5000
- 12. 2000 n.a. n.a. 3000 4000 6000 6000 n.a. 1000 in the above table constitutes ed for the project duration of 20 Indirect Cost Total Cost 120,000 299,000 114,000 294,000 102,000 288,000 96,000 287,000 287,000 12,000 NEXT SOLUTION