SlideShare uma empresa Scribd logo
1 de 1
Baixar para ler offline
Valentine’s Day

love

For

money ?

or

At SAP, we are always intrigued by the data that surrounds us.
This Valentine’s Day, how do various Asia Pacific markets measure up against one another?

Chocolate

Source:
International
Trade
Centre

Annual cocoa imports for chocolate
and food preparation (USD)
HONG
KONG

2.6

12.0

NEW
ZEALAND

0.1

AUSTRALIA
INDIA

19.1%

KOREA

JAPAN

4.1

0.04

Property value fluctuations from Q2 2012 to Q2 2013

5.3

11.6

0.01

Property

12.63

1.0

INDONESIA

14.8%

0.002

INDONESIA

INDIA

Annual import
of bouquets or
ornaments per
capita (USD)

0.02

0.3
0.3

NEW
ZEALAND

1.01%
INDIA

CHINA

NEW ZEALAND

Travel

2.2%

Tourism expenditures
per capita (USD)
Source:

14.8
KOREA

Source:
Manulife
Investor
Sentiment
Index 3Q 2013

1.8%

47%

29%

MALAYSIA

JAPAN

68 %

SINGAPORE

2.3%

62%

KOREA

58%
ONG

The World Bank
2009-2013

JAPAN

9.6

People who have started
retirement planning

Source:
United Nations
1.9%
Demographic
SINGAPORE
Yearbook 2012
and Wikipedia
Divorce
1.9%
Demography NEW ZEALAND

AUSTRALIA

CHINA

8.0

SINGAPORE

NEW ZEALAND

JAPAN

Source:
International
Trade Centre

1.6%

5.9

MALAYSIA
KOREA

Savings

MALAYSIA

AUSTRALIA

INDONESIA
0.6
MALAYSIA
0.8
SINGAPORE
1.6
INDIA
2.6

JAPAN
INDONESIA

Divorce rates

KOREA

SINGAPORE

Consumption
per capita (liters)

4.5%

0.2

1.3

Alcohol

INDIA

AUSTRALIA

JAPAN

6.85

CHINA

CHINA

3.5

8.4%

-2.2%
-1.5%

HONG
KONG

0.001

Flowers

6.0%

5.9%

5.1%

CHINA

10.0

12.1%

SINGAPORE

MALAYSIA

Source: Knight Frank
Global House Price Index

SIA
INDONE

H
KONG

50%

AUSTRALIA

Source: WHO
Global Status
Report On
Alcohol and
Health 2011

2,690

73% 73%

1523

CHINA

AUSTRALIA

398

HONG KONG

SINGAPORE

80

59

NEW
ZEALAND

CHINA

31

JAPAN

11

44

37

KOREA
INDIA

4

MALAYSIA

INDONESIA

CHINA

Stress

People who found work as
the primary trigger of stress
63%

SINGAPORE

HONG
KONG

INDONESIA

Figures from the Population Reference Bureau
are used for per capita calculations

62%

Take a look at your world.
Visualize your data and discover
answers with SAP Lumira for free.

Source:
Regus Stress
57% Whitepaper
MALAYSIA Aug 2012

insightmeetsinstinct.com

Mais conteúdo relacionado

Mais de SAP Asia Pacific

Enterprise Mobility Transforming Public Service and Citizen Engagement
Enterprise Mobility Transforming Public Service and Citizen EngagementEnterprise Mobility Transforming Public Service and Citizen Engagement
Enterprise Mobility Transforming Public Service and Citizen EngagementSAP Asia Pacific
 
Big Plans for Big Data in Public Sector
Big Plans for Big Data in Public SectorBig Plans for Big Data in Public Sector
Big Plans for Big Data in Public SectorSAP Asia Pacific
 
Closing the Big Data Gap in Public Sector
Closing the Big Data Gap in Public SectorClosing the Big Data Gap in Public Sector
Closing the Big Data Gap in Public SectorSAP Asia Pacific
 
HR Business Excellence in the Cloud
HR Business Excellence in the CloudHR Business Excellence in the Cloud
HR Business Excellence in the CloudSAP Asia Pacific
 
Utilities and The Customer Connection
Utilities and The Customer ConnectionUtilities and The Customer Connection
Utilities and The Customer ConnectionSAP Asia Pacific
 
10 Ways Enterprise Mobility Can Transform Government
10 Ways Enterprise Mobility Can Transform Government10 Ways Enterprise Mobility Can Transform Government
10 Ways Enterprise Mobility Can Transform GovernmentSAP Asia Pacific
 
Shopping for Business Success
Shopping for Business SuccessShopping for Business Success
Shopping for Business SuccessSAP Asia Pacific
 
Real Time Customer Insights
Real Time Customer InsightsReal Time Customer Insights
Real Time Customer InsightsSAP Asia Pacific
 
Are You Listening To Your Customers? Engage Customers Like Never Before.
Are You Listening To Your Customers? Engage Customers Like Never Before.Are You Listening To Your Customers? Engage Customers Like Never Before.
Are You Listening To Your Customers? Engage Customers Like Never Before.SAP Asia Pacific
 
SAP Mobile Consumer Survey Report_APAC
SAP Mobile Consumer Survey Report_APACSAP Mobile Consumer Survey Report_APAC
SAP Mobile Consumer Survey Report_APACSAP Asia Pacific
 
Nine Easy Steps for a Quick Customer Experience Tune-up
Nine Easy Steps for a Quick Customer Experience Tune-upNine Easy Steps for a Quick Customer Experience Tune-up
Nine Easy Steps for a Quick Customer Experience Tune-upSAP Asia Pacific
 
Customer analytics infographic
Customer analytics infographicCustomer analytics infographic
Customer analytics infographicSAP Asia Pacific
 

Mais de SAP Asia Pacific (14)

Enterprise Mobility Transforming Public Service and Citizen Engagement
Enterprise Mobility Transforming Public Service and Citizen EngagementEnterprise Mobility Transforming Public Service and Citizen Engagement
Enterprise Mobility Transforming Public Service and Citizen Engagement
 
Big Plans for Big Data in Public Sector
Big Plans for Big Data in Public SectorBig Plans for Big Data in Public Sector
Big Plans for Big Data in Public Sector
 
Closing the Big Data Gap in Public Sector
Closing the Big Data Gap in Public SectorClosing the Big Data Gap in Public Sector
Closing the Big Data Gap in Public Sector
 
HR Business Excellence in the Cloud
HR Business Excellence in the CloudHR Business Excellence in the Cloud
HR Business Excellence in the Cloud
 
Utilities and The Customer Connection
Utilities and The Customer ConnectionUtilities and The Customer Connection
Utilities and The Customer Connection
 
Your Cloud Your Way
Your Cloud Your WayYour Cloud Your Way
Your Cloud Your Way
 
A Community in The Cloud
A Community in The CloudA Community in The Cloud
A Community in The Cloud
 
10 Ways Enterprise Mobility Can Transform Government
10 Ways Enterprise Mobility Can Transform Government10 Ways Enterprise Mobility Can Transform Government
10 Ways Enterprise Mobility Can Transform Government
 
Shopping for Business Success
Shopping for Business SuccessShopping for Business Success
Shopping for Business Success
 
Real Time Customer Insights
Real Time Customer InsightsReal Time Customer Insights
Real Time Customer Insights
 
Are You Listening To Your Customers? Engage Customers Like Never Before.
Are You Listening To Your Customers? Engage Customers Like Never Before.Are You Listening To Your Customers? Engage Customers Like Never Before.
Are You Listening To Your Customers? Engage Customers Like Never Before.
 
SAP Mobile Consumer Survey Report_APAC
SAP Mobile Consumer Survey Report_APACSAP Mobile Consumer Survey Report_APAC
SAP Mobile Consumer Survey Report_APAC
 
Nine Easy Steps for a Quick Customer Experience Tune-up
Nine Easy Steps for a Quick Customer Experience Tune-upNine Easy Steps for a Quick Customer Experience Tune-up
Nine Easy Steps for a Quick Customer Experience Tune-up
 
Customer analytics infographic
Customer analytics infographicCustomer analytics infographic
Customer analytics infographic
 

What are the numbers behind Valentine’s Day?

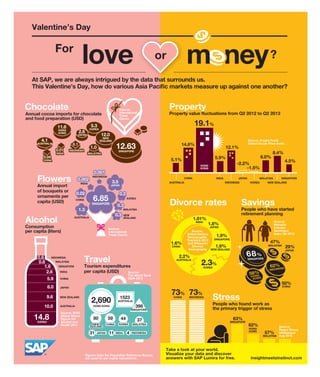
  • 1. Valentine’s Day love For money ? or At SAP, we are always intrigued by the data that surrounds us. This Valentine’s Day, how do various Asia Pacific markets measure up against one another? Chocolate Source: International Trade Centre Annual cocoa imports for chocolate and food preparation (USD) HONG KONG 2.6 12.0 NEW ZEALAND 0.1 AUSTRALIA INDIA 19.1% KOREA JAPAN 4.1 0.04 Property value fluctuations from Q2 2012 to Q2 2013 5.3 11.6 0.01 Property 12.63 1.0 INDONESIA 14.8% 0.002 INDONESIA INDIA Annual import of bouquets or ornaments per capita (USD) 0.02 0.3 0.3 NEW ZEALAND 1.01% INDIA CHINA NEW ZEALAND Travel 2.2% Tourism expenditures per capita (USD) Source: 14.8 KOREA Source: Manulife Investor Sentiment Index 3Q 2013 1.8% 47% 29% MALAYSIA JAPAN 68 % SINGAPORE 2.3% 62% KOREA 58% ONG The World Bank 2009-2013 JAPAN 9.6 People who have started retirement planning Source: United Nations 1.9% Demographic SINGAPORE Yearbook 2012 and Wikipedia Divorce 1.9% Demography NEW ZEALAND AUSTRALIA CHINA 8.0 SINGAPORE NEW ZEALAND JAPAN Source: International Trade Centre 1.6% 5.9 MALAYSIA KOREA Savings MALAYSIA AUSTRALIA INDONESIA 0.6 MALAYSIA 0.8 SINGAPORE 1.6 INDIA 2.6 JAPAN INDONESIA Divorce rates KOREA SINGAPORE Consumption per capita (liters) 4.5% 0.2 1.3 Alcohol INDIA AUSTRALIA JAPAN 6.85 CHINA CHINA 3.5 8.4% -2.2% -1.5% HONG KONG 0.001 Flowers 6.0% 5.9% 5.1% CHINA 10.0 12.1% SINGAPORE MALAYSIA Source: Knight Frank Global House Price Index SIA INDONE H KONG 50% AUSTRALIA Source: WHO Global Status Report On Alcohol and Health 2011 2,690 73% 73% 1523 CHINA AUSTRALIA 398 HONG KONG SINGAPORE 80 59 NEW ZEALAND CHINA 31 JAPAN 11 44 37 KOREA INDIA 4 MALAYSIA INDONESIA CHINA Stress People who found work as the primary trigger of stress 63% SINGAPORE HONG KONG INDONESIA Figures from the Population Reference Bureau are used for per capita calculations 62% Take a look at your world. Visualize your data and discover answers with SAP Lumira for free. Source: Regus Stress 57% Whitepaper MALAYSIA Aug 2012 insightmeetsinstinct.com