SlideShare uma empresa Scribd logo
1 de 39
Learning Objectives
• Know how to implement the Hypothesis, Test, Action,
Business (HTAB) system to test hypotheses.
• Understand the logic of Statistical Hypothesis Testing:
– Know how to establish null and alternative hypotheses
– Understand Type I and Type II errors
– Calculate the probability of Type II error when failing to reject the null
hypothesis

• Understand how to test a hypothesis about a single
population parameter:
– Mean
• when
• when

is known (using z-statistic)
is unknown (using t-statistic)
Types of Hypotheses
1. Research Hypothesis
– a statement of what the researcher believes will be
the outcome of an experiment or a study.

2. Statistical Hypothesis
– a more formal structure derived from the scientific
method
– composed of two parts :
• Null hypothesis (Ho) – the assumed value of the parameter if
there is no effect/ impact. We will conclude that this could
be true unless there is a small chance of getting a sample
statistic (mean/proportion/variance) as extreme or more
extreme than from the data (small p-value).
• Alternative hypothesis (Ha) – a statement of whether the
true population parameter is higher, lower, or not equal to
that hypothesized in the null hypothesis.
Types of Hypotheses
3. Substantive Hypothesis - a statistically
significant difference does not imply or mean
a material, substantive difference.
– If the null hypothesis is rejected and the
alternative hypothesis is accepted, then one
can say that a statistically significant result
has been obtained
– With “significant” results, you reject the null
hypothesis
Using the HTAB System
• H – Hypotheses
– Establish the hypothesis

• T – Test
– Conduct the test

• A – Action
– Take statistical action

• B – Business Implications
– Determine the business implications
CPA Salary Example
Example: A survey of CPAs in the U.S., done 15
years ago, found that their average salary was
$74,914. An accounting researcher would like to
test whether this average has changed over the
years. A random sample of 112 CPAs produced a
mean salary of $78,695. Assume that the
population standard deviation of salaries is =
$14,530 (note: this value is typically not known, but
we will assume it for mathematical simplicity. Later,
we will remove this assumption).
Step 1: Hypothesis
Set up the null and alternative hypotheses
Always contains “=“

H0 :
Ha :

$74,914
$74,914
> or < or ≠
Null and Alternative Hypotheses
• The null and alternative hypotheses are mutually
exclusive.
– Only one of them can be selected.

• The null hypothesis is assumed to be true. It is
compared to the observed data via either a
critical value (critical value method) or by
calculating a p-value (p-value method)
• The burden of proof falls on the alternative
hypothesis. Thus, you either reject the null in
favour of the alternative or you fail to reject the
null in favour of the alternative. The latter
statement does not imply that the null is true.
Examples: One-tailed and
Two-tailed Tests
• One-tailed Test
- Means

40

Ha :
- Proportions

H0 :

40

H 0 : p 0.18
H a : p 0.18

• Two-tailed Test

H0 :

12

Ha :

12
Step 2: Determine Appropriate Test
• The z-statistic can be used to test when the
following three conditions are met:
– The data are a random sample from the population
– The sample standard deviation ( ) is known
– At least one of the following conditions are met:
• The sample size (n) is at least 30
• The underlying distribution is normal

• The value of z-statistic can be calculated using the
following formula
z

x
n
Finite Population Correction
• If the sample is drawn from a finite population
of size N, the formula for z-statistic becomes…

z

X
N n
n N 1
Step 3: Set significance level ( )
• Significance level ( ) or Type I error rate
– Committed by rejecting a true null hypothesis
– If the null hypothesis is true, any value that falls in
a rejection region will represent a Type I error.
– The probability of committing a Type I error is
referred to as , the level of significance.

• The significance level is usually set at 0.05.
Other common values are 0.1, 0.01, or 0.001.
Type II Errors
• Type II Error
– Committed when a researcher fails to reject a false null
hypothesis
– The probability of committing a Type II error is referred
to as . Some refer to power, or 1- (the chance of
rejecting the null when it is false), instead.

• In practice, we do not know whether the null
hypothesis is true.
• Type I and Type II error rates are inversely related,
if you reduce one, you increase the other.
• One way of reducing both Type I and Type II error
rates is to increase the sample size, but that
requires more time and money.
Decision Table for
Hypothesis Testing
State of Null (Truth)
Decision:

Null True

Null False

Fail to
reject null

Correct
Decision

Type II error
( )

Reject null

Type I error
( )

Correct Decision
(Power)
Step 4: Decision Rule
• A decision rule has to be made about when the
difference between the sample and hypothesized
population mean (under the null hypothesis) is small
or large.
• The rejection region is the area on the curve where
the null hypothesis is rejected. Here the value of the
sample mean is too far from the hypothesized
population mean to conclude that they are the same.
• The nonrejection region is the area where the null
hypothesis is not rejected. Here the sample mean is
close enough to the hypothesized population mean
to conclude that the null hypothesis could be true.
Rejection and Non-rejection Regions
Rejection Region

Rejection Region

Non Rejection Region
=$74,914

Critical Value

Critical Value
Decision rule – CPA Example
Rejection Region

Rejection Region

Non Rejection Region
=$74,914
Z

/2

= Z0.025 = -1.96

Z1-

Z=0

/2

= Z0.975 = +1.96
Critical Z values:
Level of significance = 0.05

Non-rejection Region
95%

.025

.4750

.025

.4750

X

-1.96

0

1.96

Z
Values of z for common
Levels of Confidence
Confidence Level
90%
95%
98%
99%

Z Value
1.645
1.96
2.33
2.575
Decision Rule – CPA Example

Thus, we will reject H0 if Z > 1.96 or Z < -1.96
or reject H0 if |Z| > 1.96
Critical Value Based on
Sample Mean
Alternatively, you could calculate a critical value based
not on Z, but on x-bar.

zc xc
or

xc

so
n

1.96

xc 74,914
14,530 112

14,530 74,914 2,691
74,914 1.96
112

lower xc 72,223 and upper xc 77,605
Thus, we would reject the null if the sample mean is
above $77,605 or below $72,223.
One-tailed Tests
Depending on the problem, one-tailed tests are sometimes
appropriate.

H0 :

40

H0 :

40

Ha :

40

Ha :

40

Rejection Region

Non Rejection Region
=40 oz

Critical Value

Rejection Region

Non Rejection Region
=40 oz

Critical Value
Step 5 (Gather Data) and
Step 6 (Compute Test Statistic)

z

X
78695 74914 2.75
/ n 14530 / 112
Step 7: Statistical Action (Decision)
Step 8: Business Decision
Statistically, the researcher has enough evidence
to reject the figure of $74,914 as the true average
salary for CPAs. Based on the evidence gathered,
it suggests that the average has increased over
the 15-year period.
Alternative Method: the p-value
• p-value – another way to reach statistical conclusion in
hypothesis testing
If the null hypothesis is true, the p value is the probability of
getting a sample mean as extreme or more extreme than
what you observed.
If the sample mean is in the rejection region, the p-value will
be small. These two methods are always consistent.
• p-value <
reject H0, p-value
do not reject H0
• For two tailed test, /2 is used in each region
The p value is then compared to α/2 instead of to determine
statistical significance.
Some statisticians (and packages) double the p-value for a two
sided test instead and compare to .
p-value for CPA Example

Px

$78,695 |

$74,914

P

x
n

P( Z

2.75) 0.003

$78,695 $74,914
$14,530
112
Review of 8 Steps
of Hypothesis Testing
1 – Establish the null and alternative hypotheses
2 – Determine the appropriate statistical test
3 – Set , the Type I error rate / significance level
4 – Establish the decision rule
5 – Gather sample data
6 – Analyze the data
7 – Reach a statistical conclusion
8 – Make a business decision
The U.S. Farmers’ Production Company (USFPC) builds
large harvesters. For a harvester to be properly
balanced when operating, a 25-pound plate is
installed on its side. The machine that produces these
plates is set to yield plates that average 25 pounds.
The distribution of plates produced from the machine
is normal. However, the shop supervisor is worried
that the machine is out of adjustment and is
producing plates that do not average 25 pounds. To
test this, he randomly selects 20 of the plates from
the day before and weighs them.
• Establish the null and alternative hypotheses
H0: =25 pounds (where
mean weight of all plates)
Ha: ≠25
• Determine the appropriate statistical test.
Recall from earlier session, the conditions for the tdistribution:
1. The sample was randomly selected from the population
2. The population standard deviation ( ) is unknown
3. One of these conditions are met:
The sample size (n) is at least 30 OR
the underlying distribution is normal
These conditions are met!
The degrees of freedom are n-1 = 20-1 = 19 in this example
Recap: t Distribution
A family of distributions - a unique distribution for each
value of its parameter using degrees of freedom (d.f.),
every sample size having a different distribution

t

x
s
n
t19

t

/2

t19

t0.025

t19

2.093

X
25.51 25 1.04
t
n 1 s / n 2.1933/ 20
7 – Reach a statistical conclusion
Since |t| = 1.04 < tc = 2.093, do not reject H0
8 – Make a business decision
There is not enough evidence to show that the
plates are different from 25 pounds. (Note: Is this
because the true population mean is close to 25
pounds, or is there a large chance that we have
suffered from a Type II error? Good question –
more on calculating type II error rates later.)
R: Lower Tail Test of Population Mean
when Population Variance is known.
Problem: Suppose a manufacturer claims that the mean
lifetime of a light bulb is more than 10,000 hours. In a sample
of 30 light bulbs, it was found that they only last 9,900 hours
on average. Assume the population standard deviation is 120
hours. At .05 significance level, can we reject the claim by the
manufacturer?

Go to
http://www.r-tutor.com/elementary-statistics/hypothesis-testing
R: Upper Tail Test of Population Mean
when Population Variance is known.
Problem: Suppose the food label on a cookie bag states that
there is at most 2 grams of saturated fat in a single cookie. In a
sample of 35 cookies, it is found that the mean amount of
saturated fat per cookie is 2.1 grams. Assume that the
population standard deviation is 0.25 grams. At .05
significance level, can we reject the claim on food label?

Go to
http://www.r-tutor.com/elementary-statistics/hypothesis-testing
R: Two-tailed Test of Population Mean
when Population Variance is known.
Problem: Suppose the mean weight of King Penguins found in
an Antarctic colony last year was 15.4 kg. In a sample of 35
penguins same time this year in the same colony, the mean
penguin weight is 14.6 kg. Assume the population standard
deviation is 2.5 kg. At .05 significance level, can we reject the
null hypothesis that the mean penguin weight does not differ
from last year?

Go to
http://www.r-tutor.com/elementary-statistics/hypothesis-testing
R: Lower Tail Test of Population Mean
when Population Variance is unknown
Problem: Suppose the same manufacturer claims that the mean
lifetime of a light bulb is more than 10,000 hours. In a sample of
30 light bulbs, it was found that they only last 9,900 hours on
average. Assume the sample standard deviation is 125 hours.
At 0.05 significance level, can we reject the claim by the
manufacturer?

Go to
http://www.r-tutor.com/elementary-statistics/hypothesis-testing
R: Upper Tail Test of Population Mean
when Population Variance is unknown
Problem: Suppose the same food label on a cookie bag states
that there is at most 2 grams of saturated fat in a single cookie.
In a sample of 35 cookies, it is found that the mean amount of
saturated fat per cookie is 2.1 grams. Assume that the sample
standard deviation is 0.3 gram. At 0.05 significance level, can
we reject the claim on food label?
Solution

Go to
http://www.r-tutor.com/elementary-statistics/hypothesis-testing
R: Two Tail Test of Population Mean
when Population Variance is unknown
Problem: Suppose the mean weight of King Penguins found in
an Antarctic colony last year was 15.4 kg. In a sample of 35
penguins same time this year in the same colony, the mean
penguin weight is 14.6 kg. Assume the sample standard
deviation is 2.5 kg. At 0.05 significance level, can we reject the
null hypothesis that the mean penguin weight does not differ
from last year?

Go to
http://www.r-tutor.com/elementary-statistics/hypothesis-testing
R: Two Tail Test of Population Mean
when Population Variance is unknown
Go to http://ww2.coastal.edu/kingw/statistics/Rtutorials/index.html
Enter Single Sample t test and practice the t.test() command
with the temperature data given

Mais conteúdo relacionado

Mais procurados

Ikea sustainability report_2009
Ikea sustainability report_2009Ikea sustainability report_2009
Ikea sustainability report_2009
MariaJoao2010
 

Mais procurados (20)

Cumberland Metals
Cumberland MetalsCumberland Metals
Cumberland Metals
 
Ikea sustainability report_2009
Ikea sustainability report_2009Ikea sustainability report_2009
Ikea sustainability report_2009
 
Wal-Mart Stores in 2003 (HBS Case 9-704-430)
Wal-Mart Stores in 2003 (HBS Case 9-704-430)Wal-Mart Stores in 2003 (HBS Case 9-704-430)
Wal-Mart Stores in 2003 (HBS Case 9-704-430)
 
Cola wars Case Study Analysis
Cola wars Case Study AnalysisCola wars Case Study Analysis
Cola wars Case Study Analysis
 
TruEarth Healthy Food
TruEarth Healthy FoodTruEarth Healthy Food
TruEarth Healthy Food
 
Cola Wars - Coke Vs Pepsi Harvard Business School Case Study
Cola Wars - Coke Vs Pepsi Harvard Business School Case StudyCola Wars - Coke Vs Pepsi Harvard Business School Case Study
Cola Wars - Coke Vs Pepsi Harvard Business School Case Study
 
Test hypothesis
Test hypothesisTest hypothesis
Test hypothesis
 
Starbuck's case study
Starbuck's case studyStarbuck's case study
Starbuck's case study
 
Bayonne packaging case report
Bayonne packaging case reportBayonne packaging case report
Bayonne packaging case report
 
Chapter 07
Chapter 07 Chapter 07
Chapter 07
 
Solution chemalite
Solution chemaliteSolution chemalite
Solution chemalite
 
Wesco case B2B case study
Wesco case B2B case studyWesco case B2B case study
Wesco case B2B case study
 
Case Study on Godrej Chotukool
Case Study on Godrej ChotukoolCase Study on Godrej Chotukool
Case Study on Godrej Chotukool
 
5case
5case5case
5case
 
Gino sa distribution channel management case study
Gino sa distribution channel management case studyGino sa distribution channel management case study
Gino sa distribution channel management case study
 
JM Statr session 13, Jan 11
JM Statr session 13, Jan 11JM Statr session 13, Jan 11
JM Statr session 13, Jan 11
 
Suave final
Suave finalSuave final
Suave final
 
Culinarian cookware
Culinarian cookwareCulinarian cookware
Culinarian cookware
 
Annalysed Case study of Virgin mobiles HARVARD UNIVERSITY CASE
Annalysed Case study of Virgin mobiles  HARVARD UNIVERSITY CASEAnnalysed Case study of Virgin mobiles  HARVARD UNIVERSITY CASE
Annalysed Case study of Virgin mobiles HARVARD UNIVERSITY CASE
 
Harvard business review analytic ducati
Harvard business review analytic   ducatiHarvard business review analytic   ducati
Harvard business review analytic ducati
 

Destaque

Wiki assignment
Wiki assignmentWiki assignment
Wiki assignment
herbison
 
Notes Day 6: Prove that sides are in proportion
Notes Day 6: Prove that sides are in proportionNotes Day 6: Prove that sides are in proportion
Notes Day 6: Prove that sides are in proportion
Kate Nowak
 
Confidence Intervals And The T Distribution
Confidence Intervals And The T   DistributionConfidence Intervals And The T   Distribution
Confidence Intervals And The T Distribution
Darren Barton
 
Questions On Hypothesis Testing
Questions On Hypothesis TestingQuestions On Hypothesis Testing
Questions On Hypothesis Testing
Neha Chauhan
 
Chapter 07
Chapter 07Chapter 07
Chapter 07
bmcfad01
 

Destaque (20)

Hypothesis testing
Hypothesis testingHypothesis testing
Hypothesis testing
 
Sfs4e ppt 06
Sfs4e ppt 06Sfs4e ppt 06
Sfs4e ppt 06
 
Probability addition rule
Probability addition ruleProbability addition rule
Probability addition rule
 
Les5e ppt 06
Les5e ppt 06Les5e ppt 06
Les5e ppt 06
 
Wiki assignment
Wiki assignmentWiki assignment
Wiki assignment
 
Notes Day 6: Prove that sides are in proportion
Notes Day 6: Prove that sides are in proportionNotes Day 6: Prove that sides are in proportion
Notes Day 6: Prove that sides are in proportion
 
Statr session 25 and 26
Statr session 25 and 26Statr session 25 and 26
Statr session 25 and 26
 
Theorems And Conditional Probability
Theorems And Conditional ProbabilityTheorems And Conditional Probability
Theorems And Conditional Probability
 
Confidence Intervals And The T Distribution
Confidence Intervals And The T   DistributionConfidence Intervals And The T   Distribution
Confidence Intervals And The T Distribution
 
Questions On Hypothesis Testing
Questions On Hypothesis TestingQuestions On Hypothesis Testing
Questions On Hypothesis Testing
 
Fundamentals Probability 08072009
Fundamentals Probability 08072009Fundamentals Probability 08072009
Fundamentals Probability 08072009
 
Chap07 interval estimation
Chap07 interval estimationChap07 interval estimation
Chap07 interval estimation
 
Chapter 07
Chapter 07Chapter 07
Chapter 07
 
CABT SHS Statistics & Probability - Estimation of Parameters (intro)
CABT SHS Statistics & Probability -  Estimation of Parameters (intro)CABT SHS Statistics & Probability -  Estimation of Parameters (intro)
CABT SHS Statistics & Probability - Estimation of Parameters (intro)
 
Confidence Intervals
Confidence IntervalsConfidence Intervals
Confidence Intervals
 
Normal Distribution
Normal DistributionNormal Distribution
Normal Distribution
 
Normal distribution stat
Normal distribution statNormal distribution stat
Normal distribution stat
 
Chapter 7 : Inference for Distributions(The t Distributions, One-Sample t Con...
Chapter 7 : Inference for Distributions(The t Distributions, One-Sample t Con...Chapter 7 : Inference for Distributions(The t Distributions, One-Sample t Con...
Chapter 7 : Inference for Distributions(The t Distributions, One-Sample t Con...
 
Medical statistics Basic concept and applications [Square one]
Medical statistics Basic concept and applications [Square one]Medical statistics Basic concept and applications [Square one]
Medical statistics Basic concept and applications [Square one]
 
Chapter 5 part1- The Sampling Distribution of a Sample Mean
Chapter 5 part1- The Sampling Distribution of a Sample MeanChapter 5 part1- The Sampling Distribution of a Sample Mean
Chapter 5 part1- The Sampling Distribution of a Sample Mean
 

Semelhante a Statr session 15 and 16

Hypothesis testing
Hypothesis testingHypothesis testing
Hypothesis testing
Nirajan Bam
 
Identifying Appropriate Test Statistics Involving Population Mean
Identifying Appropriate Test Statistics Involving Population MeanIdentifying Appropriate Test Statistics Involving Population Mean
Identifying Appropriate Test Statistics Involving Population Mean
MYRABACSAFRA2
 
Estimation and hypothesis testing 1 (graduate statistics2)
Estimation and hypothesis testing 1 (graduate statistics2)Estimation and hypothesis testing 1 (graduate statistics2)
Estimation and hypothesis testing 1 (graduate statistics2)
Harve Abella
 
Day-2_Presentation for SPSS parametric workshop.pptx
Day-2_Presentation for SPSS parametric workshop.pptxDay-2_Presentation for SPSS parametric workshop.pptx
Day-2_Presentation for SPSS parametric workshop.pptx
rjaisankar
 

Semelhante a Statr session 15 and 16 (20)

Statr session 17 and 18
Statr session 17 and 18Statr session 17 and 18
Statr session 17 and 18
 
Hypothsis testing
Hypothsis testingHypothsis testing
Hypothsis testing
 
7 hypothesis testing
7 hypothesis testing7 hypothesis testing
7 hypothesis testing
 
Data analysis
Data analysisData analysis
Data analysis
 
STATISTIC ESTIMATION
STATISTIC ESTIMATIONSTATISTIC ESTIMATION
STATISTIC ESTIMATION
 
Himani
HimaniHimani
Himani
 
Himani sharma
Himani sharmaHimani sharma
Himani sharma
 
Hypothesis testing
Hypothesis testingHypothesis testing
Hypothesis testing
 
Basics of Hypothesis testing for Pharmacy
Basics of Hypothesis testing for PharmacyBasics of Hypothesis testing for Pharmacy
Basics of Hypothesis testing for Pharmacy
 
hypothesis teesting
 hypothesis teesting hypothesis teesting
hypothesis teesting
 
Identifying Appropriate Test Statistics Involving Population Mean
Identifying Appropriate Test Statistics Involving Population MeanIdentifying Appropriate Test Statistics Involving Population Mean
Identifying Appropriate Test Statistics Involving Population Mean
 
Sampling theory
Sampling theorySampling theory
Sampling theory
 
Estimation and hypothesis testing 1 (graduate statistics2)
Estimation and hypothesis testing 1 (graduate statistics2)Estimation and hypothesis testing 1 (graduate statistics2)
Estimation and hypothesis testing 1 (graduate statistics2)
 
Telesidang 4 bab_8_9_10stst
Telesidang 4 bab_8_9_10ststTelesidang 4 bab_8_9_10stst
Telesidang 4 bab_8_9_10stst
 
10. sampling and hypotehsis
10. sampling and hypotehsis10. sampling and hypotehsis
10. sampling and hypotehsis
 
hypothesis.pptx
hypothesis.pptxhypothesis.pptx
hypothesis.pptx
 
hypothesis test
 hypothesis test hypothesis test
hypothesis test
 
Day-2_Presentation for SPSS parametric workshop.pptx
Day-2_Presentation for SPSS parametric workshop.pptxDay-2_Presentation for SPSS parametric workshop.pptx
Day-2_Presentation for SPSS parametric workshop.pptx
 
Chapter 9 Fundamental of Hypothesis Testing.ppt
Chapter 9 Fundamental of Hypothesis Testing.pptChapter 9 Fundamental of Hypothesis Testing.ppt
Chapter 9 Fundamental of Hypothesis Testing.ppt
 
Ds 2251 -_hypothesis test
Ds 2251 -_hypothesis testDs 2251 -_hypothesis test
Ds 2251 -_hypothesis test
 

Mais de Ruru Chowdhury

Mais de Ruru Chowdhury (16)

The One With The Wizards and Dragons. Prelims
The One With The Wizards and Dragons. PrelimsThe One With The Wizards and Dragons. Prelims
The One With The Wizards and Dragons. Prelims
 
The One With The Wizards and Dragons. Finals
The One With The Wizards and Dragons. FinalsThe One With The Wizards and Dragons. Finals
The One With The Wizards and Dragons. Finals
 
Statr session 23 and 24
Statr session 23 and 24Statr session 23 and 24
Statr session 23 and 24
 
Statr session 21 and 22
Statr session 21 and 22Statr session 21 and 22
Statr session 21 and 22
 
Statr session 19 and 20
Statr session 19 and 20Statr session 19 and 20
Statr session 19 and 20
 
Statr session14, Jan 11
Statr session14, Jan 11Statr session14, Jan 11
Statr session14, Jan 11
 
Nosql part3
Nosql part3Nosql part3
Nosql part3
 
Nosql part1 8th December
Nosql part1 8th December Nosql part1 8th December
Nosql part1 8th December
 
Nosql part 2
Nosql part 2Nosql part 2
Nosql part 2
 
Statr sessions 9 to 10
Statr sessions 9 to 10Statr sessions 9 to 10
Statr sessions 9 to 10
 
R part iii
R part iiiR part iii
R part iii
 
R part II
R part IIR part II
R part II
 
Statr sessions 7 to 8
Statr sessions 7 to 8Statr sessions 7 to 8
Statr sessions 7 to 8
 
R part I
R part IR part I
R part I
 
Statr sessions 4 to 6
Statr sessions 4 to 6Statr sessions 4 to 6
Statr sessions 4 to 6
 
Statistics with R
Statistics with R Statistics with R
Statistics with R
 

Último

Jual Obat Aborsi Hongkong ( Asli No.1 ) 085657271886 Obat Penggugur Kandungan...
Jual Obat Aborsi Hongkong ( Asli No.1 ) 085657271886 Obat Penggugur Kandungan...Jual Obat Aborsi Hongkong ( Asli No.1 ) 085657271886 Obat Penggugur Kandungan...
Jual Obat Aborsi Hongkong ( Asli No.1 ) 085657271886 Obat Penggugur Kandungan...
ZurliaSoop
 

Último (20)

Interdisciplinary_Insights_Data_Collection_Methods.pptx
Interdisciplinary_Insights_Data_Collection_Methods.pptxInterdisciplinary_Insights_Data_Collection_Methods.pptx
Interdisciplinary_Insights_Data_Collection_Methods.pptx
 
Unit 3 Emotional Intelligence and Spiritual Intelligence.pdf
Unit 3 Emotional Intelligence and Spiritual Intelligence.pdfUnit 3 Emotional Intelligence and Spiritual Intelligence.pdf
Unit 3 Emotional Intelligence and Spiritual Intelligence.pdf
 
TỔNG ÔN TẬP THI VÀO LỚP 10 MÔN TIẾNG ANH NĂM HỌC 2023 - 2024 CÓ ĐÁP ÁN (NGỮ Â...
TỔNG ÔN TẬP THI VÀO LỚP 10 MÔN TIẾNG ANH NĂM HỌC 2023 - 2024 CÓ ĐÁP ÁN (NGỮ Â...TỔNG ÔN TẬP THI VÀO LỚP 10 MÔN TIẾNG ANH NĂM HỌC 2023 - 2024 CÓ ĐÁP ÁN (NGỮ Â...
TỔNG ÔN TẬP THI VÀO LỚP 10 MÔN TIẾNG ANH NĂM HỌC 2023 - 2024 CÓ ĐÁP ÁN (NGỮ Â...
 
Introduction to Nonprofit Accounting: The Basics
Introduction to Nonprofit Accounting: The BasicsIntroduction to Nonprofit Accounting: The Basics
Introduction to Nonprofit Accounting: The Basics
 
How to Create and Manage Wizard in Odoo 17
How to Create and Manage Wizard in Odoo 17How to Create and Manage Wizard in Odoo 17
How to Create and Manage Wizard in Odoo 17
 
How to setup Pycharm environment for Odoo 17.pptx
How to setup Pycharm environment for Odoo 17.pptxHow to setup Pycharm environment for Odoo 17.pptx
How to setup Pycharm environment for Odoo 17.pptx
 
Fostering Friendships - Enhancing Social Bonds in the Classroom
Fostering Friendships - Enhancing Social Bonds  in the ClassroomFostering Friendships - Enhancing Social Bonds  in the Classroom
Fostering Friendships - Enhancing Social Bonds in the Classroom
 
How to Manage Global Discount in Odoo 17 POS
How to Manage Global Discount in Odoo 17 POSHow to Manage Global Discount in Odoo 17 POS
How to Manage Global Discount in Odoo 17 POS
 
Making communications land - Are they received and understood as intended? we...
Making communications land - Are they received and understood as intended? we...Making communications land - Are they received and understood as intended? we...
Making communications land - Are they received and understood as intended? we...
 
Kodo Millet PPT made by Ghanshyam bairwa college of Agriculture kumher bhara...
Kodo Millet  PPT made by Ghanshyam bairwa college of Agriculture kumher bhara...Kodo Millet  PPT made by Ghanshyam bairwa college of Agriculture kumher bhara...
Kodo Millet PPT made by Ghanshyam bairwa college of Agriculture kumher bhara...
 
Micro-Scholarship, What it is, How can it help me.pdf
Micro-Scholarship, What it is, How can it help me.pdfMicro-Scholarship, What it is, How can it help me.pdf
Micro-Scholarship, What it is, How can it help me.pdf
 
General Principles of Intellectual Property: Concepts of Intellectual Proper...
General Principles of Intellectual Property: Concepts of Intellectual  Proper...General Principles of Intellectual Property: Concepts of Intellectual  Proper...
General Principles of Intellectual Property: Concepts of Intellectual Proper...
 
Single or Multiple melodic lines structure
Single or Multiple melodic lines structureSingle or Multiple melodic lines structure
Single or Multiple melodic lines structure
 
Python Notes for mca i year students osmania university.docx
Python Notes for mca i year students osmania university.docxPython Notes for mca i year students osmania university.docx
Python Notes for mca i year students osmania university.docx
 
Unit-V; Pricing (Pharma Marketing Management).pptx
Unit-V; Pricing (Pharma Marketing Management).pptxUnit-V; Pricing (Pharma Marketing Management).pptx
Unit-V; Pricing (Pharma Marketing Management).pptx
 
Wellbeing inclusion and digital dystopias.pptx
Wellbeing inclusion and digital dystopias.pptxWellbeing inclusion and digital dystopias.pptx
Wellbeing inclusion and digital dystopias.pptx
 
SKILL OF INTRODUCING THE LESSON MICRO SKILLS.pptx
SKILL OF INTRODUCING THE LESSON MICRO SKILLS.pptxSKILL OF INTRODUCING THE LESSON MICRO SKILLS.pptx
SKILL OF INTRODUCING THE LESSON MICRO SKILLS.pptx
 
Jual Obat Aborsi Hongkong ( Asli No.1 ) 085657271886 Obat Penggugur Kandungan...
Jual Obat Aborsi Hongkong ( Asli No.1 ) 085657271886 Obat Penggugur Kandungan...Jual Obat Aborsi Hongkong ( Asli No.1 ) 085657271886 Obat Penggugur Kandungan...
Jual Obat Aborsi Hongkong ( Asli No.1 ) 085657271886 Obat Penggugur Kandungan...
 
SOC 101 Demonstration of Learning Presentation
SOC 101 Demonstration of Learning PresentationSOC 101 Demonstration of Learning Presentation
SOC 101 Demonstration of Learning Presentation
 
HMCS Max Bernays Pre-Deployment Brief (May 2024).pptx
HMCS Max Bernays Pre-Deployment Brief (May 2024).pptxHMCS Max Bernays Pre-Deployment Brief (May 2024).pptx
HMCS Max Bernays Pre-Deployment Brief (May 2024).pptx
 

Statr session 15 and 16

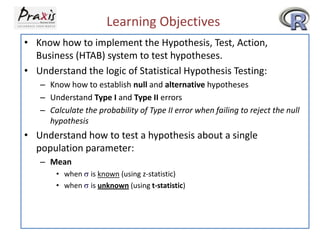
  • 1. Learning Objectives • Know how to implement the Hypothesis, Test, Action, Business (HTAB) system to test hypotheses. • Understand the logic of Statistical Hypothesis Testing: – Know how to establish null and alternative hypotheses – Understand Type I and Type II errors – Calculate the probability of Type II error when failing to reject the null hypothesis • Understand how to test a hypothesis about a single population parameter: – Mean • when • when is known (using z-statistic) is unknown (using t-statistic)
  • 2. Types of Hypotheses 1. Research Hypothesis – a statement of what the researcher believes will be the outcome of an experiment or a study. 2. Statistical Hypothesis – a more formal structure derived from the scientific method – composed of two parts : • Null hypothesis (Ho) – the assumed value of the parameter if there is no effect/ impact. We will conclude that this could be true unless there is a small chance of getting a sample statistic (mean/proportion/variance) as extreme or more extreme than from the data (small p-value). • Alternative hypothesis (Ha) – a statement of whether the true population parameter is higher, lower, or not equal to that hypothesized in the null hypothesis.
  • 3. Types of Hypotheses 3. Substantive Hypothesis - a statistically significant difference does not imply or mean a material, substantive difference. – If the null hypothesis is rejected and the alternative hypothesis is accepted, then one can say that a statistically significant result has been obtained – With “significant” results, you reject the null hypothesis
  • 4. Using the HTAB System • H – Hypotheses – Establish the hypothesis • T – Test – Conduct the test • A – Action – Take statistical action • B – Business Implications – Determine the business implications
  • 5. CPA Salary Example Example: A survey of CPAs in the U.S., done 15 years ago, found that their average salary was $74,914. An accounting researcher would like to test whether this average has changed over the years. A random sample of 112 CPAs produced a mean salary of $78,695. Assume that the population standard deviation of salaries is = $14,530 (note: this value is typically not known, but we will assume it for mathematical simplicity. Later, we will remove this assumption).
  • 6. Step 1: Hypothesis Set up the null and alternative hypotheses Always contains “=“ H0 : Ha : $74,914 $74,914 > or < or ≠
  • 7. Null and Alternative Hypotheses • The null and alternative hypotheses are mutually exclusive. – Only one of them can be selected. • The null hypothesis is assumed to be true. It is compared to the observed data via either a critical value (critical value method) or by calculating a p-value (p-value method) • The burden of proof falls on the alternative hypothesis. Thus, you either reject the null in favour of the alternative or you fail to reject the null in favour of the alternative. The latter statement does not imply that the null is true.
  • 8. Examples: One-tailed and Two-tailed Tests • One-tailed Test - Means 40 Ha : - Proportions H0 : 40 H 0 : p 0.18 H a : p 0.18 • Two-tailed Test H0 : 12 Ha : 12
  • 9. Step 2: Determine Appropriate Test • The z-statistic can be used to test when the following three conditions are met: – The data are a random sample from the population – The sample standard deviation ( ) is known – At least one of the following conditions are met: • The sample size (n) is at least 30 • The underlying distribution is normal • The value of z-statistic can be calculated using the following formula z x n
  • 10. Finite Population Correction • If the sample is drawn from a finite population of size N, the formula for z-statistic becomes… z X N n n N 1
  • 11. Step 3: Set significance level ( ) • Significance level ( ) or Type I error rate – Committed by rejecting a true null hypothesis – If the null hypothesis is true, any value that falls in a rejection region will represent a Type I error. – The probability of committing a Type I error is referred to as , the level of significance. • The significance level is usually set at 0.05. Other common values are 0.1, 0.01, or 0.001.
  • 12. Type II Errors • Type II Error – Committed when a researcher fails to reject a false null hypothesis – The probability of committing a Type II error is referred to as . Some refer to power, or 1- (the chance of rejecting the null when it is false), instead. • In practice, we do not know whether the null hypothesis is true. • Type I and Type II error rates are inversely related, if you reduce one, you increase the other. • One way of reducing both Type I and Type II error rates is to increase the sample size, but that requires more time and money.
  • 13. Decision Table for Hypothesis Testing State of Null (Truth) Decision: Null True Null False Fail to reject null Correct Decision Type II error ( ) Reject null Type I error ( ) Correct Decision (Power)
  • 14. Step 4: Decision Rule • A decision rule has to be made about when the difference between the sample and hypothesized population mean (under the null hypothesis) is small or large. • The rejection region is the area on the curve where the null hypothesis is rejected. Here the value of the sample mean is too far from the hypothesized population mean to conclude that they are the same. • The nonrejection region is the area where the null hypothesis is not rejected. Here the sample mean is close enough to the hypothesized population mean to conclude that the null hypothesis could be true.
  • 15. Rejection and Non-rejection Regions Rejection Region Rejection Region Non Rejection Region =$74,914 Critical Value Critical Value
  • 16. Decision rule – CPA Example Rejection Region Rejection Region Non Rejection Region =$74,914 Z /2 = Z0.025 = -1.96 Z1- Z=0 /2 = Z0.975 = +1.96
  • 17. Critical Z values: Level of significance = 0.05 Non-rejection Region 95% .025 .4750 .025 .4750 X -1.96 0 1.96 Z
  • 18. Values of z for common Levels of Confidence Confidence Level 90% 95% 98% 99% Z Value 1.645 1.96 2.33 2.575
  • 19. Decision Rule – CPA Example Thus, we will reject H0 if Z > 1.96 or Z < -1.96 or reject H0 if |Z| > 1.96
  • 20. Critical Value Based on Sample Mean Alternatively, you could calculate a critical value based not on Z, but on x-bar. zc xc or xc so n 1.96 xc 74,914 14,530 112 14,530 74,914 2,691 74,914 1.96 112 lower xc 72,223 and upper xc 77,605 Thus, we would reject the null if the sample mean is above $77,605 or below $72,223.
  • 21. One-tailed Tests Depending on the problem, one-tailed tests are sometimes appropriate. H0 : 40 H0 : 40 Ha : 40 Ha : 40 Rejection Region Non Rejection Region =40 oz Critical Value Rejection Region Non Rejection Region =40 oz Critical Value
  • 22. Step 5 (Gather Data) and Step 6 (Compute Test Statistic) z X 78695 74914 2.75 / n 14530 / 112
  • 23. Step 7: Statistical Action (Decision)
  • 24. Step 8: Business Decision Statistically, the researcher has enough evidence to reject the figure of $74,914 as the true average salary for CPAs. Based on the evidence gathered, it suggests that the average has increased over the 15-year period.
  • 25. Alternative Method: the p-value • p-value – another way to reach statistical conclusion in hypothesis testing If the null hypothesis is true, the p value is the probability of getting a sample mean as extreme or more extreme than what you observed. If the sample mean is in the rejection region, the p-value will be small. These two methods are always consistent. • p-value < reject H0, p-value do not reject H0 • For two tailed test, /2 is used in each region The p value is then compared to α/2 instead of to determine statistical significance. Some statisticians (and packages) double the p-value for a two sided test instead and compare to .
  • 26. p-value for CPA Example Px $78,695 | $74,914 P x n P( Z 2.75) 0.003 $78,695 $74,914 $14,530 112
  • 27. Review of 8 Steps of Hypothesis Testing 1 – Establish the null and alternative hypotheses 2 – Determine the appropriate statistical test 3 – Set , the Type I error rate / significance level 4 – Establish the decision rule 5 – Gather sample data 6 – Analyze the data 7 – Reach a statistical conclusion 8 – Make a business decision
  • 28. The U.S. Farmers’ Production Company (USFPC) builds large harvesters. For a harvester to be properly balanced when operating, a 25-pound plate is installed on its side. The machine that produces these plates is set to yield plates that average 25 pounds. The distribution of plates produced from the machine is normal. However, the shop supervisor is worried that the machine is out of adjustment and is producing plates that do not average 25 pounds. To test this, he randomly selects 20 of the plates from the day before and weighs them.
  • 29. • Establish the null and alternative hypotheses H0: =25 pounds (where mean weight of all plates) Ha: ≠25 • Determine the appropriate statistical test. Recall from earlier session, the conditions for the tdistribution: 1. The sample was randomly selected from the population 2. The population standard deviation ( ) is unknown 3. One of these conditions are met: The sample size (n) is at least 30 OR the underlying distribution is normal These conditions are met! The degrees of freedom are n-1 = 20-1 = 19 in this example
  • 30. Recap: t Distribution A family of distributions - a unique distribution for each value of its parameter using degrees of freedom (d.f.), every sample size having a different distribution t x s n
  • 32. 7 – Reach a statistical conclusion Since |t| = 1.04 < tc = 2.093, do not reject H0 8 – Make a business decision There is not enough evidence to show that the plates are different from 25 pounds. (Note: Is this because the true population mean is close to 25 pounds, or is there a large chance that we have suffered from a Type II error? Good question – more on calculating type II error rates later.)
  • 33. R: Lower Tail Test of Population Mean when Population Variance is known. Problem: Suppose a manufacturer claims that the mean lifetime of a light bulb is more than 10,000 hours. In a sample of 30 light bulbs, it was found that they only last 9,900 hours on average. Assume the population standard deviation is 120 hours. At .05 significance level, can we reject the claim by the manufacturer? Go to http://www.r-tutor.com/elementary-statistics/hypothesis-testing
  • 34. R: Upper Tail Test of Population Mean when Population Variance is known. Problem: Suppose the food label on a cookie bag states that there is at most 2 grams of saturated fat in a single cookie. In a sample of 35 cookies, it is found that the mean amount of saturated fat per cookie is 2.1 grams. Assume that the population standard deviation is 0.25 grams. At .05 significance level, can we reject the claim on food label? Go to http://www.r-tutor.com/elementary-statistics/hypothesis-testing
  • 35. R: Two-tailed Test of Population Mean when Population Variance is known. Problem: Suppose the mean weight of King Penguins found in an Antarctic colony last year was 15.4 kg. In a sample of 35 penguins same time this year in the same colony, the mean penguin weight is 14.6 kg. Assume the population standard deviation is 2.5 kg. At .05 significance level, can we reject the null hypothesis that the mean penguin weight does not differ from last year? Go to http://www.r-tutor.com/elementary-statistics/hypothesis-testing
  • 36. R: Lower Tail Test of Population Mean when Population Variance is unknown Problem: Suppose the same manufacturer claims that the mean lifetime of a light bulb is more than 10,000 hours. In a sample of 30 light bulbs, it was found that they only last 9,900 hours on average. Assume the sample standard deviation is 125 hours. At 0.05 significance level, can we reject the claim by the manufacturer? Go to http://www.r-tutor.com/elementary-statistics/hypothesis-testing
  • 37. R: Upper Tail Test of Population Mean when Population Variance is unknown Problem: Suppose the same food label on a cookie bag states that there is at most 2 grams of saturated fat in a single cookie. In a sample of 35 cookies, it is found that the mean amount of saturated fat per cookie is 2.1 grams. Assume that the sample standard deviation is 0.3 gram. At 0.05 significance level, can we reject the claim on food label? Solution Go to http://www.r-tutor.com/elementary-statistics/hypothesis-testing
  • 38. R: Two Tail Test of Population Mean when Population Variance is unknown Problem: Suppose the mean weight of King Penguins found in an Antarctic colony last year was 15.4 kg. In a sample of 35 penguins same time this year in the same colony, the mean penguin weight is 14.6 kg. Assume the sample standard deviation is 2.5 kg. At 0.05 significance level, can we reject the null hypothesis that the mean penguin weight does not differ from last year? Go to http://www.r-tutor.com/elementary-statistics/hypothesis-testing
  • 39. R: Two Tail Test of Population Mean when Population Variance is unknown Go to http://ww2.coastal.edu/kingw/statistics/Rtutorials/index.html Enter Single Sample t test and practice the t.test() command with the temperature data given