
Recommended
Recommended
More Related Content
Similar to Court Theater Energy Audit
Similar to Court Theater Energy Audit (20)
Court Theater Energy Audit
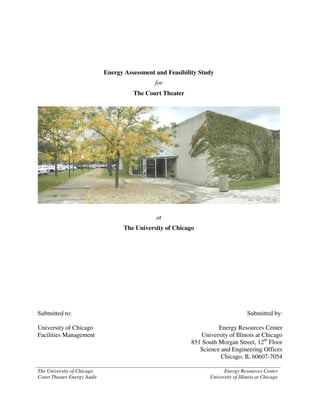
- 1. Energy Assessment and Feasibility Study for The Court Theater at The University of Chicago Submitted to: Submitted by: University of Chicago Energy Resources Center Facilities Management University of Illinois at Chicago 851 South Morgan Street, 12th Floor Science and Engineering Offices Chicago, IL 60607-7054 The University of Chicago Energy Resources Center Court Theater Energy Audit University of Illinois at Chicago
- 2. Table of Contents List of Tables ................................................................................................................................ II List of Figures .............................................................................................................................. III Executive Summary .....................................................................................................................IV I BUILDING DESCRIPTION .................................................................................................1 II Building Envelope .................................................................................................................3 III ENERGY USING SYSTEMS ...............................................................................................6 IV ENERGY CONSUMPTION ANALYSIS.............................................................................8 V Operations and Maintenance Procedures.............................................................................12 VI Energy Conservation Measures ...........................................................................................14 The University of Chicago I Energy Resources Center Court Theater Energy Audit University of Illinois at Chicago
- 3. List of Tables Table 1: ECM summary for Court Theater..................................................................................IV Table 2: Court Theater windows....................................................................................................4 Table 3: Court Theater doors .........................................................................................................4 Table 4: Summary of Installed Lighting Fixtures..........................................................................7 Table 5: Court Theater electric usage, demand and cost ...............................................................8 Table 6: Energy summary and EUI .............................................................................................10 Table 7: Electrical demand and usage distribution ......................................................................11 Table 8: ECM summary for Court Theater..................................................................................14 Table 9: Bin method savings analysis..........................................................................................16 Table 10: DDC system summary.................................................................................................18 Table 11: Chiller retrofit summary ..............................................................................................19 The University of Chicago II Energy Resources Center Court Theater Energy Audit University of Illinois at Chicago
- 4. List of Figures Figure 1: Court Theater..................................................................................................................1 Figure 2: Annual percentage of hourly use....................................................................................2 Figure 3: Court Theater outside wall .............................................................................................3 Figure 4: Roof detail ......................................................................................................................5 Figure 5: Summary of Lighting Fixtures .......................................................................................7 Figure 6: Electrical usage profile...................................................................................................9 Figure 7: Electric demand profile ..................................................................................................9 Figure 8: Energy usage profile.....................................................................................................11 The University of Chicago III Energy Resources Center Court Theater Energy Audit University of Illinois at Chicago
- 5. Executive Summary The Energy Resources Center performed an energy assessment at Court Theater, located at 6030 Ellis Avenue at the University of Chicago (UC) campus located in the Hyde Park neighborhood in Chicago, Illinois. The objective of the energy assessment was to identify energy conservation measures (ECMs) to be used by UC as a decision making benchmark for capital improvements. Table 1 summarizes the ECMs that were identified for Court Theater. Table 1: ECM summary for Court Theater Energy Savings Energy First Year Implementation Payback Energy Conservation Measure kWh MMBtu % Reduction Savings Cost (years) DDC Controls 84,410 kWh 288 MMBtu 21% $3,118 $12,000 3.8 High efficiency chiller retrofit 73,336 kWh 250 MMBtu 43% $2,709 $30,000 11.1 Total 157,746 kWh 538 MMBtu 28% $5,826 $42,000 7.2 Each of the ECMs evaluated present savings that are independent of each other. It is typical that when several ECMs are implemented in a single building, those ECMs would have an interactive effect on one another. That is, total energy savings are less than the sum of each individual ECM. For example, if recommendations were made for high efficiency motor retrofits and optimal start/stop on air handling supply fan motors, those savings would affect one another. High efficiency motor savings are calculated as a function of run time, 8,760 hours per year if ran continuously. Optimal start/stop of supply fan motors reduce fan motor run time, therefore, any hours that the supply fan operation is ceased would be a reduction in savings from the high efficiency motor retrofit. It is important to keep these interactive effects in mind when evaluating implementation of ECMs. The University of Chicago IV Energy Resources Center Court Theater Energy Audit University of Illinois at Chicago
- 6. I BUILDING DESCRIPTION General Information Court Theater is located at 5535 Ellis Avenue at the University of Chicago (UC) campus located in the Hyde Park neighborhood in Chicago, Illinois. Court Theatre formally had its beginning in 1955, when Marvin Phillips realized his dream of presenting performances under the stars on summer evenings. Classic theater in Chicago had a new start. During the next decade, Court Theatre laid down a tradition of performing imaginative revivals of the classics in outdoor summer repertory, with cast and crew drawn from the university and local communities. A major campaign conducted jointly by Court Theatre and UC in 1979 raised the necessary funds to construct a permanent theater facility for Court. The Abelson Auditorium, designed by Harry Weese, was specifically conceived to accommodate large productions of a classic repertory. The space is very intimate, with 3/4 round seating and no seat farther than seven rows from the stage. Court Theater’s total floor area is approximately 10,000 ft2. Figure 1: Court Theater The primary HVAC system(s) for Court Theater is located on the building’s roof. These system(s) consist of a rooftop air-handling unit with electric resistance heating and DX cooling. The University of Chicago 1 Energy Resources Center Court Theater Energy Audit University of Illinois at Chicago
- 7. Located near the main air-handling unit is the condenser/compressor unit. This system is equipped with two hermetically sealed compressors and is air cooled with two condenser fans. Occupancy Court Theaters occupancy patterns vary depending upon performance schedules. On average Court Theater conducts five productions annually. A detailed analysis was performed to understand the building and mechanical systems use patterns. Mr. Fritz Bennett, Court Theater production manager, provided the information to ERC. The following is a summary of the occupancy for from July 1, 1999 through June 30, 2000. Figure 2: Annual percentage of hourly use 0 hours 6% 15 hours 37% 9 hours 13 hours 55% 1% 10 hours 1% • 21 days totally unoccupied • 203 days with 9 hours of occupancy • 3 days with 10 hours of occupancy • 2 days with 13 hours of occupancy • 137 days with 15 hours of occupancy The occupancy hours breaks down to 3,938 hours occupied and 4,846 hours unoccupied. Ten percent of the occupied hours are for performance and 90 percent non-performance or theater preparation. Theater preparation occupancy is approximately 10 people per day. Court Theater The University of Chicago 2 Energy Resources Center Court Theater Energy Audit University of Illinois at Chicago
- 8. supplemental information for occupancy and lighting is presented in Appendix C. – Occupancy Dat II Building Envelope Exterior Walls The exterior shell of Court Theater consists of 3” limestone panels, 2” of rigid insulation and 10” concrete block. The walls are maintained on a regular basis and are in excellent condition. The U-value of the walls is estimated to be 0.074 Btu/hr-ft2- ºF. Figure 3: Court Theater outside wall 3“ Limestone 1“ Air Space 2“ Rigid Insulation Bituminous Damp Proofing Membrane 10“ Concrete Block The foundation wall consists of approximately 16” of reinforced concrete. The wall appears to be in good condition. The U-value of the foundation wall is estimated to be 0.46 Btu/hr-ft2-ºF. Windows Windows in Court Theater are minimal since the theater requires a controlled environment. A very small number of windows are present in the production/set design area. These windows provide natural lighting to supplement the high intensity lighting system in this area. The windows are commercial aluminum fixed type with single glazing. The windows are in good condition. The windows’ U-value is estimated at 0.55 Btu/hr-ft2-ºF. The University of Chicago 3 Energy Resources Center Court Theater Energy Audit University of Illinois at Chicago
- 9. Table 2: Court Theater windows No. of Windows U-Value Total Area of Doors Window Type (sq.ft.) (orientation) Fixed 8 (S) 96 0.55 Exterior Doors The exterior doors at Court Theater are kept to a minimum so as to control access to the various activities in the building. The main entry consists of a stainless steel framed vestibule with commercial grade plate glass doors. The doors have a brass threshold to control infiltration but due to the sleek modern design, lack weatherstripping. The utility doors consist of steel framed metal clad units. The U-values for the doors are 0.91 and 0.62, respectively. Table 3: Court Theater doors No. of Doors Total Area of Doors Door Type U-Value (orientation) (sq.ft.) Entry Doors 2 (S) 116 0.91 Security Doors 1 (W) 21 0.62 2 (N) 56 0.62 Roof The roof of Court Theater is flat and consists of an inverted built up roofing system. The following diagram illustrates the system in detail. The U-value of the roofing systems is approximately 0.049Btu/h-ft2-oF. The roof is in good condition therefore yielding an estimated remaining life of 10 years. The University of Chicago 4 Energy Resources Center Court Theater Energy Audit University of Illinois at Chicago
- 10. Figure 4: Roof detail Stone ballast 3” Rigid Insulation Inverted built-up roofing system 15# felt membrane 4-1/2” Concrete topping Metal decking The University of Chicago 5 Energy Resources Center Court Theater Energy Audit University of Illinois at Chicago
- 11. III ENERGY USING SYSTEMS A Primary Heating and Cooling Systems The primary mechanical system(s) for Court Theater is located on the building’s roof. These system(s) consist of a rooftop air-handling unit with electric resistance heating and DX cooling. Located near the main air-handling unit is the condenser/compressor unit. This system is equipped with two hermetically sealed compressors and is air cooled with two condenser fans. B Air Handling Systems The main air distribution consists of a rooftop air handler consisting of a 20 horsepower supply fan motor, DX cooling, and electrical resistance heating. The air handling system is equipped with a return network. C Domestic Hot Water An electric resistance hot water heater provides domestic hot water to Court Theater. D Lighting Court Theater is a very complex structure when looking at it from a lighting point of view. Theatrical lighting is a very precise art and is difficult to quantify since the lighting requirements change from performance to performance. Mr. Fritz Bennet, productions manager, assisted us with information to try to determine an annual baseline usage. He provided ERC with Court Theater’s detailed performance schedule and a study, which monitored the lighting load of the performance “The Invention of Love”. In addition, ERC conducted a detailed lighting inventory of all lighting fixtures installed in Court Theater. The information is presented in Appendix A. With this information, ERC was able to estimate the lighting load for all performances for the 1999-2000 theatrical season. Court Theater has a total of 206 theatrical lighting fixtures, 156 dimmers, and 300 general lighting fixtures installed throughout the building with a total load of 297.94 kW. Approximately 99% of the lighting fixtures are incandescent. The remaining 1% consists of fluorescent fixtures. The University of Chicago 6 Energy Resources Center Court Theater Energy Audit University of Illinois at Chicago
- 12. Of the 99% incandescent fixtures, 89% consist of theatrical lights and 10% consist of general- purpose lights. Table 4 and Figure 5 summarize the installed lighting system. Appendix A includes a full inventory of the complete lighting system for the building. The system and controls are in good working condition and do not require additional upgrade or maintenance at this time. Table 4: Summary of Installed Lighting Fixtures Installed KW % Inc - General 29.10 9.8% Inc - Theatrical 265.74 89.2% Fluorescent 3.10 1.0% Exit - 8w - T5 0.198 Auditorium footlights 0.255 1 x 4- 2 lamp - T12 0.401 2x4 - 2 lamp - T12 0.642 2x4 - 4 lamp - T12 1.605 Total Installed KW 297.94 Figure 5: Summary of Lighting Fixtures Inc - Theatrical 89.2% Inc - General Inc - Theatrical Fluorescent Inc - General Fluorescent 9.8% 1.0% E Other Equipment Other equipment at Court includes equipment utilized by the theater group for performances and preparation. The University of Chicago 7 Energy Resources Center Court Theater Energy Audit University of Illinois at Chicago
- 13. IV ENERGY CONSUMPTION ANALYSIS Current Energy Consumption Energy at Court Theater is 100 percent electrical provided by Commonwealth Edison (ComEd). There are four separate electrical service feeds that provide power to Court Theater. Court Theater electricity is served, as well as all U of C buildings, under a single utility rate. During the period of analysis, U of C was being provided electricity, through ComEd, at a significantly reduced rate. Starting December 2000, U of C will contract with Enron for electricity. Costs demonstrated in Table 5 are based upon the future Enron rate. This was done in order to ensure that when comparing utility costs to ECM savings, that the comparison is performed with parity. Demand costs above 10,000 kW campus wide are accessed at a reduced cost per kW of $6.51 and $5.03 for summer and winter, respectively. Any demand savings associated with ECMs demonstrated in this report will be based upon those costs. Table 5: Court Theater electric usage, demand and cost Usage (kWh) Cost Month Peak Offpeak Total Demand (kW) Load Factor Total July 25,573 30,413 55,986 120 61% $3,803 August 29,804 29,337 59,141 134 63% $4,613 September 24,875 19,719 44,594 68 94% $3,047 October 26,747 25,595 52,342 83 83% $3,270 November 21,095 20,841 41,936 91 66% $2,908 December 15,547 13,026 28,573 54 71% $1,917 January 25,643 21,849 47,492 61 95% $2,839 February 32,201 29,809 62,010 139 64% $4,385 March 32,217 29,530 61,747 88 94% $3,767 April 30,031 31,453 61,484 89 99% $3,706 May 13,006 10,206 23,218 40 80% $1,525 June 12,713 10,296 23,009 32 93% $1,520 Total kWh 289,452 272,073 561,532 80% $37,300 Total MMBtu 988 928 1,916 The University of Chicago 8 Energy Resources Center Court Theater Energy Audit University of Illinois at Chicago
- 14. Figure 6: Electrical usage profile 35,000 30,000 25,000 Usage (kWh) 20,000 15,000 10,000 5,000 0 ay ly ril ry ch st ne er y r r r be be be ar Ju Ap gu ua M ob ar Ju nu em em em br Au M ct Ja Fe O pt ov ec Se N D Peak Offpeak Figure 7: Electric demand profile 160 140 120 Demand (kW) 100 80 60 40 20 0 r ry ry r r ay st ch e r ly ril be be be be n Ju gu Ap ua ua ar M Ju em em em o Au br n M ct Ja O ov pt Fe ec Se N D Total Energy Energy usage in a building can be effectively summarized through the use of the energy usage index (EUI). The EUI provides the total energy usage of a building in common units of MMBtu The University of Chicago 9 Energy Resources Center Court Theater Energy Audit University of Illinois at Chicago
- 15. per building square footage. When expressed in this manner, building energy usage can be compared appropriately to buildings of similar operation. At an area of 10,000 ft2, the EUI at Court Theater is approximately 0.192 MMBtu/ft2/year. Table 6 summarizes the total energy usage and EUI, current and projected, for Court. The projected ECMs, based upon calculations demonstrated in this report, project and EUI of 0.138 MMBtu/ft2/year. Table 6: Energy summary and EUI Current Energy Consumption Projected Energy Consumption Electrical Energy 561,532 kWh Electrical Energy 403,785 kWh 1,916 MMBtu 1,378 MMBtu Total Energy 1,916 MMBtu Total Energy 1,378 MMBtu energy usage index (EUI) 0.192 MMBtu/ft^2/year energy usage index (EUI) 0.138 MMBtu/ft^2/year The University of Chicago 10 Energy Resources Center Court Theater Energy Audit University of Illinois at Chicago
- 16. Building Energy Profile Electric Profile Table 7 and Figure 8 provide analyses of energy usage for Court Theater in terms of energy usage (kWh) and building electrical usage profile. Table 7: Electrical demand and usage distribution kWh Winter Summer Annual Lighting (General) 37,031 41,977 79,008 Lighting (Performance) 15,147 18,814 33,962 Lighting (Parking) 18,214 13,010 31,225 Chiller/Condenser - 170,470 170,470 Electrical Resistance Heat 148,851 - 148,851 Air Handling Unit 53,223 38,016 91,239 Other 3,954 2,824 6,778 Total 276,419 285,112 561,532 Total (in MMBtu) 943 973 1,916 Figure 8: Energy usage profile Lighting (General) Lighting (Performance) 14% 6% Lighting (Parking) Other 6% 1% Air Handling Unit 16% Chiller/Condenser 30% Electrical Resistance Heat 27% The University of Chicago 11 Energy Resources Center Court Theater Energy Audit University of Illinois at Chicago
- 17. V Operations and Maintenance Procedures Ventilation The discharge register in the office area of Court is currently dumping conditioned air. Measures should be taken to install discharge dampers to regulate the discharge of air. By regulating the discharge air, comfort, draft and energy issues can be mitigated. Space Heating 1. Lower the thermostats during the heating season and raise the thermostats during the cooling season. If your building is like most, you can save about 15% of your heating fuel bill by lowering the thermostat(s) a five degrees. 2. Use night setback on heating systems with zone controls. Maintaining 55 or 60F at night will reduce energy consumption by 5% to 6% during the night hours. 3. Do not heat storerooms unless heat is for protection of stored contents 4. Calibration of all instruments should be checked annually and, as operators notice deficiencies, they should be corrected immediately. 5. Turn off non-critical exhaust fans. 6. In mild weather, lower the cooling effect by running room cooling fans at lower speeds. 7. Begin pre-cooling operations so noncritical areas are 80°F by the time occupants arrive. Complete cool down during the first hour of occupancy. 8. Reduce internal heating generation as much as possible during the cooling season. Typical sources of heat generation include lighting, people, machines, cooking equipment, etc. 9. Heat transfer surfaces of radiators, convectors, baseboard and finned tube must be kept clean for efficient operation. Air Filters Air filters are a necessary and costly component of air-handler operation. The cost includes the price of the air filter itself (a fixed cost) plus the cost of the energy to move the air through the filter (highly variable depending on filter characteristics, sizes, final static pressure drop, etc). Cost-effective, energy-saving air filters for commercial heating, ventilation, and air conditioning systems have been on the market for quite some time, but building owners and managers The University of Chicago 12 Energy Resources Center Court Theater Energy Audit University of Illinois at Chicago
- 18. continue to use the lower grade conventional filters. This ultimately drives the operations cost up and mitigates the air quality of the building with respect to the air filter efficiency. Consideration should be given to using premium air filter bags (manufactured under the tradenames Viledon, LUWA and others) instead of the existing Tridim air filter bags at COURT. Experience with the Viledon air filter bags has shown that prefilters are not necessary in most air-handling systems with no detriment to the life of the bag. This yields the lowest possible initial static pressure drop across the filter bank, which results in the lowest energy use/cost for COURT fan systems. The Viledon bags are more expensive than conventional bag-type air filters, however, the simple payback on the investment is often less than two years. Case studies are available from premium air filter manufacturers. The University of Chicago 13 Energy Resources Center Court Theater Energy Audit University of Illinois at Chicago
- 19. VI Energy Conservation Measures This section identifies and discusses energy conservation measures (ECMs). All ECMs evaluated for cost saving are demonstrated independently of other building ECMs that may have interactive effects. These effects act to reduce the overall savings of the ECMs. The ECMs discussed are based on their technical and economic feasibility. Economic feasibility is demonstrated using engineering calculations to ascertain energy savings, relevant utility rates to demonstrate cost savings, and contractor implementation costs to establish a simple payback for each project. ECM technical feasibility takes into account considerations that are concerned with installation and effects that are concerned with issues such as occupant comfort. All ECMs are applicable to any and all local codes. Dollars saved were calculated using an average cost per kWh based on ComEd rate 6L less seven percent per Enron. A summary of the ECMs at Court Theater is shown in Table 8. Table 8: ECM summary for Court Theater Energy Savings Energy First Year Implementation Payback Energy Conservation Measure kWh MMBtu % Reduction Savings Cost (years) DDC Controls 84,410 kWh 288 MMBtu 21% $3,118 $12,000 3.8 High efficiency chiller retrofit 73,336 kWh 250 MMBtu 43% $2,709 $30,000 11.1 Total 157,746 kWh 538 MMBtu 28% $5,826 $42,000 7.2 The University of Chicago 14 Energy Resources Center Court Theater Energy Audit University of Illinois at Chicago
- 20. ECM #1: Energy Management System An energy management system (EMS) can save energy by optimizing the control of several components of the existing HVAC system(s) that are currently not controlled or controlled manually. Direct digital control (DDC) is the recommended technology for this type of system. A DDC controller is capable of not only providing energy management, but total facility management as well, such as security. Specifically this ECM will allow energy savings through: Use of Economizer Cycles (Enthalpy Economizer) Temperature setback Optimal start/stop of supply fan motor An EMS is designed to run individual pieces of equipment more efficiently and to permit integration of equipment, enhancing performance of the system. In a typical EMS, sensors monitor parameters such as air and water temperatures, pressures, humidity levels, flow rates, and power consumption. From those performance points, electrical and mechanical equipment run times and setpoints are controlled. Each component of the control system contributes to the total savings of this ECM and will be explained in detail in the following paragraphs. Table 10 will present the total savings, total cost and simple payback of this ECM. Use of Economizer Cycles (Enthalpy Economizer) An enthalpy economizer takes into account the effects of temperature and humidity. Free cooling can be realized anytime the outdoor temperature and humidity are below a desired enthalpy setpoint (usually 23 Btu/lb) and the building is calling for cooling. The DDC controller automates this activity. The governing equation for economizer energy savings follows: Qsaved (Btu) = 4.5 × CFM × (houtside - hsetpoint) × th Where: Qsaved= Energy saved due to ‘free cooling’ (Btu) The University of Chicago 15 Energy Resources Center Court Theater Energy Audit University of Illinois at Chicago
- 21. CFM= Total fan CFM of all supply fans hsetpoint= Enthalpy setpoint (usually 23 Btu/lb) houtside= Outdoor enthalpy (from BIN Data) 4.5= Conversion constant th= Total hours for each individual bin The total savings are summarized in Table 9 below. This table uses the BIN method to calculate total savings over a wide range of climatic conditions. This is an accurate way of predicting savings, second only to modeling the system with a building loads simulation program (e.g. DOE-2). Table 9: Bin method savings analysis Total Total Bin Occupied Unoccupied Free Cooling Savings $ Savings Temp Enthalpy Hours Hours (BTU/hr) kWh electric 92 38.42 69 28 0 0 $0 87 35.67 159 63 0 0 $0 82 32.29 240 122 0 0 $0 77 30.68 263 249 0 0 $0 72 27.75 303 502 0 0 $0 67 26.55 194 493 0 0 $0 62 23.87 183 433 0 0 $0 57 22.08 233 389 82,800 5,651 $209 52 19.18 214 371 343,800 21,592 $797 47 17.19 215 362 522,900 33,004 $1,219 42 14.79 231 405 0 0 $0 37 12.59 303 417 0 0 $0 32 10.95 333 625 0 0 $0 27 8.95 180 331 0 0 $0 Total Savings 60,247 kWh $2,225 The University of Chicago 16 Energy Resources Center Court Theater Energy Audit University of Illinois at Chicago
- 22. Temperature setback As the name implies, night temperature setback allows for less cooling in summer and less heating in winter during unoccupied hours. A 10°F temperature setback is typical for this type of control strategy. The governing equation for temperature setback is as follows: Qsaved (Btu) = Tback/(Tsetpoint – Tavg) × (occ. hours/168) × (HDDnormal/ HDDbase) × Qbase Where: Tback Temperature setback Tsetpoint Indoor temperature setpoint Tavg Average outdoor winter temperature Occ. hours Building occupied hours 168 Total hours in one week HDDnormal Normal HDD HDDbase Base year HDD Qbase Base heating load Optimal Start/Stop of HVAC Supply Fan(s) Currently the rooftop supply fan motor operates continuously. Optimal start/stop enables the entire system to look ahead several hours and, relative to current conditions, make decisions about how to proceed; this allows the system to ramp up slowly, avoiding morning demand spikes or unnecessary run times. The governing equation for start/ stop is as follows: E = hp × 0.746 × .80 × th / η Where: E= Energy saved when fans are off (kWh) hp= Total fan hp of all supply fans th= Total hours fans are scheduled ‘off’ (hours/year) 0.80= Load factor 0.746= Conversion constant The University of Chicago 17 Energy Resources Center Court Theater Energy Audit University of Illinois at Chicago
- 23. η= Motor efficiency Table 10 summarizes the savings and cost associated an energy management system. Table 10: DDC system summary1 Implementation Cost $12,000 First Year Savings $3,118 Energy Savings 84,410 kWh Energy Savings 288 MMBtu Energy Percent Reduction 21% Payback 3.8 ECM #1: Chiller Retrofit Current operational efficiency of the compressor/condenser is expected to be low. Based upon the type, age and condition the estimated efficiency is 1.3 kW/ton. Newer condenser technologies of similar size are available in the 0.75-kW/ton2 efficiency range. A higher efficiency chiller will save energy by optimizing the energy input required to provide cooling efficacy by the compressor(s). The governing equation that describes the energy savings for retrofitting with a higher efficiency chiller follows: 1 1 Energy savings (kWh) = Current energy use ( New eff. - Old eff. ) Table 11 summarizes the total savings and cost associated with implementation of a DDC system. 1 Jim Perisin, Johnson Control, 708-418-2268 2 Trane unit, model number XX, IPL = 16.2 Btu/watt-hr: 1/(16.2 Btu/watt-hr) × (1,000 watt/kW) / (12,000 Btu/ton- hr) = 0.74 kW/ton. The University of Chicago 18 Energy Resources Center Court Theater Energy Audit University of Illinois at Chicago
- 24. Table 11: Chiller retrofit summary3 Implementation Cost $30,000 First Year Savings $2,709 Energy Savings 73,336 kWh Energy Savings 250 MMBtu Energy Percent Reduction 43% Payback 11.1 3 Costs provided by Kevin Kisala at Air Comfort, 708-345-1901. The University of Chicago 19 Energy Resources Center Court Theater Energy Audit University of Illinois at Chicago
- 25. Appendix A - Lighting The University of Chicago 20 Energy Resources Center Court Theater Energy Audit University of Illinois at Chicago
- 26. Appendix B. – Energy Calculations The University of Chicago 21 Energy Resources Center Court Theater Energy Audit University of Illinois at Chicago
- 27. The University of Chicago 22 Energy Resources Center Court Theater Energy Audit University of Illinois at Chicago
- 28. Appendix C. – Occupancy Data The University of Chicago 23 Energy Resources Center Court Theater Energy Audit University of Illinois at Chicago
- 29. The University of Chicago 24 Energy Resources Center Court Theater Energy Audit University of Illinois at Chicago
- 30. Appendix D – Floor Plans The University of Chicago 25 Energy Resources Center Court Theater Energy Audit University of Illinois at Chicago