US SME Exports Over Time Sources Small Businesses
•
0 gostou•385 visualizações

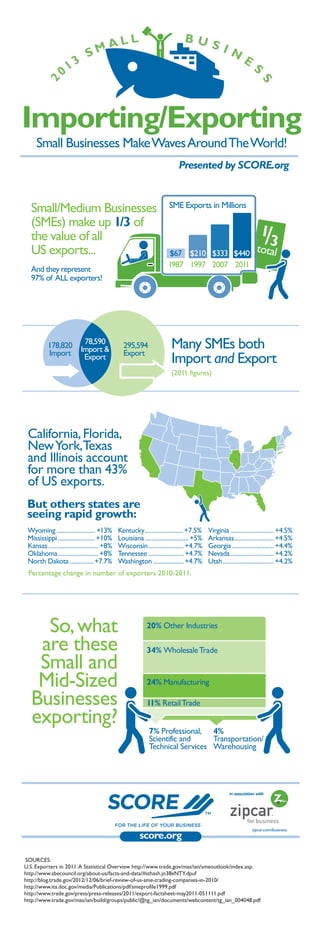
SCORE Infographic on stats and trends in small business transportation
Recomendados

Recomendados
Mais conteúdo relacionado
Semelhante a US SME Exports Over Time Sources Small Businesses
Semelhante a US SME Exports Over Time Sources Small Businesses (20)
Mais de RoadMap Marketing
Mais de RoadMap Marketing (18)
Último
Último (16)
US SME Exports Over Time Sources Small Businesses
- 1. SOURCES: U.S. Exporters in 2011:A Statistical Overview http://www.trade.gov/mas/ian/smeoutlook/index.asp. http://www.sbecouncil.org/about-us/facts-and-data/#sthash.jn38eNTY.dpuf http://blog.trade.gov/2012/12/06/brief-review-of-us-sme-trading-companies-in-2010/ http://www.ita.doc.gov/media/Publications/pdf/smeprofile1999.pdf http://www.trade.gov/press/press-releases/2011/export-factsheet-may2011-051111.pdf http://www.trade.gov/mas/ian/build/groups/public/@tg_ian/documents/webcontent/tg_ian_004048.pdf in association with zipcar.com/business. Presented by SCORE.org Importing/Exporting Small Businesses MakeWavesAroundTheWorld! Small/Medium Businesses (SMEs) make up 1/3 of the value of all US exports... And they represent 97% of ALL exporters! 1987 1997 2007 2011 $67 $210 $333 $440 SME Exports in Millions total Many SMEs both Import and Export (2011 figures) 178,820 Import 295,594 Export 78,590 Import & Export California,Florida, NewYork,Texas and Illinois account for more than 43% of US exports. Percentage change in number of exporters 2010-2011. Wyoming ........................ +13% Mississippi .......................+10% Kansas ............................... +8% Oklahoma......................... +8% North Dakota...............+7.7% Kentucky........................+7.5% Louisiana ........................... +5% Wisconsin......................+4.7% Tennessee ......................+4.7% Washington ...................+4.7% Virginia ...........................+4.5% Arkansas.........................+4.5% Georgia ..........................+4.4% Nevada...........................+4.2% Utah................................+4.2% So,what are these Small and Mid-Sized Businesses exporting? 20% Other Industries 34% WholesaleTrade 24% Manufacturing 11% RetailTrade 7% Professional, Scientific and Technical Services 4% Transportation/ Warehousing