
Recomendados
Mais conteúdo relacionado
Mais procurados
Destaque
Semelhante a Modeling the Active Wedge behind a Gravity Retaining Wall
Semelhante a Modeling the Active Wedge behind a Gravity Retaining Wall (20)
Modeling the Active Wedge behind a Gravity Retaining Wall
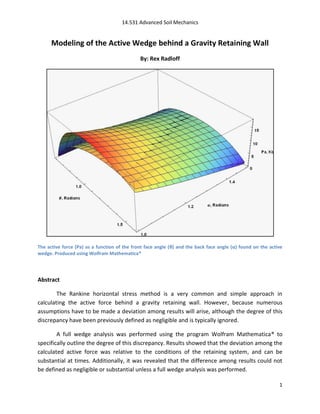
- 1. 14.531 Advanced Soil Mechanics Modeling of the Active Wedge behind a Gravity Retaining Wall By: Rex Radloff The active force (Pa) as a function of the front face angle (θ) and the back face angle (α) found on the active wedge. Produced using Wolfram Mathematica® Abstract The Rankine horizontal stress method is a very common and simple approach in calculating the active force behind a gravity retaining wall. However, because numerous assumptions have to be made a deviation among results will arise, although the degree of this discrepancy have been previously defined as negligible and is typically ignored. A full wedge analysis was performed using the program Wolfram Mathematica® to specifically outline the degree of this discrepancy. Results showed that the deviation among the calculated active force was relative to the conditions of the retaining system, and can be substantial at times. Additionally, it was revealed that the difference among results could not be defined as negligible or substantial unless a full wedge analysis was performed. 1
- 2. 14.531 Advanced Soil Mechanics Table of Contents Introduction……………………………………………….……………………………………………………………..…………3 Rankine Active Wedge………………………………………………………………………………………………………….3 Wedge Analysis……………………………………………………………………………………………………………………4 Case 1 (θ = 72: 90:, φw = 34:)……………………………………………………………………………………..….5 Results: Case 1 (θ = 72: 90:, φw = 34:)……………………………………………………………………………5 Failure Criteria: Case 1 (θ = 72: 90:, φw = 34:)…………………………………………………………….….6 Case 2 (θ = 45: 90:, φw = 34:)……………………………………………………………………………………..….7 Results: Case 2 (θ = 45: 90:, φw = 34:)……………………………………………………………………………8 Failure Criteria: Case 2 (θ = 4: 90:, φw = 34:)………………………………………………………………….8 Conclusion……………………………………………………………………………………..………………………………….…9 References.…………………………………………………………………………………………………………………..…...12 Appendices.………………..………………………………………………………………………………………………..…...13 2
- 3. 14.531 Advanced Soil Mechanics Introduction As an engineer it is important to accurately produce results in a short amount of time. Producing incorrect results quickly is unacceptable as the same goes for producing the correct result over an extended period of time. It is common practice for an engineer to minimize time by making assumptions and producing results that are within the range of error. However, if this practice is fully adopted, then there may be times when an assumption can be at the expense of an accurate result. The following will attempt to place the degree of significance of putting more time into improving the results calculated from the Rankine method when analyzing a retaining wall, and determining frankly, “is it worth it?” Rankine Active Wedge The Rankine horizontal stress method is a very common and simple approach in calculating the active force behind a gravity retaining wall. The assumptions associated with this method is that the wall friction is φw = 0:, front face of the wedge is θ = 90:, back face of the wedge is α = 45 + φ/2, overburden grade is β = 0:, and the resultant of the active force acts at a distance of H/3 from the base. Figures 1 and 2 demonstrate these constraints by showing the geometry of the driving wedge and stress distribution behind the retaining wall. However, again, this analysis represents the case with all of the above assumptions and there is no way of knowing if these conditions are those that produce the highest active force. Therefore, a full wedge analysis will need to be performed while these variables are free to deviate, and the conditions which produce the largest active force should be compared with those from the above method. It is important to stress that it is not the difference between each calculated active force that is of concern, rather the difference of produced moment on the foundation, which is a function of the resultants location. Figure 1 Geometry of the driving wedge under the Rankine active wedge analysis. 3
- 4. 14.531 Advanced Soil Mechanics Figure 2 Stress distribution of the active pressure behind a gravity retaining wall using the Rankine horizontal active stress parameter Ka. Wedge Analysis To perform an accurate wedge analysis behind a gravity retaining wall, Figure 3 must be considered in its entirety. The known variables are as follows: wall dimensions and materials, soil and wall shear strength parameters, and the grade of the overburden soil. The variables to be solved for, at the maximum active force, is the angle of the front face (θ), the angle of the back face (α), and location of the active force. To model such a problem, it is preferred to use a modeling program such as Wolfram Mathematica® to plot and interpret data. Figure 3 Active wedge with consideration towards θ, β, and φw 4
- 5. 14.531 Advanced Soil Mechanics Case 1 (θ = 72⁰ 90⁰, φw = 34⁰) The example which will be interpreted for comparison purpose can be seen in Figure 4. The analysis will consider the blue and red wedge with and without wall friction (φw). The example did limit the overburden grade (β) to 0: in hopes to recognize any deviation specifically related to the Rankine method. Also the maximum angle (θ) of the front face of the wedge in red is controlled by the wall dimensions. Figure 4 Example 1 for an active wedge analysis Results: Case 1 (θ = 72⁰ 90⁰, φw = 34⁰) The data from case 1 was analyzed using Wolfram Mathematica and can been seen in Figure 5. The active force (Pa) and angle of the back face (α) of the blue wedge (θ = 90:) are 6.51 Kips and 56.8: for the analysis with wall friction, and 7.12 Kips and 62.0: for the analysis without wall friction. It should be noted that α = 62.0: is also equal to 45 + φw/2. The results yielded are fairly close to one another; however the differences in moments still need to be interpreted to actually understand its influence on the design. The active force (Pa) and angle of the back face (α) of the red wedge (θ = 71:) are 11.24 Kips and 61.2: for the analysis with wall friction, and 10.84 Kips and 71.2: for the analysis without wall friction. The active forces calculated are fairly close to one another; however the angles of the back face (α) deviate by 10:. This is especially important, as an engineer uses the location of the failure in certain types of retaining wall design, i.e. using tiebacks, soil nails, or dead-man anchors. 5
- 6. 14.531 Advanced Soil Mechanics Figure 5 Wedge analysis using the following: γ = 117 pcf, Cs = 0 psf, Cw = 0 psf, H = 20.75 ft, Wh = 6.00 ft, φ = 34⁰, β = 0⁰ Between both sets of values, the calculated active force (Pa) and angle of the back face (α) deviate significantly from one another. These results show an underestimation of the active force by a factor of 1.7. With that said, this does not mean the foundation was under designed by the same factor; there still needs to be an analysis done on the retaining walls failure criteria, which takes into consideration the location of each resultant. Failure Criteria: Case 1 (θ = 72⁰ 90⁰, φw = 34⁰) The failure criteria of a retaining wall – shallow foundation system consists of overturning, sliding, eccentricity, and bearing capacity, and any deviation in the above results will only be considered depending on their effects on this criteria. Table 1 present this failure criteria for each case. For the analysis of the blue wedge (θ = 90:), the failure criteria deviated by a factor 1.4 and 1.7 for the factor of safety against sliding and the maximum bearing stress respectively. This hints that the resultant shifted enough to create a large enough difference in moments and also verifies the significance of the wall friction, regardless of the similar active forces. For the analysis of the red wedge (θ = 71:), the failure criteria deviated by 1.6 and 1.9 for the factor of safety against sliding and the maximum bearing stress respectively. 6
- 7. 14.531 Advanced Soil Mechanics Table 1 Values against the failure criteria for each analysis Case FS Over- FS Eccentricity q MAX Turning Sliding (ft) (ksf) θ = 90:, φw = 34:, 3.53 3.47 -1.45 31 Pa = 6.51 Kips, α = 56.8: θ = 90:, φw = 0:, 3.69 2.46 0.53 18 Pa = 7.12 Kips, α = 62.0: θ = 71:, φw = 34:, 0.53 2.68 -0.04 17 Pa = 11.24 Kips, α =61.2: θ = 71:, φw = 0:, 0.85 1.61 3.48 32 Pa = 10.84 Kips, α = 71.2: However, the two wedges of interest are the blue (θ = 90:) and the red (θ = 71:), as they represent the two extremes between making and not making assumptions. The values presented in Table 1 show a deviation by a factor of 7.0 for the factor of safety against overturning; the remaining values are close enough to ignore any difference. Nevertheless, the difference in the factor of safety against overturning is enough to consider the two methods. Case 2 (θ = 45⁰ 90⁰, φw = 34⁰) The second case that will be interpreted under the wedge analysis can be seen in Figure 5. The purpose of this example is to understand if there is any validity to the above results, which can be determined by extending the front face angle (θ) to an extreme case and monitor how each result varies. The blue wedge will represent the Rankine case being interpreted with and without wall friction (as analyzed before) and the red wedge will represent the extreme case with the front face angle (θ) equal to 0, with and without wall friction. Figure 5 Example 2 for an active wedge analysis 7
- 8. 14.531 Advanced Soil Mechanics Results: Case 2 (θ = 45⁰ 90⁰, φw = 34⁰) The data from case 2 was analyzed using Wolfram Mathematica and can been see in Figure 6. The active force (Pa) and angle of the back face (α) of the red wedge (θ = 45:) are 29.03 Kips and 62.0: for the analysis with wall friction, and 21.41 Kips and 84.5: for the analysis without wall friction. The active forces calculated now begin to separate much more than before, as does the difference in the angle (α) of the wedges back face. Also, the active force and angle of the back face found under the blue wedge (θ = 45:) are the same from the previous example. Figure 6 Wedge analysis using the following: γ = 117 pcf, Cs = 0 psf, Cw = 0 psf, H = 20.75 ft, Wh = 6.00 ft, φ = 34⁰, β = 0⁰ Failure Criteria: Case 2 (θ = 45⁰ 90⁰, φw = 34⁰) The two wedges of interest are the Rankine wedge (blue, θ = 90:) without wall friction and the red wedge (θ = 45:) with wall friction. Results from the failure criteria show a larger deviation between each case, but more importantly the maximum bearing stress (q MAX) deviates by a factor of 1.57. This proves that increasing the front face angle (θ) to a certain degree will lead to a significant deviation between the maximum bearing stress. It should also be noted that the overturning values approach infinity as the resultant of the active force points below the point of rotation (pt. O). 8
- 9. 14.531 Advanced Soil Mechanics Table 2 Values against the failure criteria for each analysis Case FS Over- FS Eccentricity q MAX Turning Sliding (ft) (ksf) θ = 90:, φw = 34:, 7.11 7.07 -1.93 50 Pa = 6.51 Kips, α = 56.8: θ = 90:, φw = 0:, 15.04 5.19 0.70 35 Pa = 7.12 Kips, α = 62.0: θ = 45:, φw = 34:, ∞ 7.23 -1.90 55 Pa = 11.24 Kips, α =61.2: θ = 45:, φw = 0:, ∞ 2.36 2.66 42 Pa = 10.84 Kips, α = 71.2: Conclusion The full wedge analysis, for the active case, proves that there is no significant difference between regarding and disregarding wall friction when comparing the active force. However, because of a shift in the location of the active forces resultant, a difference in moments is created, making for a significant change in the values produced under the failure criteria. Therefore it is important to consider the wall friction when analyzing a specific wedge. The effects of deviating the front face angle (θ) is relative to the conditions. Figure 7 shows the two active force curves, with and without wall friction, and its relationship with the front and back face angles (θ, α) of the failure wedge. The plot shows two aggressive curves which actually intersect at a critical location. Visually it can be understood that these functions are difficult to predict beforehand; also as there is a decrease with the front face angle (θ), there is a larger deviation between the active forces (Pa) calculated with and without wall friction. However, the moments created and its influence on the failure criteria are of more importance, as this is what dictates design. The above proves that by making assumptions to simplify a problem and to save time, the retaining wall – shallow foundation system can be significantly over or under designed. And because it is not realistic to predict the influence of these assumptions beforehand, a full analysis should be performed for assurance. 9
- 10. 14.531 Advanced Soil Mechanics φw = 34: φw = 0: Figure 7 The active force (Pa) as a function of the front face angle (θ) and the back face angle (α) 10
- 11. 14.531 Advanced Soil Mechanics References Das, B.M., (2006). “Principles of Geotechnical Engineering – Sixth Edition” Lambe, T.W., and R.V. Whitman, (1969). “Series in Soil Engineering – Soil Mechanics” Mangano, Sal, (2010). “Mathematica Cookbook” ® AutoCAD 2011 ® Wolfram Mathematica 11