1. Atomic Emission: Flame Test
Electrons emit wavelengths of energy when they return from an excited (high energy) state to a
ground (initial) state. In the visible region of the EM spectrum, these wavelengths are observed
as colors. Elements display unique colors when their electrons are excited. Flame Tests are the
earliest form of electron excitations. When different elements are mixed with TNT and
gunpowder, multi-colored fireworks are created.
In today’s experiment, the accuracy of the Rydberg formula will be measured for the elements
Copper, Iron, and Sodium.
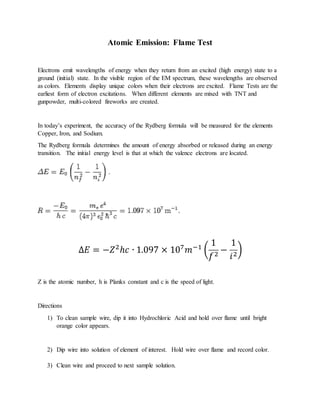
The Rydberg formula determines the amount of energy absorbed or released during an energy
transition. The initial energy level is that at which the valence electrons are located.
∆𝐸 = −𝑍2
ℎ𝑐 ∙ 1.097 × 10⁷
𝑚−1
(
1
𝑓2
−
1
𝑖2
)
Z is the atomic number, h is Planks constant and c is the speed of light.
Directions
1) To clean sample wire, dip it into Hydrochloric Acid and hold over flame until bright
orange color appears.
2) Dip wire into solution of element of interest. Hold wire over flame and record color.
3) Clean wire and proceed to next sample solution.
2. Calculations
1) Match color with wavelength on following website:
http://www.wolframalpha.com/widgets/view.jsp?id=628bfed9ce559d754c3eabcfca44366
b
2) Use formula c=λν to solve for the frequency of the color observed.
3) Use formula E=hν to find the energy of the wavelength.
4) Use the Rydberg formula to solve for the excited energy level of an electron from an
element.
Element Color Wavelength Frequency Energy Excited
Energy
Level
Sodium
Calcium
Nickel
5) Was it possible to find the excited energy level for all of the elements tested? If not, Why
didn’t the Rydberg formula work?
Laboratory Report Format
Introduction: State Objective and Chemical Reaction involved. Define Stoichiometry
Procedure: List steps taken and data collected.
Conclusion: Did experiment work?