2. About the Company
Ford Motor Company is transforming itself to be more globally integrated and
customer-driven in the fiercely competitive world market of the 21st century. Our goal
is to build more of the products that satisfy the wants and needs of our customers.
We are working as a single worldwide team to improve our cost structure, raise our
quality and accelerate our product development process to deliver more exciting
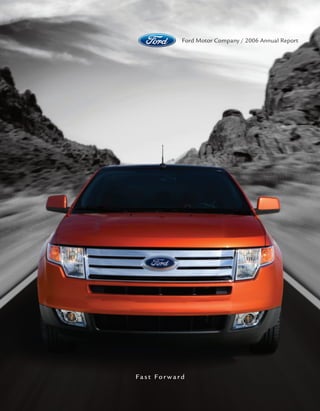
new vehicles faster. Featured on the front and back cover of this report is one of
those vehicles, the 2007 Ford Edge.
Ford Motor Company, a global industry leader based in Dearborn, Michigan,
manufactures or distributes automobiles in 200 markets across six continents. With more than
280,000 employees and more than 100 plants worldwide, the company’s core and affiliated
automotive brands include Ford, Jaguar, Land Rover, Lincoln, Mercury, Volvo, Aston Martin
and Mazda. The company provides financial services through Ford Motor Credit Company.
Contents
1 Operating Highlights
2 A Message from the Executive Chairman and Chairman of the Board
3 A Message from the President and Chief Executive Officer
6 Great Products from Strong Brands
8 Board of Directors and Executives
9 Financial Contents
112 Shareholder Information
113 Global Overview
The American automotive legend lives on with the 2007 Mustang.
Nearly half the sports cars sold in the United States are Mustangs.
3. Operating Highlights
2006 2005
Sales and Revenues
Worldwide wholesale unit volumes
by automotive segment (in thousands)
Ford North America 3,051 3,410
Ford South America 381 335
Ford Europe 1,846 1,753
Premier Automotive Group 730 764
Ford Asia Pacific and Africa/Mazda 589 505
Total 6,597 6,767
Sales and revenues (in billions)
Automotive $ 143.3 $ 153.5
Financial Services 16.8 23.4
Total $ 160.1 $ 176.9
Financial Results
Income/(loss) before taxes (in billions)
Automotive $ (17.0) $ (3.9)
Financial Services 2.0 5.0
Total $ (15.0) $ 1.1
Net income/(loss) (in billions) $ (12.6) $ 1.4
Diluted net income/(loss) per share of Common
and Class B Stock $ (6.72) $ 0.77
Cash and Spending
Automotive capital expenditures
Amount (in billions) $ 6.8 $ 7.1
As a percentage of automotive sales 4.8% 4.6%
Automotive cash at year end (in billions)
Automotive gross cash (a) $ 33.9 $ 25.1
– Cash net of automotive debt 3.9 7.2
Shareholder Value
Dividends per share $ 0.25 $ 0.40
Total shareholder returns % (b) 1% (45)%
(a) Consists of cash and cash equivalents, net marketable securities, loaned securities and short-term Voluntary
Employee Beneficiary Association (VEBA) trust assets (in which $1.8 billion of financial assets were held at
the end of 2006 and $1.4 billion at the end of 2005 to pre-fund certain types of company-paid benefits for
U.S. employees and retirees).
(b) Change in value of Ford stock assuming dividends are reinvested in Ford stock. (Source: Bloomberg)
1
4. A fter a difficult year in 2006, Ford Motor Company stands at a
pivotal crossroad. In the face of fierce global competition, we are
taking dramatic and sometimes painful steps to transform our
business. We have improved our cost structure, raised our quality, obtained
financing and refilled our product pipeline with exciting new vehicles.
A Message from the
Executive Chairman and
Chairman of the Board
Alan Mulally, our new President and CEO, is an engineer who is
passionate about customers and knows how to win in a global market.
He is moving us quickly toward our goal of being more globally integrated
and competitive. We have a lot of work to do, but we have made solid
progress in a short period.
We are taking actions to reduce our operating costs and realign our
capacity to reflect the realities of the market. At the same time, we are
speeding up and strengthening our new product development process to
take full advantage of our global resources and growing world markets.
Our turnaround will take time, but we are determined to make it happen.
The ongoing success of Ford Motor Company is my life’s work. I want
us to be the company that makes a difference in people’s lives – one that
inspires its employees, delights its customers, rewards its shareholders
and makes the world a better place. To do that we must deliver desirable
products with a competitive cost structure and a sustainable business model.
We are taking major steps to ensure that we succeed at these
fundamentals, as well as our larger mission. I am confident in our team
and in our plan. And I am more determined than ever to build a great
Ford Motor Company for the next 100 years and beyond.
William Clay Ford, Jr.
Executive Chairman and Chairman of the Board
March 7, 2007
Bill Ford (above) and Alan Mulally are streamlining and globalizing
Ford Motor Company to build exciting products faster.
2
5. A Message from
the President and
Chief Executive Officer
W hen I joined Ford Motor Company last September I was familiar
with its proud history and status as a worldwide industrial icon.
I also was well aware of the significant challenges it faced.
What I didn’t know about until I arrived and saw firsthand was the
tremendous potential for success that exists here. This is a company filled
with talented and dedicated people. We also have outstanding supplier,
dealer and union partners.
There also is an incredible amount of goodwill that exists toward
Ford Motor Company around the world. People want to see us succeed –
and we will.
At Boeing I had the privilege of leading a turnaround that was successful
in the face of devastating economic conditions. I am confident that the
principles that enabled us to succeed there will be equally effective at Ford.
In a global market, success flows from having one team working on one
plan with one goal in mind. That’s what we are doing at Ford, and I am
excited by the opportunities ahead of us.
(continued on next page)
3
6. One Team Our entire global team has been focused on four
In any successful enterprise, people come first. key priorities: aggressively restructuring our company to
A skilled and motivated team working together can be profitable at a lower volume and changed product
accomplish incredible things. The principles and practices mix, accelerating product development while achieving
we have put in place at Ford to run our business are manufacturing excellence through reduced complexity
unlocking the full potential of the people who work here. and improved quality, obtaining financing to complete
our plans, and working together with teamwork and
Everyone with a stake in the outcome is included in
accountability. Late last year, we completed $23.5 billion
the decision making process. Together, we developed
in new funding to finance our restructuring, bringing our
a single plan for our entire global enterprise, with
total automotive liquidity to $46 billion at year-end 2006.
clear performance goals. Although we work as a team,
individuals are given responsibility and authority, and Our most immediate concern is fixing our business in
held accountable for delivering results. Achievements North America. We are taking the painful but necessary
are measured by steps to achieve a
facts and data, $5 billion reduction
not anecdotes
and opinions.
“Working together as one global in our annual
operating costs by
I meet with
company is our biggest single 2008 compared to
2005. And we are
my own senior opportunity to make rapid and accelerating our new
management team
once a week in a dramatic progress toward our goal.” product development.
By the end of 2008,
half-day session
70 percent of our Ford,
to review progress
Lincoln and Mercury
toward our goals and address any roadblocks. Problems
lineup by volume in North America will be all-new or
and concerns are discussed candidly and the entire team
significantly freshened compared with 2006 models.
is enlisted to help find solutions. Mutual respect and a
We also will speed up the time it takes us to get new
“find-a-way” attitude are key elements of every meeting,
products to market by 30 to 50 percent. In 2009 and
and the focus of discussion is always our plan.
beyond, the pace of new product introductions will
One Plan accelerate even further. Our plan is to return our North
In the past, Ford’s regional operations were run American Automotive operations to profitability by 2009.
as largely autonomous business units. Many of them
Our efforts will be enhanced by leveraging our
were highly successful operating this way, but in today’s
worldwide resources. Working together as one global
intensely competitive global market this system has too
company is our biggest single opportunity to make rapid
many inefficiencies to create sustained success.
and dramatic progress toward our goal.
We are moving quickly to change it.
One Goal
In December I announced an organizational Our goal is simple – to build more of the products
realignment that puts additional focus on our markets that people really want and value. Exciting new products
and customers while better leveraging our global assets that reflect the needs of today’s and tomorrow’s
and capabilities. Under this new structure our three customers, with striking designs that are safer, more
Automotive operations – The Americas; Ford Europe fuel efficient and offer even greater value. That includes
and the Premier Automotive Group; and Ford Asia Pacific an expanded commitment to small cars, more crossovers,
and Africa/Mazda – report directly to me. and more capable and fuel efficient trucks.
In support of these operations we also created a This wave of new products is already underway with
single global product development organization. This new a number of well-received new entries including Ford Edge,
structure will enable us to work together more effectively Lincoln MKX, Ford Expedition and Lincoln Navigator
to improve continuously the quality, productivity and in North America; Ford S-MAX, Ford Galaxy and Ford
speed of our product development process. Transit in Europe; Jaguar XK, Land Rover Freelander 2/LR2,
Volvo S80 and Volvo C30, and Mazda CX-9.
In addition, our purchasing, manufacturing, quality,
information technology, design, research and vehicle Our products also will define us as the company that
technology functions are all similarly focused on using the cares about its customers and their communities. Bill Ford
company’s global assets to better support its Automotive and I share the same vision of building clean, fuel efficient,
operations. By sharing vehicle architectures, components environmentally friendly vehicles that protect their passengers
and best practices from around the world, and taking full and our planet. We want to satisfy our customers’
advantage of global economies of scale, we will leverage immediate needs and longer term aspirations. We believe
our resources around the world for the greater good of that a company that acts responsibly and is concerned for
the entire company. the greater good not only will be respected and admired,
it will be rewarded with growth and sustained profitability.
4
7. What To Expect From Us Company already has a proud history from which to
Ford Motor Company’s results in 2006 were gain perspective and inspiration, and many hopeful
unacceptable. We had a full-year net loss of $12.6 billion, developments to build on.
or $6.72 a share.
Ford F-Series was the best-selling truck in America
As expected, we incurred a substantial loss in North for the 30th year in a row in 2006, and car sales were up
America in 2006, due to restructuring costs, lower volume for the second year in a row thanks to strong entries such
and a less profitable mix of products. South America and as Ford Fusion, Mercury Milan and Lincoln MKZ. Ford
Ford Europe both reported improvements in profits. Our Europe saw a sales increase of five percent in 2006, and
Premier Automotive Group reported a loss for the year, Ford Focus remains one of the best-selling cars in Europe.
but was profitable in the fourth quarter. Asia Pacific and Ford Motor Company affiliated brands had record sales
Africa reported a loss, while Mazda continued to perform in China and India in 2006.
well. Financial Services, primarily Ford Motor Credit
We are going to build on these successes and
Company, earned a pre-tax profit of about $2 billion.
add to them. While challenges lie ahead of us, we are
We are moving quickly and making real progress, making continuous improvements to our plan so we
but it will take time before our efforts are seen in the can capitalize on opportunities to create and sell more
bottom line. As we make this journey together, all of products and save more costs. Our priorities, combined
our stakeholders can expect from us what I expect from with our sense of urgency, will continue to transform
my team – respect, clearly stated goals and candid Ford Motor Company.
assessments of our progress based on facts. We are
In time, the results of our efforts will be more readily
going to build a successful and sustainable business
apparent, and I look forward to sharing our success
that serves the needs of all its stakeholders and adds
with you.
value for its shareholders.
From my experience at Boeing I know it is difficult
to see the momentum growing in the early stages of a
corporate turnaround. But when you start with a solid Alan R. Mulally
foundation of teamwork and an unwavering focus on President and Chief Executive Officer
customers, the results can be dramatic. Ford Motor March 7, 2007
Ford’s senior management
team has established
weekly meetings to
accelerate change.
Front Row (L to R)
Mike Bannister,
Mark Fields,
Alan Mulally,
Lewis Booth,
John Parker
Second Row
(L to R)
Bennie Fowler,
Charlie Holleran,
Joe Laymon,
Don Leclair
Third Row
(L to R)
Nick Smither,
Derrick Kuzak,
Ziad Ojakli,
Richard Parry-Jones,
Tony Brown,
David Leitch
5
8. Lincoln MKX Mercury Mariner Mazda CX-7
Great Products From Strong Brands
F ord Motor Company is accelerating the pace of its new product
introductions around the world. We are streamlining and
globalizing our product development process to build more
of the vehicles that people really want, faster and with higher quality.
That includes vehicles with more striking designs, better fuel efficiency
and safety, and even greater value.
Our focus is on meeting the real needs of our customers for today
and tomorrow, and our plans include an expanded commitment to
small cars, more crossovers, and more capable and fuel efficient trucks.
We are leveraging global resources to polish the Ford Blue Oval worldwide,
putting in place an exciting vision for our Lincoln and Mercury brands,
building on the success of Mazda around the world and growing our
premier automotive brands – Volvo, Jaguar and Land Rover.
By the end of 2008, we will speed up the time it takes us to get
new products to market by 30 to 50 percent. In the critically important
North American market, 70 percent of our Ford, Lincoln and Mercury
lineup by volume will be all-new or significantly freshened by then.
In 2009 and beyond, the product onslaught accelerates even further.
By working together as a single global team and focusing relentlessly
on the needs of our customers, we will build a successful enterprise that
serves the needs of all of its stakeholders and adds value for its shareholders.
6
9. Jaguar XK Volvo C70 Land Rover LR2
The all-new Ford S-MAX was named ‘Car of the Year 2007’ by a jury of
58 leading automotive journalists from 22 European countries.
7
10. Board of Directors and Executives*
Board of Directors Executive Officers Group Other Vice Presidents
John R.H. Bond William Clay Ford, Jr. Thomas K. Brown Paul A. Mascarenas
(4) Executive Chairman and Senior Vice President, North America Engineering
Stephen G. Butler Chairman of the Board Global Purchasing Martin J. Mulloy
(1,5) Alan Mulally Darryl B. Hazel Labor Affairs
Kimberly A. Casiano President and Chief Executive Officer Senior Vice President and President, Stephen T. Odell
(1,3,5) Lewis W. K. Booth Customer Service Division Marketing, Sales and Service,
Edsel B. Ford II Executive Vice President, Ford of Fredrik Arp Ford of Europe
(3,4) Europe and Premier Automotive President and Chief Executive Officer, Ann Marie Petach
Group, and Chairman, Jaguar, Land Volvo Cars Treasurer
William Clay Ford, Jr.
Rover, Volvo and Ford of Europe Joseph Bakaj
(3,4) Geoff P. Polites
Mark Fields Product Development, Chief Executive Officer,
Irvine O. Hockaday, Jr.
Executive Vice President and President, Ford of Europe Jaguar and Land Rover
(1,5)
The Americas Stephen E. Biegun
Richard A. Manoogian Barb J. Samardzich
Donat R. Leclair, Jr. International Governmental Affairs Powertrain Operations
(2,5)
Executive Vice President and Mei Wei Cheng
Ellen R. Marram Gerhard Schmidt
Chief Financial Officer President, Ford Motor (China) Ltd.
(2,3,5) Research and Advanced Engineering
Mark A. Schulz** Susan M. Cischke
Alan Mulally Robert L. Shanks
Executive Vice President Environmental and Safety Engineering
(4) Controller, The Americas
Michael E. Bannister Felicia J. Fields
Dr. Homer A. Neal Nicholas J. Smither
Group Vice President, Human Resources
(3,4,5) Chief Information Officer
Chairman and Chief Executive Officer,
Bennie W. Fowler James P. Tetreault
Jorma Ollila Ford Motor Credit Company
Corporate Quality and Advanced Manufacturing, Ford of Europe
(1,5) Francisco N. Codina Manufacturing Engineering
John L. Thornton Group Vice President, North America Alex P. Ver
Louise K. Goeser Chief Executive Officer
(2,4,5) Marketing, Sales and Service
President and Chief Executive Officer, and Chief Operating Officer,
John Fleming Ford of Mexico
Committee Memberships Automotive Components Holdings, LLC
Group Vice President, President and
(1) Audit James C. Gouin
Chief Executive Officer, Ford of Europe
(2) Compensation Finance
Derrick M. Kuzak
(3) Environmental and Public Policy Robert J. Graziano
Group Vice President,
(4) Finance Executive Vice President,
Global Product Development
(5) Nominating and Governance Mazda Motor Corporation
Joe W. Laymon
Joseph R. Hinrichs
Group Vice President, Corporate
Manufacturing
Human Resources and Labor Affairs
Charles B. Holleran
J Mays
Chief Communications Officer
Group Vice President, Design and
Chief Creative Officer
Ziad S. Ojakli
* As of March 7, 2007
Group Vice President,
** Mr. Schulz has announced his
Corporate Affairs
intention to retire.
John G. Parker
Group Vice President,
Asia Pacific and Africa/Mazda
Richard Parry-Jones
Group Vice President,
Chief Technical Officer
Peter J. Daniel
Senior Vice President and Controller
David G. Leitch
Senior Vice President and
General Counsel
The 2008 Ford F-Series
Super Duty has a bold new
look and a host of innovative
features. The industry’s
leading line of heavy-duty
trucks has added a new
workhorse for 2008:
the new F-450 pickup.
8
11. Management’s Discussion and Analysis of Financial Condition and Results of Operations
Financial Contents*
10 Management’s Discussion and Analysis of Financial
Condition and Results of Operations
43 Quantitative and Qualitative Disclosures About Market Risk
48 Consolidated Statement of Income
49 Sector Statement of Income
50 Consolidated Balance Sheet
51 Sector Balance Sheet
52 Consolidated Statement of Cash Flows
53 Sector Statement of Cash Flows
54 Consolidated Statement of Stockholders’ Equity
55 Notes to the Financial Statements
106 Report of Independent Registered Public Accounting Firm
108 Selected Financial Data
109 Employment Data
110 Management’s Report on Internal Control Over Financial
Reporting
110 New York Stock Exchange Required Disclosures
111 Stock Performance Graph
* Financial information contained herein (pages 10-110) is excerpted from the
Ford Motor Company (referred to herein as “Ford”, the “Company”, “we”, “our”
or “us”) Annual Report on Form 10-K for the year ended December 31, 2006,
which is available on our website at www.ford.com.
9
12. Management’s Discussion and Analysis of Financial Condition and Results of Operations
OVERVIEW
Generation of Revenue, Income and Cash
Our Automotive sector's revenue, income and cash are generated primarily from sales of vehicles to our dealers and
distributors (i.e., our customers). Vehicles we produce generally are subject to firm orders from our customers and are
deemed sold (with the proceeds from such sale recognized in revenue) immediately after they are produced and shipped
to our customers. This is not the case, however, with respect to vehicles produced for sale to daily rental car companies
that are subject to a guaranteed repurchase option or vehicles produced for use in our own fleet (including management
evaluation vehicles). Vehicles sold to daily rental car companies that are subject to a guaranteed repurchase option are
accounted for as operating leases, with lease revenue and profits recognized over the term of the lease. When we sell
the vehicle at auction, we recognize a gain or loss on the difference, if any, between actual auction value and the
projected auction value. In addition, revenue for finished vehicles we sell to customers or vehicle modifiers on
consignment is not recognized until the vehicle is sold to the ultimate customer. Therefore, except for the impact of the
daily rental units sold subject to a guaranteed repurchase option, those units placed into our own fleet, and those units for
which recognition of revenue is otherwise deferred, wholesale volumes to our customers and revenue from such sales are
closely linked with our production.
Most of the vehicles sold by us to our dealers and distributors are financed at wholesale by Ford Motor Credit
Company (quot;Ford Creditquot;). Upon Ford Credit originating the wholesale receivable related to a dealer's purchase of a
vehicle, Ford Credit pays cash to the relevant legal entity in our Automotive sector in payment of the dealer's obligation for
the purchase price of the vehicle. The dealer then pays the wholesale finance receivable when it sells the vehicle to a
retail customer.
Our Financial Services sector's revenue is generated primarily from interest on finance receivables, net of certain
deferred origination costs that are included as a reduction of financing revenue, and such revenue is recognized over the
term of the receivable using the interest method. Also, revenue from operating leases, net of certain deferred origination
costs, is recognized on a straight-line basis over the term of the lease. Income is generated to the extent revenues
exceed expenses, most of which are interest, depreciation and operating expenses.
Transactions between our Automotive and Financial Services sectors occur in the ordinary course of business. For
example, Ford Credit receives interest supplements and other support cost payments from the Automotive sector in
connection with special vehicle financing and leasing programs that it sponsors. Ford Credit records these payments as
revenue, and our Automotive sector makes the related cash payments, over the expected life of the related finance
receivable or operating lease. See Note 1 of the Notes to the Financial Statements for a more detailed discussion of
transactions and payments between our Automotive and Financial Services sectors. The Automotive sector records the
estimated costs of marketing incentives, including dealer and retail customer cash payments (e.g., rebates) and costs of
special financing and leasing programs, as a reduction to revenue. These reductions to revenue are accrued at the later
of the date the related vehicle sales to the dealer are recorded or at the date the incentive program is both approved and
communicated.
Key Economic Factors and Trends Affecting the Automotive Industry
Excess Capacity. According to CSM Worldwide, an automotive research firm, in 2006 the estimated automotive
industry global production capacity for light vehicles (about 79 million units) significantly exceeded global production of
cars and trucks (about 65 million units). In North America and Europe, the two regions where the majority of revenue and
profits are earned in the industry, excess capacity was an estimated 16% and 14%, respectively. According to production
capacity data projected by CSM Worldwide, global excess capacity conditions could continue for several more years, with
planned capacity reductions announced by us and General Motors Corporation offset by increases in capacity additions in
Asia Pacific markets.
10
13. Management’s Discussion and Analysis of Financial Condition and Results of Operations
Pricing Pressure. Excess capacity, coupled with a proliferation of new products being introduced in key segments by
the industry, will keep pressure on manufacturers' ability to increase prices on their products. In addition, the incremental
new U.S. manufacturing capacity of Japanese and Korean manufacturers in recent years has contributed, and is likely to
continue to contribute, to the severe pricing pressure in that market. For example, in 2006, Toyota completed construction
of an assembly plant in Texas that reportedly will be capable of producing at least 200,000 full-size pick-up trucks per year.
The reduction of real prices for similarly contented vehicles in the United States has become more pronounced since the
late 1990s, and we expect that a challenging pricing environment will continue for some time to come. In addition, the
Japanese yen remains weak against the U.S. dollar and at historic lows against the euro, contributing substantially to
Japanese vehicle manufacturers' significant cost advantage, especially on exports from Japan to these markets. In
Europe, the automotive industry also has experienced intense pricing pressure for several years, exacerbated in recent
years by the Block Exemption Regulation.
Consumer Spending Trends. We expect, however, that a decline in or the inability to increase vehicle prices could be
offset by the spending habits of consumers and their propensity to purchase over time higher-end, more expensive
vehicles and/or vehicles with more features. Over the next decade, in the United States and other mature markets, we
expect that growth in spending on vehicle mix and content will change generally in line with GDP or above. The benefits
of this to revenue growth in the automotive industry are significant. In the United States, for example, consumers in the
highest income brackets are buying more often and are more frequently buying upscale.
Although growth in wholesales (i.e., volume) will be greatest in emerging markets in the next decade, we expect that
the mature automotive markets (e.g., North America, Western Europe, and Japan) will continue to be the source of a
majority of global industry revenues. We also expect that the North American market will continue as the single largest
source of revenue for the automotive industry in the world.
Health Care Expenses. In 2006, our health care expenses for U.S. employees, retirees, and their dependents were
$3.1 billion, with about $1.8 billion for postretirement health care and the balance for active employee health care and
other retiree expense.
Although we have taken measures to have employees and retirees bear a higher portion of the costs of their health
care benefits, we expect our health care costs to continue to increase. For 2007, our trend assumptions for U.S. health
care costs include an initial trend rate of six percent, gradually declining to a steady state trend rate of five percent
reached in 2011. These assumptions include the effect of actions we are taking and expect to take to offset health care
inflation, including eligibility management, employee education and wellness programs, competitive sourcing, and
employee cost sharing.
Commodity and Energy Price Increases. Commodity price increases, particularly for steel and resins (which are our
two largest commodity exposures and among the most difficult to hedge), have occurred recently and are continuing
during a period of strong global demand for these materials. In addition, energy prices continued to increase significantly
in 2006. In particular, gasoline prices in the United States increased in volatility and rose to levels over $3.00 per gallon in
2006. Although prices have moderated somewhat, they remain and are expected to remain at high levels. This has had
an adverse effect on the demand for full- and medium-sized sport utility vehicles and trucks in the United States.
Currency Exchange Rate Volatility. The U.S. dollar has depreciated against most major currencies since 2002. This
created downward margin pressure on auto manufacturers that have U.S. dollar revenue with foreign currency cost.
Because we produce vehicles in Europe (e.g., Jaguar, Land Rover, Aston Martin and Volvo models) for sale in the United
States and produce components in Europe (e.g., engines) for use in some of our North American vehicles, we
experienced margin pressure. Although this pressure was offset partially by gains on foreign exchange derivatives, this
offset declines over time due to the expiration of favorable hedges previously put in place. We, like many other
automotive manufacturers with sales in the United States, are not always able to price for depreciation of the U.S. dollar
due to the extremely competitive pricing environment in the United States.
11
14. Management’s Discussion and Analysis of Financial Condition and Results of Operations
Other Economic Factors. Additional factors have recently affected the performance of the automotive industry. In the
United States, 2006 was a period of a significant contraction in the housing market. As a result, residential construction of
new homes declined by 4.2% (after inflation). This adjustment had two effects on automotive sales and revenue –
directly, through its adverse effect on GDP growth, and as a contributing factor to potential softer demand for truck sales.
Both of these factors may continue to contribute to lower light vehicle sales in the United States.
CO2 Emissions Standards for Medium and Heavy Trucks. New, more stringent U.S. regulatory requirements for truck
emissions took effect on January 1, 2007, which increased the cost of engines used in medium and heavy trucks. These
standards did not apply to vehicles purchased prior to the implementation of the new regulations. As a result, sales of
medium and heavy trucks were elevated in 2006 as buyers pulled ahead orders that they would otherwise have made at a
later date. This may result in a deterioration of the sales pace for medium and heavy trucks in 2007.
Trends and Strategies
The global automotive marketplace has become increasingly fragmented and crowded, and we anticipate that this
trend will continue to accelerate into the future. Anticipating little growth in the overall volume of vehicles sold in North
America for the foreseeable future, we expect more manufacturers to offer an increasing number of products in this
market. To address this market reality and the factors and trends affecting the automotive industry discussed above, we
have been focusing on the following four key priorities:
Restructuring the Company to be profitable at lower volumes and with a changed vehicle mix;
Accelerating product development and reducing manufacturing complexity;
Obtaining and maintaining adequate liquidity to fund the first two priorities; and
Working together through teamwork and accountability.
Restructuring the Company
To compete more effectively in today's global marketplace, and particularly in North America, we have embarked on a
plan to restructure aggressively our Automotive business to address the realities of lower demand, higher fuel prices and
the shifting model mix from trucks and large SUVs to more fuel-efficient vehicles.
On January 23, 2006, we announced a major business improvement plan for our North American Automotive
operations, which we referred to as the Way Forward plan. On September 15, 2006, responding to changing facts and
circumstances, we announced an acceleration of this plan, including actions designed to further reduce operating costs
and increase the flow of new products.
Personnel reductions
Acceleration of the Way Forward plan includes additional reductions of our capacity and workforce to contribute to our
goal of reducing annual North America operating costs by about $5 billion by the end of 2008 as compared with 2005.
Our accelerated plan reduces salaried-related costs through the elimination of the equivalent of about 14,000 salaried-
related positions, which represents about one-third of our North American salaried workforce. This reduction includes our
elimination of the equivalent of nearly 5,000 salaried positions by the end of 2006; the additional reductions are being
achieved through early retirements, voluntary separations and, as necessary, involuntary separations, with most
employee departures expected to be completed by the end of the first quarter of 2007.
By agreement with the International Union, United Automobile, Aerospace and Agricultural Implement Workers of
America (quot;UAWquot;), we also extended early retirement or separation packages to all U.S. hourly employees, including Ford
employees at our Automotive Components Holdings, LLC (quot;ACHquot;) plants. Through year-end 2006, about 37,000 hourly
employees represented by the UAW had accepted (and not rescinded) an early retirement or separation offer. The vast
majority of these employees are expected to separate from the Company by September 2007, though many of the offers
include an opportunity for the employee to rescind acceptance until the time of separation. The accelerated plan to sell or
close all ACH facilities by the end of 2008 will result in additional personnel reductions.
12
15. Management’s Discussion and Analysis of Financial Condition and Results of Operations
Overall, including ACH hourly employees, at December 31, 2006 we had about 89,000 hourly employees in North
America (including Canada and Mexico), which is down from about 99,500 employees at year-end 2005. By the end of
2008, our plan is to operate with between 55,000 to 60,000 hourly employees in North America.
Capacity alignment
We also intend to reduce and realign our vehicle assembly capacity to bring it more in line with demand and shifting
customer preferences. There are several ways to measure our vehicle assembly capacity, two of which are installed
capacity and manned capacity. Installed capacity refers to the physical capability of the plant and equipment to assemble
vehicles if fully manned. Manned capacity refers to the degree to which the installed capacity has been staffed. In
addition, in North America there generally exists the capability to work overtime or schedule downtime to adjust the
manned capacity in the short term to match sales.
In the longer term, a useful measure of capacity is maximum installed capacity. This reflects the full physical capacity
of the plant and equipment, including maximum overtime. In the shorter term, a useful measure is straight-time manned
capacity. This reflects the extent to which labor is being utilized to make the installed capacity capable of actually
assembling vehicles.
Since year-end 2005, we have reduced our North American maximum installed capacity (with all plants operating on
two shifts) and straight-time manned capacity from 4.8 million units and 3.6 million units, respectively, to 4.1 million units
and 3.4 million units, respectively. As indicated in the table below, our plan is to further reduce our North American
assembly capacity on both bases by the end of 2008. Our projected North American vehicle production divided by our
planned maximum installed assembly capacity of 3.6 million units results in a capacity utilization rate of 84% in 2008. Our
North American straight-time manned capacity utilization in 2008 is projected to be 100% as a result of plant idlings as
well as shift eliminations and line speed reductions. Reducing our manned capacity in this manner allows us to achieve
major cost savings and coordinates plant idlings with planned product changes, which we believe is the best economic
approach.
__________
* Based on a two-shift operating pattern
We plan to reduce our maximum installed assembly capacity in North America by the end of the decade so that it closely
matches projected sales of Ford, Lincoln and Mercury brand units.
As part of this reduction, we have announced plans to idle 16 North American manufacturing facilities, including seven
vehicle assembly plants, by the end of 2012. Of these, the following nine facilities have been or are planned to be idled
by the end of 2008:
Atlanta Assembly Plant (idled in 2006);
Batavia Transmission Plant (to be idled in 2008);
Essex Engine Plant (to be idled in 2007);
Maumee Stamping Plant (to be idled in 2008);
Norfolk Assembly Plant (to be idled in 2007);
St. Louis Assembly Plant (idled in 2006);
Twin Cities Assembly Plant (to be idled in 2008);
Windsor Casting Plant (to be idled in 2007); and
Wixom Assembly Plant (to be idled in 2007).
13
16. Management’s Discussion and Analysis of Financial Condition and Results of Operations
Also, in 2007, we have eliminated or plan to eliminate a shift at each of the Norfolk, Twin Cities, St. Thomas (Ontario)
and Michigan Truck assembly plants, and plan to add a third crew at the Dearborn Truck Assembly Plant to accommodate
additional F-150 truck production.
Additionally, we plan to sell or close all of the 13 remaining ACH plants by the end of 2008. Of these, we have entered
into nonbinding memoranda of understanding for the sale of three ACH plants.
Accelerating Product Development and Reducing Manufacturing Complexity
As part of our acceleration of the Way Forward plan, 70 percent of Ford, Lincoln, and Mercury products (by volume) in
North America will be new or significantly upgraded by the end of 2008 compared with 2006 models; these efforts will
include the expansion of our product lineup in growth segments such as crossover vehicles. We have most recently
introduced or will introduce in the next few months the following new models:
Ford North America: the all-new Ford Edge and Lincoln MKX crossover models, substantially new versions
of the Ford Expedition and Lincoln Navigator models, new models of our segment-leading Ford Super Duty
trucks, and new versions of the Lincoln MKZ sedan and Ford Escape and Mercury Mariner compact sport
utility vehicles and hybrids;
Ford Europe: the award-winning Ford S-MAX crossover vehicle (named quot;Car of the Year 2007quot; in Europe),
Galaxy minivan, and Transit truck (named quot;International Van of the Year 2007quot; in Europe); and
Premier Automotive Group (quot;PAGquot;): Jaguar XKR coupe, Land Rover Freelander 2/LR2 SUVs, Volvo S80
sedan and Volvo C30 coupe.
In addition, we are continuing to invest in new gasoline, flexible-fuel, diesel, hydrogen, and hybrid powertrains, as well as
fuel-saving six-speed transmission technology.
We plan to accelerate the development of new products designed to meet shifting consumer preferences for more
fuel-efficient, smaller vehicles. To facilitate this, we have reorganized our product development activities into a unified
and integrated global organization that reports directly to our Chief Executive Officer, and we are developing a truly global
product plan that takes full advantage of our global product development assets, technologies and people. By leveraging
our scale, we will be able to apply our global product development capital and engineering resources to fewer vehicle
platforms, drivetrains and powertrains. This commonality of platforms, drivetrains and powertrains, in turn, will reduce
complexity in our vehicles and processes. Moreover, as we make our investments in new products, we will continue to
improve our production system's quality, productivity and flexibility.
Ford's I-4 Duratec engine family (1.8L through 2.5L) is an example of how commonality can work. The I-4 Duratec is
being used by Ford Europe (Focus and Mondeo models), Volvo (S40 model), Ford Asia Pacific (Focus and Volvo
S40 models), Ford North America (Focus, Escape/Mariner, Fusion/Milan models), and by Mazda Motor Corporation
(quot;Mazdaquot;) in several of its vehicles. For the Ford-brand models, this is expected to represent production in 2007 of more
than 800,000 I-4 Duratec engines and annual production in the next few years of more than one million engines .
Obtaining and Maintaining Adequate Liquidity
As discussed below under quot;Liquidity and Capital Resources – Automotive Sectorquot; and in Note 15 of the Notes to the
Financial Statements, we obtained $23.5 billion of new liquidity in December 2006, including proceeds from a convertible
debt offering of $4.95 billion, proceeds from a secured term loan of $7 billion and a secured revolving credit facility of
$11.5 billion. This resulted in total automotive liquidity of about $46 billion at year-end 2006, which we believe should
allow us to fund the restructuring and product development priorities discussed above, and provide us with a cushion for a
recession or other unforeseen events in the near term.
14
17. Management’s Discussion and Analysis of Financial Condition and Results of Operations
Working Together through Teamwork and Accountability
Our global management team is focused on a single, company-wide global business plan that establishes clear
performance goals for the entire Company. This requires all functions – product development, purchasing, information
technology, manufacturing, etc, – across the globe to work together and be accountable to meet the performance goals
established by our business plan.
To facilitate this, our senior management team has established weekly meetings to assess our progress against the
business plan goals, to identify risks to meeting and opportunities for exceeding those goals, and to make decisions about
actions to take to mitigate risks or implement opportunities to stay on track to meet or exceed those goals.
Financial Impact and Assumptions
Execution of the four priorities discussed above is expected to result in our Ford North America segment, and our
Automotive sector overall, being profitable in 2009. This projection is based on the following operating assumptions in the
2008 and 2009 time period:
Sales volume and mix of products stabilizing in North America, with U.S. market share in the 14% to
15% range for Ford, Lincoln and Mercury brands, and lower fleet sales as a percentage of total sales. This in
part reflects cessation in 2006 of production of the Ford Taurus sedan in Atlanta and Ford Freestar and
Mercury Monterey minivans in Oakville, Ontario. In addition, we expect growth in sales volumes outside the
United States.
Cumulative reduction in annual operating costs for our Ford North America segment of about $5 billion by the
end of 2008 compared with 2005, largely reflecting the personnel and capacity reductions discussed above,
and continuing cost improvements in 2009.
For a discussion of our liquidity needs and uses during this period, see quot;Liquidity and Capital Resources – Automotive
Sectorquot; below. For a discussion of the outlook for our 2007 full-year performance, see quot;Outlookquot; below.
15
18. Management’s Discussion and Analysis of Financial Condition and Results of Operations
RESULTS OF OPERATIONS
FULL-YEAR 2006 RESULTS OF OPERATIONS
Our worldwide net income was a loss of $12.6 billion or $6.72 per share of Common and Class B Stock in 2006, down
$14 billion from a profit of $1.4 billion or $0.77 per share in 2005.
Results by business sector for 2006, 2005, and 2004 are shown below (in millions):
__________
(a) See Note 18 of the Notes to the Financial Statements for disclosure regarding 2006 effective tax rate.
(b) Primarily related to Ford Europe's consolidated 41%-owned affiliate, Ford Otosan; the decrease in 2006 primarily reflected the impact on deferred
tax balances of tax law changes in Turkey. The pre-tax results for Ford Otosan were $509 million in 2006, $503 million in 2005, and $452 million in
2004.
(c) See Note 27 of the Notes to the Financial Statements.
Included in Income/(loss) before income taxes are items we do not consider indicative of our ongoing operating activities
(quot;special itemsquot;). The following table details 2006, 2005, and 2004 special items by segment or business unit (in millions):
__________
(a) See Note 17 of the Notes to the Financial Statements for definition and discussion of Jobs Bank Benefits.
(b) See Notes 19 and 23 of the Notes to the Financial Statements for discussion of Visteon-related charges.
16
19. Management’s Discussion and Analysis of Financial Condition and Results of Operations
AUTOMOTIVE SECTOR RESULTS OF OPERATIONS
Our discussion of Automotive sector results of operations is on a pre-tax basis.
2006 Compared with 2005
Details by Automotive segment or business unit of Income/(loss) before income taxes are shown below (in millions):
Details of Automotive sector sales and wholesale unit volumes by Automotive segment or business unit for 2006 and
2005 are shown below:
__________
(a) Wholesale unit volumes generally are reported on a where-sold basis, and include all Ford-badged units and units manufactured by Ford that are
sold to other manufacturers, as well as units distributed for other manufacturers. Vehicles sold to daily rental car companies that are subject to a
guaranteed repurchase option, as well as other sales of finished vehicles for which the recognition of revenue is deferred (e.g., consignments),
are included in wholesale unit volumes. For a discussion of our revenue recognition policy for these sales, see Note 2 of the Notes to the
Financial Statements.
(b) Included in wholesale unit volumes of Ford Asia Pacific and Africa are Ford-badged vehicles sold in China and Malaysia by certain
unconsolidated affiliates totaling about 159,000 and 87,000 units in 2006 and 2005, respectively. quot;Salesquot; above does not include revenue from
these units.
(c) Reflects sales of Mazda6 by our consolidated subsidiary, AutoAlliance International, Inc. (quot;AAIquot;), beginning with the consolidation of AAI in the
third quarter of 2005. See Note 13 of the Notes to the Financial Statements.
17
20. Management’s Discussion and Analysis of Financial Condition and Results of Operations
Details of Automotive sector market share for selected markets for 2006 and 2005, along with the level of dealer stocks
as of December 31, 2006 and 2005, are shown below:
__________
(a) Dealer-owned stocks represent our estimate of vehicles shipped to our customers (dealers) and not yet sold by the dealers to their retail
customers, as well as some vehicles reflected in our inventory.
(b) Includes only Ford and, in certain markets (primarily U.S.), Lincoln and Mercury brands.
(c) South America market share is based on vehicle retail sales for our six major markets (Argentina, Brazil, Chile, Colombia, Ecuador, and
Venezuela).
(d) European 2006 market share is based, in part, on estimated vehicle registrations for our 19 major European markets (Britain, Germany,
France, Italy, Spain, Austria, Belgium, Ireland, Netherlands, Portugal, Switzerland, Finland, Sweden, Denmark, Norway, Czech Republic,
Greece, Hungary, and Poland).
(e) Asia Pacific and Africa 2006 market share is based on estimated vehicle retail sales for our 12 major markets (Australia, China, Japan, India,
Indonesia, Malaysia, New Zealand, Philippines, South Africa, Taiwan, Thailand, and Vietnam).
(f) Dealer-owned stocks for Asia Pacific and Africa include primarily Ford-brand vehicles as well as a small number of units distributed for other
manufacturers.
Overall Automotive Sector
The decline in earnings reflected the effect of Jobs Bank Benefits charges and higher personnel-reduction program
charges for our Ford North America segment, unfavorable volume and mix (mainly lower market share, adverse product
mix in Ford North America, and lower dealer stock levels), pension curtailment charges, impairment charges related to our
long-lived assets in Ford North America and Jaguar and Land Rover operations, and unfavorable net pricing. These
adverse factors were offset partially by favorable cost changes. Our efforts to restructure the Ford North America
business resulted in the Jobs Bank Benefits and personnel-reduction program charges, and the related pension
curtailment charges.
The decline in revenue primarily reflected lower wholesale unit volumes in Ford North America, adverse product mix,
and unfavorable net pricing.
The table below details our 2006 cost changes at constant volume, mix, and exchange, excluding special items and
discontinued operations (in billions):
18
21. Management’s Discussion and Analysis of Financial Condition and Results of Operations
The Americas
Ford North America Segment. The decline in earnings primarily reflected the effect of Jobs Bank Benefits charges and
higher personnel-reduction program charges, unfavorable volume and mix (mainly adverse product mix, lower market
share, a reduction in stock levels, and lower industry volumes), pension curtailment charges, unfavorable net pricing, and
impairment charges related to our long-lived assets, offset partially by favorable cost changes. The favorable cost
changes reflected improvements in pension and OPEB costs, manufacturing and engineering costs, warranty-related
costs, and overhead costs.
Ford South America Segment. The increase in earnings primarily reflected favorable net pricing, favorable volume and
mix more than accounted for by higher industry volume, and a legal settlement relating to social welfare tax liability, offset
partially by unfavorable cost changes. The unfavorable cost changes primarily reflected higher net product costs, and
manufacturing and engineering costs.
Ford Europe and PAG
Ford Europe Segment. The improvement in results primarily reflected reduced charges for personnel-reduction
programs, favorable volume and mix, and favorable cost changes, offset partially by unfavorable changes in currency
exchange rates. The favorable cost changes primarily reflected lower overhead costs, warranty-related costs, net product
costs, and manufacturing and engineering costs, offset partially by higher pension costs.
PAG Segment. The decline in earnings primarily reflected unfavorable warranty-related costs mainly associated with
adjustments to warranty accruals for prior model-year vehicles (mainly at Jaguar and Land Rover), unfavorable currency
exchange (mainly related to the expiration of favorable hedges), and higher impairment charges for long-lived assets of
the Jaguar and Land Rover operations. These adverse factors were offset partially by favorable manufacturing and
engineering costs, favorable volume and mix (mainly improved product and market mix, offset partially by lower market
share primarily at Volvo and Jaguar and lower levels of dealer stocks) and lower net product costs.
Ford Asia Pacific and Africa/Mazda
Ford Asia Pacific and Africa/Mazda Segment. The decline in results for Ford Asia Pacific and Africa primarily reflected
unfavorable volume and mix (mainly adverse product mix including lower large car sales in Australia, and lower market
share) and unfavorable changes in currency exchange rates. Wholesale unit volumes for the year increased, while
revenue for the same period decreased. The increase in wholesale unit volumes is explained by higher unit sales in
China and India, offset partially by declines in other markets (primarily Australia and Taiwan). Our revenue excludes
wholesale unit volumes at our unconsolidated affiliates, primarily those in China. The decrease in revenue primarily
reflects changes in currency exchange rates and a higher mix of small cars relative to the same period last year.
The decrease in earnings for Mazda and Associated Operations primarily reflected the non-recurrence of gains on our
investment in Mazda convertible bonds, and charges for personnel-reduction programs at AAI, offset partially by our share
of a gain Mazda realized on the transfer of its pension liabilities back to the Japanese government. During the second
half of 2005 and the first quarter of 2006, we converted to equity all of our Mazda convertible bonds, and, therefore, will no
longer have income effects from mark-to-market adjustments for these bonds.
Other Automotive
The improvement in results primarily reflected higher returns on invested cash, and a higher average cash portfolio,
offset partially by the non-recurrence of a gain on the sale of our remaining interest in Kwik-Fit Group Limited.
19
22. Management’s Discussion and Analysis of Financial Condition and Results of Operations
2005 Compared with 2004
Details by Automotive segment or business unit of Income/(loss) before income taxes are shown below (in millions):
Details of Automotive sector sales and wholesale unit volumes by Automotive segment or business unit for 2005 and
2004 are shown below:
__________
(a) Wholesale unit volumes generally are reported on a where-sold basis, and include all Ford-badged units and units manufactured by Ford that are
sold to other manufacturers, as well as units distributed for other manufacturers. Vehicles sold to daily rental car companies that are subject to a
guaranteed repurchase option, as well as other sales of finished vehicles for which the recognition of revenue is deferred (e.g., consignments),
are included in wholesale unit volumes. For a discussion of our revenue recognition policy for such sales, see Note 2 of the Notes to the
Financial Statements.
(b) Included in wholesales of Ford Asia Pacific and Africa are Ford-badged vehicles sold in China and Malaysia by certain unconsolidated affiliates
totaling about 87,000 and 66,000 units in 2005 and 2004, respectively. quot;Salesquot; above does not include revenue from these units.
(c) Reflects sales of Mazda6 by our consolidated subsidiary, AAI, beginning with the consolidation of AAI in the third quarter of 2005. See Note 13
of the Notes to the Financial Statements.
20
23. Management’s Discussion and Analysis of Financial Condition and Results of Operations
Details of Automotive sector market share for selected markets for 2005 and 2004, along with the level of dealer
stocks as of December 31, 2005 and 2004, are shown below:
__________
(a) Dealer-owned stocks represent our estimate of vehicles shipped to our customers (dealers) and not yet sold by the dealers to their retail
customers, as well as some vehicles reflected in our inventory.
(b) Includes only Ford and, in certain markets (primarily U.S.), Lincoln and Mercury brands.
(c) South America market share is based on vehicle retail sales for our six major markets (Argentina, Brazil, Chile, Colombia, Ecuador, and
Venezuela).
(d) European market share is based, in part, on vehicle registrations for our 19 major European markets (Britain, Germany, France, Italy, Spain,
Austria, Belgium, Ireland, Netherlands, Portugal, Switzerland, Finland, Sweden, Denmark, Norway, Czech Republic, Greece, Hungary, and
Poland).
(e) Asia Pacific and Africa market share is based on vehicle retail sales for our 12 major markets (Australia, China, Japan, India, Indonesia,
Malaysia, New Zealand, Philippines, South Africa, Taiwan, Thailand, and Vietnam).
(f) Dealer-owned stocks for Asia Pacific and Africa include primarily Ford-brand vehicles as well as a small number of units distributed for other
manufacturers.
Overall Automotive Sector
The decline in earnings reflected losses at our Ford North America segment, an impairment charge for long-lived
assets of Jaguar and Land Rover operations, and higher charges for personnel reduction programs, offset partially by
favorable market performance at Land Rover and increased earnings at our Ford South America segment, Other
Automotive, and Ford Asia Pacific and Africa/Mazda segment.
The improvement in revenues primarily reflected favorable product mix and favorable changes in currency exchange
rates.
The Americas
Ford North America Segment. The decline in results primarily reflected lower U.S. market share, unfavorable cost
changes, lower dealer stock levels, charges for personnel-reduction programs, and unfavorable currency exchange.
Unfavorable cost changes primarily reflected higher warranty-related costs and net product costs.
Ford South America Segment. The increase in earnings primarily reflected favorable net pricing, higher industry
volumes, and favorable currency exchange, offset partially by unfavorable cost changes. The unfavorable cost changes
primarily reflected higher net product costs and overhead costs.
Ford Europe and PAG
Ford Europe Segment. The decline in results primarily reflected higher charges for personnel-reduction programs,
unfavorable net pricing, and adverse product and market mix, offset partially by favorable cost changes and favorable
changes in currency exchange rates. The favorable cost changes primarily reflected lower manufacturing and
engineering costs offset partially by unfavorable warranty-related costs.
PAG Segment. The decline in earnings primarily reflected an impairment charge for long-lived assets of the Jaguar
and Land Rover operations, unfavorable currency exchange, and higher charges for personnel-reduction programs, offset
partially by favorable net pricing, improved product mix primarily reflecting the impact of new Land Rover products, and
favorable cost changes. The favorable cost changes primarily reflected lower warranty-related costs and favorable
manufacturing and engineering costs offset partially by higher net product costs.
21
24. Management’s Discussion and Analysis of Financial Condition and Results of Operations
Ford Asia Pacific and Africa/Mazda
Ford Asia Pacific and Africa/Mazda Segment. The improvement in results for Ford Asia Pacific and Africa primarily
reflected the non-recurrence of 2004 charges related to the disposition of certain dealerships, favorable changes in
currency exchange rates, and a gain on the disposal of our investment in Mahindra & Mahindra Ltd., offset partially by
unfavorable product mix, higher costs associated with new products and facilities in China, and charges for personnel-
reduction programs.
The increase in earnings for Mazda and Associated Operations primarily reflected gains on our investment in Mazda
convertible bonds and improved Mazda operating results. In the second half of 2005, we converted to equity about 82.5%
of our Mazda convertible bonds.
Other Automotive
The improvement in earnings primarily reflected higher returns on invested cash and a gain on the sale of non-core
businesses, offset partially by lower interest on tax refunds from prior-year federal and state tax matters (about
$450 million in 2005 compared with $600 million in 2004).
FINANCIAL SERVICES SECTOR RESULTS OF OPERATIONS
Our discussion of Financial Services sector results of operations is on a pre-tax basis.
2006 Compared with 2005
Details of the full-year Financial Services sector Revenues and Income/(loss) before income taxes for 2006 and 2005
are shown below:
__________
* The segment presentation of the gain on sale of Hertz in Note 24 of the Notes to the Financial Statements is $1,006 million in the Hertz segment and
$89 million in Other Financial Services.
We sold Hertz during the fourth quarter of 2005, resulting in declines in Revenues and Income/(loss) before income
taxes during 2006.
Ford Credit
The decrease in Ford Credit's full-year earnings primarily reflected higher borrowing costs, higher depreciation
expense, and the impact of lower average receivable levels in its managed portfolio. These were offset partially by
market valuations, primarily related to non-designated derivatives and reduced operating costs.
Ford Credit reviews its business performance from several perspectives, including:
• On-balance sheet basis. Includes the receivables and leases Ford Credit owns and securitized receivables and
leases that remain on Ford Credit's balance sheet (including other structured financings and factoring transactions
that have features similar to securitizations);
22
25. Management’s Discussion and Analysis of Financial Condition and Results of Operations
• Securitized off-balance sheet basis. Includes receivables sold in securitization transactions that are not reflected
on Ford Credit's balance sheet;
• Managed basis. Includes on-balance sheet and securitized off-balance sheet receivables and leases that Ford
Credit continues to service; and
• Serviced basis. Includes managed receivables and leases and receivables sold in whole-loan sale transactions
where Ford Credit retains no interest in the sold receivables, but which it continues to service.
Ford Credit analyzes its financial performance primarily on a managed and on-balance sheet basis. It retains interests
in receivables sold in off-balance sheet securitizations and, with respect to subordinated retained interests, has credit risk.
As a result, it evaluates credit losses, receivables, and leverage on a managed basis as well as on an on-balance sheet
basis. In contrast, Ford Credit does not have the same financial interest in the performance of receivables sold in whole-
loan sale transactions, and, as a result, Ford Credit generally reviews the performance of its serviced portfolio only to
evaluate the effectiveness of its origination and collection activities. To evaluate the performance of these activities, Ford
Credit monitors a number of measures, such as repossession statistics, losses on repossessions and the number of
bankruptcy filings.
Ford Credit's receivable levels are shown in the table below (in billions):
__________
* At December 31, 2006 and 2005, includes finance receivables of $56.5 billion and $44.7 billion, respectively, that have been sold for legal purposes in
securitizations that do not satisfy the requirements for accounting sale treatment. In addition, at December 31, 2006 and 2005, includes net
investment in operating leases of $17.3 billion and $6.5 billion, respectively, that have been sold for legal purposes in securitizations that do not satisfy
the requirements for accounting sale treatment. These underlying securitized assets are available only for payment of the debt or other obligations
issued or arising in the securitization transactions; they are not available to pay Ford Credit's other obligations or the claims of Ford Credit's other
creditors.
Managed receivables decreased from year-end 2005, primarily reflecting lower wholesale receivable levels, offset
partially by increased net investment in operating leases. On-balance sheet receivable levels increased, primarily
reflecting the impact of U.S. public retail transactions in 2006 being reported on-balance sheet. Securitized off-balance
sheet receivables declined for the same reason.
23
26. Management’s Discussion and Analysis of Financial Condition and Results of Operations
The following table shows worldwide credit losses net of recoveries (quot;charge-offsquot;) for Ford Credit for the various
categories of financing during the periods indicated. The loss-to-receivables ratios, which equal charge-offs divided by
the average amount of receivables outstanding for the period, are shown below for Ford Credit's on-balance sheet and
managed portfolios.
__________
* Reacquired receivables reflect the amount of receivables that resulted from the accounting consolidation of Ford Credit's FCAR Owner Trust retail
securitization program (quot;FCARquot;) in the second quarter of 2003.
Charge-offs and loss-to-receivable ratios for Ford Credit's on-balance sheet, securitized off-balance sheet, and
managed portfolios declined from a year ago, primarily reflecting fewer repossessions. These improvements resulted
from a higher quality retail installment and lease portfolio, and enhancements to Ford Credit's collection practices.
Shown below is an analysis of Ford Credit's allowance for credit losses and its allowance for credit losses as a
percentage of end-of-period receivables (net finance receivables and net investment in operating leases) for its on-
balance sheet portfolio for the years ended December 31 (dollar amounts in billions). During 2006, Ford Credit updated
its analysis of contract liquidation data which affected the level of required reserves for credit losses. In addition, Ford
Credit implemented refinements to certain modeling techniques that are used in determining the allowance for credit
losses.
24
27. Management’s Discussion and Analysis of Financial Condition and Results of Operations
The decrease in Ford Credit's allowance for credit losses primarily reflected improved charge-off performance, and
changes in its assumptions and modeling techniques ($81 million) described above that affected the allowance.
Other Financial Services
The improvement in results primarily reflected the non-recurrence of the 2005 write-off of aircraft leases related to the
bankruptcy of Delta Air Lines, and, in 2006, higher property sales.
2005 Compared with 2004
Details of the full-year Financial Services sector Income/(loss) before income taxes for 2005 and 2004 are shown
below:
__________
(a) Includes amortization expense related to intangibles recognized upon consolidation of Hertz.
(b) The segment presentation of the gain on sale of Hertz in Note 24 of the Notes to the Financial Statements is $1,006 million in the Hertz segment and
$89 million in Other Financial Services.
Ford Credit
Ford Credit's income before income taxes was down $787 million, which includes $405 million for reduced market
valuations primarily related to non-designated derivatives. The remaining decrease in earnings primarily reflected higher
borrowing costs and the impact of lower retail receivable levels, offset partially by improved credit loss performance.
Hertz
The increase in Hertz operating results primarily reflected the cessation of depreciation on long-lived assets from the
point Hertz was held for sale (i.e., September 2005) until it was sold, higher car and equipment rental volumes and
improved pricing for equipment rental.
Other Financial Services
The decline in results primarily reflected the non-recurrence of a 2004 property clean-up settlement, and, in 2005,
lower property sales and the write-off of aircraft leases related to the bankruptcy of Delta Air Lines.
25
28. Management’s Discussion and Analysis of Financial Condition and Results of Operations
LIQUIDITY AND CAPITAL RESOURCES
Automotive Sector
Our strategy is to ensure that we have sufficient funding available with a high degree of certainty throughout the
business cycle. The key elements of this strategy include maintaining large gross cash balances, generating cash from
operating-related activities, having a long-dated debt maturity profile, maintaining committed credit facilities, and funding
long-term liabilities over time.
Gross Cash. Automotive gross cash includes cash and cash equivalents, net marketable securities, loaned securities
and certain assets contained in a Voluntary Employee Beneficiary Association trust (quot;VEBAquot;), a trust which may be used
to pre-fund certain types of company-paid benefits for U.S. employees and retirees. We include in Automotive gross cash
those VEBA assets that are invested in shorter-duration fixed income investments and can be used within 18 months to
pay for benefits (quot;short-term VEBA assetsquot;). Gross cash as of December 31, 2006, 2005, and 2004 is detailed below (in
billions):
__________
* The purchase or sale of marketable securities for which the cash settlement was not made by period-end.
In managing our business, we classify changes in Automotive gross cash into two categories: operating-related, and
other (which includes the impact of certain special items, contributions to funded pension plans, the net effect of the
change in our VEBA on gross cash, capital transactions with the Financial Services sector, acquisitions and divestitures,
dividends paid to shareholders, changes in Automotive debt, and other – primarily financing-related). Our key metrics are
operating-related cash flow, which best represents the ability of our Automotive operations to generate cash, and
Automotive gross cash. We believe the cash flow analysis reflected in the table below, which differs from a cash flow
statement presented in accordance with generally accepted accounting principles in the United States (quot;GAAPquot;), is useful
to investors because it includes cash flow elements that we consider to be related to our operating activities (e.g., capital
spending) that are not included in Cash flows from operating activities of continuing operations, the most directly
comparable GAAP financial measure.
26
29. Management’s Discussion and Analysis of Financial Condition and Results of Operations
Changes in Automotive gross cash for the last three years are summarized below (in billions):
__________
(a) In 2006, working capital changes reflected the impact of lower production volumes on accounts payable, the effect on inventory of several new
product launches at year end, and changes in our value-added tax receivables collection process in Europe.
(b) Primarily expense and payment timing differences for items such as pension and OPEB, marketing, and warranty.
(c) Primarily dividends received from Ford Credit, excluding proceeds from Financial Services sector divestitures paid to the Automotive sector.
Beginning in 2007, Ford Credit will suspend its regular dividend payments.
(d) In 2006, primarily proceeds from tax refunds (an inflow of about $300 million), the net issuance of Ford Common Stock under employee savings
plans (an inflow of about $200 million), and dividends to minority shareholders of consolidated subsidiaries (an outflow of about $200 million).
Shown in the table below is a reconciliation between financial statement Cash flows from operating activities of
continuing operations and operating-related cash flows (calculated as shown in the table above), for the last three years
(in billions):
________
* Primarily payables and receivables between the sectors in the normal course of business.
Debt and Net Cash. At December 31, 2006, our Automotive sector had total debt of $30 billion, compared with
$17.9 billion a year ago. The increase in debt primarily reflected $4.95 billion of unsecured convertible debt and $7 billion
of secured bank financing that we completed in December 2006. For more information on the nearly $12 billion of new
financing, see Note 15 of the Notes to the Financial Statements.
At December 31, 2006, our Automotive sector had net cash (defined as gross cash less total debt) of $3.9 billion,
compared with $7.2 billion at the end of 2005.
27
30. Management’s Discussion and Analysis of Financial Condition and Results of Operations
The weighted-average maturity of our total automotive debt is approximately 17 years, and is measured based on the
maturity dates of our debt or the first date of any put option available to the owners of our debt. About $3 billion of debt
matures by December 31, 2011, and about $15 billion matures or has a put option by December 31, 2016. For additional
information on debt, see Note 15 of the Notes to the Financial Statements.
Credit Facilities. At December 31, 2006, we had $13 billion of contractually-committed credit facilities with financial
institutions, including $11.5 billion pursuant to a senior secured credit facility established in December 2006, $1.1 billion of
global Automotive unsecured credit facilities, and $400 million of local credit facilities available to foreign affiliates. At
December 31, 2006, $12.5 billion of these facilities were available for use. For further discussion of our committed credit
facilities, see Note 15 of the Notes to the Financial Statements. This new secured credit facility, together with the
$12 billion of funds raised in December 2006 discussed above, was obtained primarily to fund the cash outflows
discussed below.
During the period 2007 through 2009, we expect cumulative Automotive operating-related cash outflows of about
$10 billion, and cumulative cash expenditures for restructuring actions of about $7 billion. More than half of this $17 billion
cash outflow is expected to occur in 2007. This cash outflow primarily reflects substantial operating losses in our
Automotive sector through 2008, and cash expenditures incurred in connection with personnel separations. It also
reflects our expectation to continue to invest in new products throughout this period at about the same level as we have
during the past few years, or approximately $7 billion annually.
In the period 2007 through 2009, we expect other non-operating related net Automotive cash inflows of about
$2 billion, reflecting the use of about $3 billion in long-term VEBA assets, proceeds from receipt of government tax
refunds and affiliate tax payments, and proceeds from planned divestitures of Automobile Protection Corporation and all
or part of Aston Martin, offset partially by pension contributions and reductions of other Automotive debt.
Pension Plan Contributions. Our policy for funded plans is to contribute annually, at a minimum, amounts required by
applicable laws, regulations, and union agreements. We do from time to time make contributions beyond those legally
required.
In 2006, we made $800 million of cash contributions to our funded pension plans. During 2007, we expect to
contribute from available Automotive cash and cash equivalents $2.2 billion to our worldwide pension plans, including
about $400 million of benefit payments paid directly by us for unfunded plans. Based on current assumptions and
regulations, we do not expect to have a legal requirement to fund our major U.S. pension plans in 2007.
For a further discussion of our pension plans, see Note 23 of the Notes to the Financial Statements.
Financial Services Sector
Ford Credit
Ford Credit's funding strategy is to maintain a high level of liquidity by having a substantial cash balance and
committed funding capacity, allowing it to meet its short-term funding obligations. As a result of lower credit ratings, its
unsecured funding costs have increased over time. While Ford Credit continues to access the unsecured debt market, it
has increased its use of securitization funding as it is presently more cost effective than unsecured funding and allows it
access to a broad investor base. Ford Credit plans to meet a significant portion of its 2007 funding requirements through
securitizations, and will continue to expand and diversify its asset-backed funding by asset class and region. In addition,
Ford Credit has various alternative business arrangements for select products and markets that reduce its funding
requirements while allowing it to support us. Ford Credit will continue to pursue such arrangements in the future. Over
time, Ford Credit may need to reduce further the amount of receivables and operating leases it purchases and originates.
A significant reduction in Ford Credit's managed receivables would reduce its ongoing profits, and could adversely affect
its ability to support the sale of our vehicles.
Debt and Cash. Ford Credit's total debt plus securitized off-balance sheet funding was $150.9 billion at
December 31, 2006, about $900 million higher compared with a year ago. At December 31, 2006, Ford Credit's cash,
cash equivalents and marketable securities (excluding marketable securities related to insurance activities) totaled
$21.8 billion (including $3.7 billion to be used only to support on-balance sheet securitizations), compared with
$17.9 billion at year-end 2005. In the normal course of its funding activities, Ford Credit may generate more proceeds
28
31. Management’s Discussion and Analysis of Financial Condition and Results of Operations
than are necessary for its immediate funding needs. These excess amounts are maintained primarily as highly liquid
investments, which provide liquidity for Ford Credit's short-term funding needs and give Ford Credit flexibility in the use of
its other funding programs.
Funding. Ford Credit requires substantial funding in the normal course of business. Its funding requirements are
driven mainly by the need to: (i) purchase retail installment sale contracts and retail lease contracts to support the sale of
Ford products, which are influenced by Ford-sponsored special financing programs that are available exclusively through
Ford Credit, (ii) provide wholesale financing and capital financing for Ford dealers, and (iii) repay its debt obligations.
Ford Credit's funding sources include primarily securitizations and unsecured debt. Ford Credit issues both short- and
long-term debt that is held by both institutional and retail investors, with long-term debt having an original maturity of more
than 12 months. During 2006, Ford Credit continued to meet a significant portion of its funding requirements through
securitizations because of their lower relative costs given its credit ratings (as described below), the stability of the market
for asset-backed securities, and the diversity of funding sources that they provide. Securitized funding (both on- and off-
balance sheet, net of retained interests) as a percent of total managed receivables was as follows at the end of each of the
last three years: 2006 – 48%, 2005 – 38%, 2004 – 26%.
Ford Credit obtains short-term funding from the sale of floating rate demand notes under its Ford Interest Advantage
program. At December 31, 2006, the principal amount outstanding of such notes was $5.6 billion. In addition, Ford Credit
issues unsecured commercial paper in the United States, Europe and other international markets, with sales mostly to
qualified institutional investors. Ford Credit does not hold reserves specifically to fund the payment of any of its short-term
funding obligations. Instead, Ford Credit maintains multiple sources of liquidity, including cash, cash equivalents, and
marketable securities (excluding marketable securities related to insurance activities), unused committed liquidity programs,
excess securitizable assets, and committed and uncommitted credit facilities, which Ford Credit believes should be
sufficient for its short-term funding obligations.
The following table illustrates Ford Credit's public and private term funding transactions for 2005 and 2006 and its
planned issuances for 2007 (in billions):
__________
* Includes securitizations, term debt, and whole-loan sales; excludes Ford Credit's on-balance sheet asset-backed commercial paper programs and
proceeds from revolving transactions.
The cost of securitizations and unsecured debt funding is based on a margin or spread over a benchmark interest rate.
Spreads are typically measured in basis points. Ford Credit's asset-backed funding and unsecured long-term debt costs
are based on spreads over U.S. Treasury securities of similar maturities, a comparable London Interbank Offered Rate
(quot;LIBORquot;) or other comparable benchmark rates. Ford Credit's unsecured commercial paper and floating rate demand
notes funding costs are based on spreads over LIBOR. Ford Credit's securitized funding spreads (which are based on the
creditworthiness of the underlying securitized asset and enhancements) have not been volatile, while its unsecured long-
term spreads have been volatile over the last three years. During 2006, Ford Credit's spreads on the fixed rate notes
offered in its U.S. public retail securitizations ranged between six and eleven basis points over the relevant benchmark
rates, while its unsecured long-term debt funding spreads as measured by the five-year credit default swap market have
fluctuated between 270 and 585 basis points above LIBOR.
29
32. Management’s Discussion and Analysis of Financial Condition and Results of Operations
Credit Facilities and Committed Liquidity Programs. For additional funding and to maintain liquidity, at
December 31, 2006 Ford Credit and its majority-owned subsidiaries, including FCE Bank plc (quot;FCEquot;), had $3.8 billion of
contractually-committed unsecured credit facilities with financial institutions, of which $2.6 billion were available for use. In
addition, at December 31, 2006, banks provided $18.9 billion of contractually-committed liquidity facilities exclusively to
support Ford Credit's two on-balance sheet asset-backed commercial paper programs. Ford Credit also has entered into
agreements with a number of bank-sponsored asset-backed commercial paper conduits (quot;conduitsquot;) and other financial
institutions pursuant to which such parties are contractually committed, at Ford Credit's option, to purchase from Ford Credit
eligible retail or wholesale assets or to make advances under asset-backed securities backed by wholesale assets for
proceeds of up to approximately $29.1 billion. At December 31, 2006, $9.7 billion of these commitments were in use. In
addition, Ford Credit has a multi-year committed liquidity program for the purchase of up to $6 billion of unrated asset-
backed securities that at its option can be supported with various retail, wholesale, or leased assets. Ford Credit's ability to
obtain funding under this program is subject to having a sufficient amount of assets available to issue the securities. For
further discussion of these facilities and programs, see Note 15 of the Notes to the Financial Statements.
Leverage. Ford Credit uses leverage, or the debt-to-equity ratio, to make various business decisions, including
establishing pricing for retail, wholesale, and lease financing, and assessing our capital structure. Ford Credit calculates
leverage on a financial statement basis and on a managed basis using the following formulas:
__________
* Excluding marketable securities related to insurance activities.
The following table illustrates the calculation of Ford Credit's financial statement leverage (in billions, except for ratios):
The following table illustrates the calculation of Ford Credit's managed leverage (in billions, except for ratios):
__________
(a) Includes securitized funding from discontinued operations in 2004.
(b) Includes retained interest in securitized receivables from discontinued operations in 2004.
(c) Excluding marketable securities related to insurance activities.
30