1. Financial Highlights
(Dollars in millions, except per share amounts) Years ended December 31, 2003 2002 2001
Total net sales and revenues $185,524 $177,324 $169,051
Worldwide wholesale sales (units in thousands) 8,098 8,411 8,073
Income from continuing operations $÷÷2,862 $÷÷1,975 $÷÷1,222
(Loss) from discontinued operations $÷÷÷(219) $÷÷÷(239) $÷÷÷(621)
Gain on sale of discontinued operations $÷÷1,179 – –
Net income $÷÷3,822 $÷÷1,736 $÷÷÷«601
Net profit margin from continuing operations 1.5% 1.1% 0.7%
Diluted earnings per share attributable to $1-2/3 par value common stock
Continuing operations $÷÷÷5.03 $÷÷÷3.51 $÷÷÷2.20
Net income $÷÷÷7.14 $÷÷÷3.35 $÷÷÷1.77
Income adjusted to exclude Hughes Electronics and special items (1)
Income $÷÷3,197 $÷÷3,924 $÷÷2,000
Diluted earnings per share attributable to $1-2/3 par value common stock $÷÷÷5.62 $÷÷÷6.98 $÷÷÷3.60
Book value per share of $1-2/3 par value common stock $÷÷44.96 $÷÷÷9.06 $÷÷24.81
Number of $1-2/3 par value common stock shares outstanding
as of December 31 (in millions) 562 560 558
(1) A reconciliation of adjusted amounts to amounts determined in accordance with accounting principles generally accepted in the United States may be found at
www.gm.com/company/investor information/, Earnings Releases, Financial Highlights.
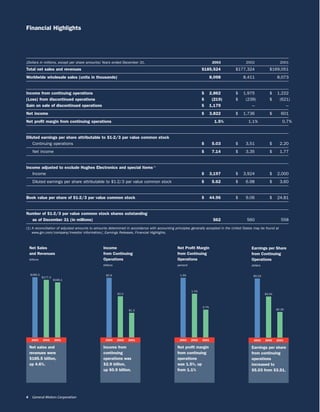
Net Sales Income Net Profit Margin Earnings per Share
and Revenues from Continuing from Continuing from Continuing
billions Operations Operations Operations
billions percent dollars
$185.5 $2.9 1.5% $5.03
$177.3
$169.1
1.1%
$2.0 $3.51
0.7%
$1.2 $2.20
2003 2002 2001 2003 2002 2001 2003 2002 2001 2003 2002 2001
Net sales and Income from Net profit margin Earnings per share
revenues were continuing from continuing from continuing
$185.5 billion, operations was operations operations
up 4.6%. $2.9 billion, was 1.5%, up increased to
up $0.9 billion. from 1.1% $5.03 from $3.51.
4 General Motors Corporation