SlideShare uma empresa Scribd logo
1 de 32
CITIGROUP - QUARTERLY FINANCIAL DATA SUPPLEMENT

                                                                      Page Number

 Citigroup Consolidated
    Financial Summary                                                      1
    Segment Core Income:
       Product View                                                        2
       Regional View                                                       3
    Segment Revenues:
       Product View                                                        4
       Regional View                                                       5

 Segment Detail
    Global Consumer:
      Cards
      Income Summary and Key Indicators                                    6
      Geographic Distribution                                              7
      Citi Cards                                                           8
      Consumer Finance
      Income Summary and Key Indicators                                    9
      Geographic Distribution                                             10
      Citifinancial                                                       11
      Retail Banking
      Income Summary and Key Indicators                                   12
      Geographic Distribution                                             13
    Global Corporate and Investment Bank:
      Income Statement                                                    14
      Revenue Details                                                     15
      Capital Markets and Banking                                         16
      Private Client                                                      17
      Transaction Services                                                18

    Global Investment Management:
      Life Insurance and Annuities                                        19
      Private Banking                                                     20
      Asset Management                                                    21

    Property and Casualty:
      Personal Lines                                                      22
      Commercial Lines                                                    23

    Proprietary Investment Activities                                     24

    Insurance Investment Portfolio                                        25

 Citigroup Supplemental Detail
    Consolidated Statement of Income                                      26
    Earnings Analysis - Managed Basis                                     27
    Consolidated Statement of Financial Position                          28
    Consumer Loan Delinquency Amounts, Net Credit Losses and Ratios       29
    Reserve for Loan Losses                                               30
    NonPerforming Assets                                                  31
CITIGROUP -- FINANCIAL SUMMARY
(In millions of dollars, except per share amounts)


                                        Citigroup, the preeminent global financial services company with 200 million customer accounts in more than 100 countries, provides consumers,
                                                                corporations, governments and institutions a complete range of financial products and services.

                                                                                                                                                                                           1Q 2002 vs.
                                                                                                1Q                2Q                3Q                4Q                 1Q              1Q 2001 Increase/
                                                                                               2001              2001              2001              2001               2002                (Decrease)
   Core Income                                                                                    $3,660            $3,785            $3,262            $3,862              $3,859              5%
   Restructuring -Related Items                                                                      (80)             (133)              (85)               13                 (30)
   Gain on Sale of Stock by Subsidiary                                                                -                 -                 -                 -                1,061
   Cumulative Effect of Accounting Changes                                                           (42)
                                                                                                        ###           (116)
                                                                                                                          ###             - ###             -                  (47)

   Net Income                                                                                     $3,538            $3,536            $3,177            $3,875              $4,843             37%


   Basic Earnings Per Share:
   Core Income                                                                                      $0.73            $0.75             $0.64             $0.75               $0.75              3%

   Net Income                                                                                       $0.70            $0.70             $0.62             $0.75               $0.94             34%

   Weighted average common shares
      applicable to Basic EPS                                                                     4,984.7           4,979.6          5,060.8            5,101.8            5,110.5

   Preferred Dividends - Basic                                                                        $28               $28               $28               $26                $21


   Diluted Earnings Per Share:
   Core Income                                                                                      $0.71            $0.74             $0.63             $0.74               $0.74              4%

   Net Income                                                                                       $0.69            $0.69             $0.61             $0.74               $0.93             35%


   Adjusted weighted average common shares
       applicable to Diluted EPS                                                                  5,110.0           5,100.0          5,169.0            5,209.1            5,209.8

   Preferred Dividends - Diluted                                                                      $28               $28               $28               $26                $21


   Common Shares Outstanding, at period end                                                       5,033.7           5,026.1          5,144.2            5,148.7            5,165.4


   Tier 1 Capital Ratio                                                                            8.56%             8.82%             8.20%             8.42%               9.13%
   Total Capital Ratio                                                                            11.31%            11.49%            10.77%            10.92%              11.59%
   Leverage Ratio                                                                                  6.10%             6.17%             5.65%             5.64%               5.89%


   Total Assets, at period end (in billions)                                                      $944.3            $953.4          $1,068.2           $1,051.5           $1,057.7
   Stockholders' Equity, at period end (in billions)                                                $68.7            $70.5             $78.4             $81.2               $83.6
   Stockholders' Equity and Trust Securities, at period end (in billions)                           $73.6            $75.1             $85.5             $88.4               $90.3


   Book Value Per Share, at period end                                                            $13.29            $13.68            $14.90            $15.48              $15.92


   Return on Common Equity (Net Income)                                                            21.7%             20.9%             17.1%             19.5%               24.0%
   Return on Common Equity (Core Income)                                                           22.5%             22.4%             17.5%             19.4%               19.1%


                                                                                                                                                                                                             Page 1
CITIGROUP -- CORE INCOME
PRODUCT VIEW
(In millions of dollars)


                                                                                                                                                                                               1Q 2002 vs.
                                                                                              1Q                  2Q                   3Q                   4Q                1Q            1Q 2001 Increase/
                                                                                             2001                2001                 2001                 2001              2002              (Decrease)
Global Consumer:
   Cards                                                                                            $586                $555                   $710                 $731            $597           2%
   Consumer Finance                                                                                 397                  491                   549                   488            536           35%
   Retail Banking                                                                                   563                  594                   727                   720            726           29%
   Other                                                                                             (41)                 (29)                  (24)                  (54)           (47)         (15%)

    Total Global Consumer                                                                          1,505                1,611                1,962                  1,885          1,812          20%

Global Corporate and Investment Bank:
   Capital Markets and Banking                                                                     1,201                1,033                1,006                   768           1,029          (14%)
   Private Client                                                                                    196                  206                  182                   189             197            1%
   Transaction Services                                                                               91                 116                   100                   113              82          (10%)
   Other                                                                                             (12)                 35                     7                    24             (22)         (83%)

     Total Global Corporate and Investment Bank                                                    1,476                1,390                1,295                  1,094          1,286          (13%)


Global Investment Management:
   Life Insurance and Annuities                                                               215                 236                  185                  200              204                  (5%)
   Private Banking                                                                            95                  92                   91                   94               112                  18%
   Asset Management                                                                           91                   84                  104                  125              126                  38%

     Total Global Investment Management                                                             401                  412                   380                   419            442           10%

Proprietary Investment Activities (1)                                                                  6                 208                   (185)                 289             51            NM

Corporate / Other                                                                                   (196)               (179)                  (133)                (129)            (78)         60%

Property and Casualty:
Personal Lines                                                                                        95                  47                     32                   60             71           (25%)
Commercial Lines                                                                              296                 302                  (127)                281              278                  (6%)
Realized Insurance Investment Portfolio Gains (Losses)                                              125                   32                     63                   (10)           19           (85%)
Interest and Other                                                                                   (48)                 (38)                  (25)                  (27)           (22)         54%
  Total Property and Casualty                                                                       468                  343                    (57)                 304            346           (26%)


Total Core Income                                                                              $3,660               $3,785               $3,262                $3,862          $3,859              5%

(1) Includes Realized Insurance Investment Portfolio Gains (Losses) primarily from the Life Insurance and Annuities, and Primerica Financial Services businesses.

NM Not meaningful

Reclassified to conform to the current period's presentation.
                                                                                                                                                                                                                Page 2
CITIGROUP -- CORE INCOME
REGIONAL VIEW
(In millions of dollars)


                                                                                                                                                                         1Q 2002 vs.
                                                                                         1Q               2Q              3Q              4Q             1Q            1Q 2001 Increase/
                                                                                        2001             2001            2001            2001           2002              (Decrease)

   North America (excluding Mexico) (1)
     Consumer                                                                                  $1,005      $1,065
                                                                                                                ###           $1,238
                                                                                                                                   ###     $1,275         $1,215             21%
     Corporate                                                                                    731         752                794          542            907             24%
     Investment Management                                                                        327         355                306          328            357              9%

        Total North America (excluding Mexico)                                                  2,063          2,172
                                                                                                                   ###         2,338
                                                                                                                                   ###         2,145          2,479          20%

   Mexico
     Consumer                                                                                     (14)           (13)           112             110            145            NM
     Corporate                                                                            19              22              4               61             98                   NM
     Investment Management                                                                          7             10              19              46             48           NM

        Total Mexico                                                                               12             19
                                                                                                                   ###          135
                                                                                                                                  ###           217            291            NM
   Western Europe
     Consumer                                                                                     104            98             115             130            134            29%
     Corporate                                                                                    186           126              85             146             44           (76%)
     Investment Management                                                                          1             1              -                4             (7)           NM
        Total Western Europe                                                                      291           225
                                                                                                                  ###           200
                                                                                                                                  ###           280            171           (41%)

   Japan
     Consumer                                                                                     205           242             259
                                                                                                                                  ###           257            240            17%
     Corporate                                                                                     98             4              19             (21)            23           (77%)
     Investment Management                                                                          8             6               9              10             16           100%
        Total Japan                                                                               311           252
                                                                                                                  ###           287
                                                                                                                                  ###           246            279           (10%)

   Asia (excluding Japan)
     Consumer                                                                                     142           144             157             165            145            2%
     Corporate                                                                                    128           225             101             176            175           37%
     Investment Management                                                                         27            14              18              20             27             -

        Total Asia                                                                                297           383
                                                                                                                  ###           276
                                                                                                                                  ###           361            347           17%

   Latin America
     Consumer                                                                                      49            55              57              (78)           (92)          NM
     Corporate                                                                                    162           155             175               57            (92)          NM
     Investment Management                                                                         23            18              22                2             (3)          NM

        Total Latin America                                                                       234           228
                                                                                                                  ###           254
                                                                                                                                  ###            (19)          (187)          NM

   Central & Eastern Europe, Middle East & Africa
     Consumer                                                                                      14            20              24              26             25            79%
     Corporate                                                                                    152           106             117             133            131           (14%)
     Investment Management                                                                          8             8               6               9              4           (50%)

        Total Central & Eastern Europe, Middle East & Africa                                      174           134
                                                                                                                  ###           147
                                                                                                                                  ###           168            160
                                                                                                                                                                 ###         (8%)

   Proprietary Investment Activities                                                                6           208             (185)           289              51           NM

   Corporate / Other                                                                             (196)          (179)           (133)           (129)           (78)         60%

   Property and Casualty:
     Personal Lines                                                                                95            47               32             60             71           (25%)
     Commercial Lines                                                                             296           302             (127)           281            278            (6%)
     Realized Insurance Investment Portfolio Gains (Losses)                                       125            32               63            (10)            19           (85%)
     Interest and Other                                                                           (48)          (38)             (25)           (27)           (22)           54%

     Total Property and Casualty                                                                  468           343              (57)           304            346           (26%)


Total Core Income                                                                              $3,660      $3,785          $3,262          $3,862         $3,859              5%

(1) Excludes Property and Casualty, Proprietary Investment Activities and Corporate / Other.

NM Not meaningful

Reclassified to conform to the current period's presentation.

                                                                                                                                                                                           Page 3
CITIGROUP -- ADJUSTED NET REVENUES
PRODUCT VIEW
(In millions of dollars)


                                                                                                                                                                                     1Q 2002 vs.
                                                                                      1Q                 2Q                  3Q                 4Q                   1Q            1Q 2001 Increase/
                                                                                     2001               2001                2001               2001                 2002              (Decrease)
Global Consumer:
   Cards                                                                                 $3,606             $3,675             $4,032              $4,195              $4,150            15%
   Consumer Finance                                                                         2,153              2,178               2,300              2,237               2,298           7%
   Retail Banking                                                                           2,490              2,568               3,021              3,159               3,335          34%
   Other                                                                                       42               120                 103                 54                   35         (17%)

    Total Global Consumer                                                                   8,291              8,541               9,456              9,645               9,818          18%

Global Corporate and Investment Bank:

   Capital Markets and Banking                                                              5,172              4,153               3,868              4,299               4,631         (10%)
   Private Client                                                                           1,549              1,508               1,450              1,433               1,477          (5%)
   Transaction Services                                                                      902                891                 856                867                  835          (7%)
   Other                                                                                     (65)               (18)                (60)               (59)                 (99)        (52%)

     Total Global Corporate and Investment Bank                                             7,558              6,534               6,114              6,540               6,844          (9%)


Global Investment Management:

   Life Insurance and Annuities                                                      1,170              1,014                972               1,223                1,002               (14%)
   Private Banking                                                                    392                376                 366                408                  423                 8%
   Asset Management                                                                   516                491                 546                532                 519                   1%

     Total Global Investment Management                                                     2,078              1,881               1,884              2,163               1,944          (6%)


Proprietary Investment Activities (1)                                                          41               311                 (262)              494                  117           NM

Corporate / Other                                                                            (132)              (105)                (87)               (10)                 96           NM


Property and Casualty:
Personal Lines                                                                              1,092              1,117               1,137              1,156               1,155           6%
Commercial Lines                                                                     1,994              2,040               1,992              2,036                2,047                 3%
Realized Insurance Investment Portfolio Gains (Losses)                                       192                  50                  96                (16)                 29         (85%)
Interest and Other                                                                            (67)               (54)                (36)               (39)                (34)         49%
  Total Property and Casualty                                                               3,211              3,153               3,189              3,137               3,197            -


Total Adjusted Net Revenues                                                            $21,047            $20,315            $20,294             $21,969             $22,016              5%

(1) Includes Realized Insurance Investment Portfolio Gains (Losses) primarily from the Life Insurance and Annuities, and Primerica Financial Services businesses.

NM Not meaningful

Reclassified to conform to the current period's presentation.

                                                                                                                                                                                                       Page 4
CITIGROUP -- ADJUSTED NET REVENUES
REGIONAL VIEW
(In millions of dollars)


                                                                                                                                                                                           1Q 2002 vs.
                                                                                        1Q                    2Q                  3Q                   4Q                  1Q            1Q 2001 Increase/
                                                                                       2001                  2001                2001                 2001                2002              (Decrease)

   North America (excluding Mexico) (1)
     Consumer                                                                             $5,786               $6,049              $6,406               $6,577              $6,601              14%
     Corporate                                                                             4,634                3,820               3,746                3,923               4,400              (5%)
     Investment Management                                                                 1,613                1,457               1,354                1,587               1,402             (13%)

        Total North America (excluding Mexico)                                            12,033               11,326
                                                                                                                    ###            11,506
                                                                                                                                        ###             12,087              12,403              3%

   Mexico
     Consumer                                                                                     57                  72                532                  750                 753            NM
     Corporate                                                                    84                    77                  83                  205                 198                         NM
     Investment Management                                                                        46                  46                106                  212                 185            NM

        Total Mexico                                                                            187                 195
                                                                                                                      ###               721
                                                                                                                                          ###            1,167               1,136              NM

   Western Europe
     Consumer                                                                                    564              540                   583                  607                 612            9%
     Corporate                                                                                 1,129            1,058                   803                  956                 796           (29%)
     Investment Management                                                                        77               73                    75                   71                  66           (14%)

        Total Western Europe                                                                   1,770            1,671
                                                                                                                    ###             1,461
                                                                                                                                        ###              1,634               1,474             (17%)
   Japan
     Consumer                                                                                   835                 837                 880                  878                 817            (2%)
     Corporate                                                                                  192                  50                  66                   16                  63           (67%)
     Investment Management                                                                       57                  57                  58                   63                  70            23%
        Total Japan                                                                            1,084                944
                                                                                                                      ###           1,004
                                                                                                                                        ###                  957                 950
                                                                                                                                                                                   ###         (12%)

   Asia (excluding Japan)
     Consumer                                                                                   548                 545                 559                  571                 557            2%
     Corporate                                                                                  557                 651                 509                  564                 569            2%
     Investment Management                                                                      107                  81                  85                   99                 103           (4%)
        Total Asia                                                                             1,212            1,277
                                                                                                                    ###             1,153
                                                                                                                                        ###              1,234               1,229              1%

   Latin America
     Consumer                                                                                   366                 357                 350                  114                 322           (12%)
     Corporate                                                                                  473                 456                 492                  447                 387           (18%)
     Investment Management                                                                      139                 131                 171                   91                  80           (42%)
        Total Latin America                                                                     978                 944
                                                                                                                      ###           1,013
                                                                                                                                        ###                  652                 789           (19%)

   Central & Eastern Europe, Middle East & Africa
     Consumer                                                                                   135                 141                 146                  148                 156            16%
     Corporate                                                                                  489                 422                 415                  429                 431           (12%)
     Investment Management                                                                       39                  36                  35                   40                  38            (3%)

        Total Central & Eastern Europe, Middle East & Africa                                    663                 599
                                                                                                                      ###               596
                                                                                                                                          ###                617                 625           (6%)

   Proprietary Investment Activities                                                              41                311                 (262)                494                 117            NM

   Corporate / Other                                                                           (132)                (105)                (87)                (10)                96             NM

   Property and Casualty:
     Personal Lines                                                                            1,092            1,117               1,137                1,156               1,155              6%
     Commercial Lines                                                                          1,994            2,040               1,992                2,036               2,047              3%
     Realized Insurance Investment Portfolio Gains (Losses)                                      192               50                  96                  (16)                 29             (85%)
     Interest and Other                                                                          (67)             (54)                (36)                 (39)                (34)             49%
     Total Property and Casualty                                                               3,211            3,153
                                                                                                                    ###             3,189
                                                                                                                                        ###              3,137               3,197               -


Total Adjusted Net Revenues                                                             $21,047               $20,315             $20,294              $21,969             $22,016              5%

(1) Excludes Property and Casualty, Proprietary Investment Activities and Corporate / Other.

NM- Not meaningful


                                                                                                                                                                                                             Page 5
GLOBAL CONSUMER
CARDS
(In millions of dollars)


                                                                                                                                              1Q 2002 vs.
                                                                 1Q             2Q             3Q             4Q             1Q            1Q 2001 Increase/
                                                                2001           2001           2001           2001           2002              (Decrease)
Adjusted Revenues, Net of Interest Expense (1)                        $3,606         $3,675         $4,032         $4,195         $4,150         15%
Adjusted Operating Expenses                                            1,355          1,314          1,361          1,398          1,321         (3%)
Adjusted Provision for Credit Losses (1)                               1,322          1,482          1,552          1,694          1,911         45%

Core Income Before Taxes                                                929            879           1,119          1,103           918          (1%)
Income Taxes                                                    343            324            409            372            321                  (6%)

Core Income                                                            $586           $555           $710           $731           $597           2%

Managed Average Assets (in billions of dollars)                        $117           $118           $122           $123           $123           5%

Return on Managed Assets                                              2.03%          1.89%          2.31%          2.36%          1.97%


KEY INDICATORS:
(in billions of dollars)


Total EOP Open Accounts (in millions):
  North America                                                         95.5           95.5           97.3           96.8           95.5           -
  International                                                         11.3           12.0           12.4           12.9           12.9         14%
            Total                                                      106.8          107.5          109.7          109.7          108.4          1%

Total Sales:
  North America                                                        $54.8          $59.0          $58.5          $60.9          $54.9           -
  International                                                          7.7            8.2            8.2            8.3            7.7           -
            Total                                                      $62.5          $67.2          $66.7          $69.2          $62.6           -

Average Managed Loans:
  North America                                                       $102.2         $102.4         $105.9         $107.6         $107.6          5%
  International                                                          9.5            9.8           10.4           10.4           10.2          7%
            Total                                                     $111.7         $112.2         $116.3         $118.0         $117.8          5%


Managed Net Credit Losses (in millions of dollars):
  North America                                                       $1,217         $1,401         $1,448         $1,589         $1,681         38%
  International                                                           90            102            100            104            112         24%
            Total                                                     $1,307         $1,503         $1,548         $1,693         $1,793         37%

End of Period Managed Receivables                                     $111.9         $116.0         $119.5         $122.6         $118.9          6%


Net Credit Loss Ratio                                                 4.74%          5.37%          5.28%          5.69%          6.17%

Loans 90+Days Past Due:
  In millions of dollars                                              $2,001         $1,938         $2,119         $2,384         $2,488         24%
  %                                                                    1.80%          1.68%          1.79%          1.96%          2.11%


(1) On a managed basis.

NM Not meaningful

Reclassified to conform to the current period's presentation.


                                                                                                                                                               Page 6
GLOBAL CONSUMER
CARDS
GEOGRAPHIC DISTRIBUTION
(In millions of dollars)


                                                                                                                                             1Q 2002 vs.
                                                                 1Q             2Q             3Q             4Q             1Q            1Q 2001 Increase/
                                                                2001           2001           2001           2001           2002              (Decrease)

GEOGRAPHIC DISTRIBUTION

North America
   Adjusted Revenues, Net of Interest Expense (1)                     $3,047         $3,130         $3,470         $3,738         $3,609         18%
   Adjusted Operating Expenses                                         1,058          1,024          1,082          1,122          1,040         (2%)
   Adjusted Provision for Credit Losses (1)                            1,229          1,379          1,449          1,589          1,681         37%
   Core Income Before Taxes                                             760            727            939           1,027           888          17%
   Income Taxes                                                 283            271            348            349            320                  13%

   Core Income                                                         $477           $456           $591           $678           $568          19%

   Managed Average Assets (in billions of dollars)                     $107           $107           $111           $112           $112           5%

   Return on Managed Assets                                           1.81%          1.71%          2.11%          2.40%          2.06%


International
   Total Revenues, Net of Interest Expense                             $559           $545           $562           $457           $541          (3%)
   Adjusted Operating Expenses                                          297            290            279            276            281          (5%)
   Provision for Credit Losses                                           93            103            103            105            230           NM
   Core Income Before Taxes                                             169            152            180             76             30          (82%)
   Income Taxes                                                 60             53             61             23             1                    (98%)

   Core Income                                                         $109            $99           $119            $53            $29          (73%)

   Average Assets (in billions of dollars)                              $10            $11            $11            $11            $11          10%

   Return on Assets                                                   4.42%          3.61%          4.29%          1.91%          1.07%

(1) On a managed basis.

NM Not meaningful

Reclassified to conform to the current period's presentation.


                                                                                                                                                               Page 7
GLOBAL CONSUMER
CARDS
CitiCards - Supplemental Data
(In millions of dollars)


                                                                                                                                                                       1Q 2002 vs.
                                                                                1Q                 2Q                    3Q             4Q             1Q            1Q 2001 Increase/
                                                                               2001               2001                  2001           2001           2002              (Decrease)
CitiCards and Diners Club:

Adjusted Revenues, Net of Interest Expense                                          $3,012              $3,085                $3,340         $3,548         $3,438         14%
Adjusted Operating Expenses                                                          1,040               1,002                 1,002          1,019            953         (8%)
Adjusted Provision for Credit Losses                                                 1,221               1,371                 1,434          1,567          1,659         36%
Core Income Before Taxes                                                              751                 712                   904            962            826          10%
Income Taxes                                                                  279                 264                   338            339            306                  10%

Core Income                                                                           $472               $448                  $566           $623           $520          10%

Managed Average Assets (in billions of dollars)                                       $106               $106                  $109           $110           $110           4%

Return on Managed Assets                                                            1.81%               1.70%                 2.06%           2.25%         1.92%

CitiCards (1):
KEY INDICATORS:
(in billions of dollars)

Net Interest Revenue (in millions of dollars) (2)                                   $2,379              $2,421                $2,696         $2,904         $2,767         16%
% of Average Managed Loans                                                           9.63%               9.65%                10.38%         11.04%         10.77%

Risk Adjusted Revenue (in millions of dollars) (3)                                  $1,716              $1,613                $1,838         $1,909         $1,705         (1%)
% of Average Managed Loans                                                           6.95%               6.43%                 7.08%          7.25%          6.64%

Adjusted Operating Expenses as % of Average Managed Loans                           3.93%               3.73%                 3.61%           3.50%         3.48%

End of Period Managed Receivables                                                   $100.5              $103.9                $105.6         $108.9         $105.4          5%
Total EOP Open Accounts (in millions)                                                 93.2                94.1                  93.4           92.9           91.6         (2%)
Total Sales                                                                          $51.2               $55.6                 $55.0          $56.7          $50.8         (1%)

End of Period Loans:
  On Balance Sheet                                                                   $32.6               $32.6                 $33.0          $34.2          $31.8         (2%)
  Securitized                                                                         60.1                61.4                  65.2           67.0           65.9         10%
  Held for Sale                                                                        7.0                 9.0                   6.5            6.5            6.5         (7%)

      Total                                                                          $99.7              $103.0                $104.7         $107.7         $104.2          5%

Average Loans:
  On Balance Sheet                                                                   $34.7               $33.5                 $33.5          $33.0          $30.9         (11%)
  Securitized                                                                         58.5                59.7                  61.3           64.9           66.8          14%
  Held for Sale                                                                        7.0                 7.4                   8.2            6.5            6.5          (7%)
      Total                                                                         $100.2              $100.6                $103.0         $104.4         $104.2          4%

Net Credit Losses (in millions of dollars):
  On Balance Sheet                                                                    $465               $481                  $541           $615           $633          36%
  Securitized                                                                          668                812                   790            870            935          40%
  Held for Sale                                                                         63                 90                    92             69             78          24%
      Total                                                                         $1,196              $1,383                $1,423         $1,554         $1,646         38%

Coincident Net Credit Loss Ratio                                                    4.84%               5.51%                 5.48%           5.91%         6.41%

12 Month Lagged Net Credit Loss Ratio                                               5.72%               6.29%                 5.96%           6.23%         6.66%

Loans 90+ Days Past Due:
  In millions of dollars                                                            $1,836              $1,775                $1,908         $2,135         $2,219         21%
  %                                                                                  1.84%               1.72%                 1.82%          1.98%          2.13%

(1) CitiCards is included within the North American Region of Cards and excludes Diners Club, Mexico and Puerto Rico.
(2) Includes delinquency and other risk-based charges.
(3) Risk Adjusted Revenue is adjusted revenues less managed net credit losses.
NM Not meaningful

Reclassified to conform to the current period's presentation.
                                                                                                                                                                                         Page 8
GLOBAL CONSUMER
CONSUMER FINANCE
(In millions of dollars)


                                                                                                                                              1Q 2002 vs.
                                                                 1Q             2Q             3Q             4Q             1Q            1Q 2001 Increase/
                                                                2001           2001           2001           2001           2002              (Decrease)
Adjusted Revenues, Net of Interest Expense                            $2,153         $2,178         $2,300         $2,237         $2,298           7%
Adjusted Operating Expenses                                              922            813            812            755            728         (21%)
Adjusted Provision for Credit Losses                                     603            594            623            709            737          22%

Core Income Before Taxes                                                628            771            865            773            833          33%
Income Taxes                                                    231            280            316            285            297                  29%

Core Income                                                            $397           $491           $549           $488           $536          35%

Average Assets (in billions of dollars)                                 $82            $83            $85            $86            $87           6%

Return on Assets                                                      1.96%          2.37%          2.56%          2.25%          2.50%


KEY INDICATORS

Average Loans (in billions of dollars):
  Real estate secured loans                                            $43.1          $43.4          $44.5          $45.3          $45.5          6%
  Personal loans                                                        18.7           18.9           19.4           19.6           19.2          3%
   Auto                                                                  3.8            4.4            4.9            5.4            5.7          50%
   Sales finance and other                                               3.5            3.5            3.5            3.5            3.0         (14%)

      Total                                                            $69.1          $70.2          $72.3          $73.8          $73.4          6%

Average Loans (in billions of dollars):
  North America                                                        $56.2          $57.0          $58.2          $59.2          $59.8          6%
  International                                                         12.9           13.2           14.1           14.6           13.6          5%
      Total                                                            $69.1          $70.2          $72.3          $73.8          $73.4          6%

Average Yield:
  North America                                                       14.05%         13.86%         13.53%         13.20%         13.18%
  International                                                       27.25%         25.36%         24.83%         23.07%         22.43%
      Total                                                           16.50%         16.02%         15.73%         15.14%         14.93%

Average Net Interest Margin:
  North America                                                        7.92%          8.18%          8.31%          8.36%          8.57%
  International                                                       23.78%         22.10%         21.78%         20.84%         20.59%
      Total                                                           10.87%         10.79%         10.93%         10.83%         10.84%


Net Credit Loss Ratio                                                 2.99%          2.91%          2.94%          3.54%          3.63%

Loans 90+ Days Past Due:
  In millions of dollars                                              $1,764         $1,943         $2,134         $2,243         $2,213         25%
  %                                                                    2.54%          2.74%          2.89%          3.04%          2.97%

Number of Offices:
  North America                                                        2,576          2,484          2,468          2,413          2,394         (7%)
  International                                                        1,180          1,183          1,174          1,150          1,141         (3%)
      Total                                                            3,756          3,667          3,642          3,563          3,535         (6%)


NM Not meaningful

Reclassified to conform to the current period's presentation.

                                                                                                                                                               Page 9
GLOBAL CONSUMER
CONSUMER FINANCE
GEOGRAPHIC DISTRIBUTION
(In millions of dollars)


                                                                                                                                              1Q 2002 vs.
                                                                 1Q              2Q             3Q             4Q             1Q            1Q 2001 Increase/
                                                                2001            2001           2001           2001           2002              (Decrease)
GEOGRAPHIC DISTRIBUTION
North America

   Adjusted Revenues, Net of Interest Expense                         $1,366          $1,388         $1,476         $1,457         $1,539          13%
   Adjusted Operating Expenses                                           593             523            515            470            503         (15%)
   Adjusted Provision for Benefits, Claims, and Credit Losses            415             419            439            504            509          23%
   Core Income Before Taxes                                             358             446            522            483            527          47%
   Income Taxes                                                 134             164            195            181            193                  44%
   Core Income                                                         $224            $282           $327           $302           $334          49%

   Average Assets (in billions of dollars)                              $65             $67            $68            $68            $69           6%

   Return on Assets                                                   1.40%           1.69%          1.91%          1.76%          1.96%


International

   Total Revenues, Net of Interest Expense                             $787            $790           $824           $780           $759           (4%)
   Adjusted Operating Expenses                                          329             290            297            285            225          (32%)
   Provision for Benefits, Claims, and Credit Losses                    188
                                                                          ###           175            184            205            228           21%
   Core Income Before Taxes                                             270             325            343            290            306          13%
   Income Taxes                                                          97             116            121            104            104          7%
   Core Income                                                         $173            $209           $222           $186           $202          17%

   Average Assets (in billions of dollars)                              $17             $16            $17            $18            $18           6%

   Return on Assets                                                   4.13%           5.24%          5.18%          4.10%          4.55%


NM Not meaningful

Reclassified to conform to the current period's presentation.


                                                                                                                                                                Page 10
GLOBAL CONSUMER
CONSUMER FINANCE
CITIFINANCIAL (1)
(In millions of dollars)


                                                                                                                                                                       1Q 2002 vs.
                                                                                1Q                 2Q                 3Q              4Q              1Q             1Q 2001 Increase/
                                                                               2001               2001               2001            2001            2002               (Decrease)

Adjusted Revenues, Net of Interest Expense                                          $1,330             $1,346              $1,430          $1,405          $1,479           11%
Adjusted Operating Expenses                                                            569                502                 492             443             475          (17%)
Adjusted Provision for Benefits, Claims, and Credit Losses                             408                412                 431             495             500           23%
Core Income Before Taxes                                                              353                432                 507             467             504           43%
Income Taxes                                                                  133                157                 190             174             184                   38%
Core Income                                                                           $220               $275               $317            $293            $320           45%

Average Assets (in billions of dollars)                                               $64                $66                 $67             $67             $68            6%

Return on Assets                                                                    1.39%              1.67%               1.88%           1.73%           1.91%


KEY INDICATORS:
(in billions of dollars)

Average Net Receivables (in billions of dollars):
  Real estate secured loans - Other                                                  $34.5              $34.2               $34.1           $33.9           $33.3          (3%)
  Real estate secured loans - PFS Sourced                                               5.4                6.1                 6.8             7.5             8.2         52%
  Personal loans                                                                        9.7                9.7                 9.6             9.6             9.6         (1%)
   Auto                                                                                3.5                4.1                 4.6             5.1             5.4          54%
   Sales finance and other                                                             2.6                2.4                 2.6             2.6             2.7          4%

      Total                                                                          $55.7              $56.5               $57.7           $58.7           $59.2           6%


Number of offices                                                                    2,430              2,336               2,320           2,221           2,199          (10%)

Average yield                                                                       13.87%             13.65%              13.30%          12.95%          13.07%
Average net interest margin                                                          7.76%              7.98%               8.09%           8.13%           8.41%
Net credit loss ratio                                                                2.50%              2.46%               2.45%           3.06%           2.97%

Loans 90+ Days Past Due:
  In millions of dollars                                                            $1,580             $1,751              $1,898          $1,991          $1,969          25%
  %                                                                                  2.82%              3.07%               3.25%           3.38%           3.30%


(1) CitiFinancial is included within the North American Region of Consumer Finance and excludes Mexico and Puerto Rico.

NM Not meaningful

Reclassified to conform to the current period's presentation.

                                                                                                                                                                                         Page 11
GLOBAL CONSUMER
RETAIL BANKING
(In millions of dollars)

                                                                                                                                                                                   1Q 2002 vs.
                                                                                    1Q                2Q                    3Q                4Q                  1Q             1Q 2001 Increase/
                                                                                   2001              2001                  2001              2001                2002               (Decrease)

Total Revenues, Net of Interest Expense                                                 $2,490              $2,568              $3,021              $3,159              $3,335         34%
Adjusted Operating Expenses                                                              1,373               1,397               1,594               1,741               1,773         29%
Provision for Benefits, Claims and Credit Losses                                           237                 230                 291                 303                 435         84%

Core Income Before Taxes and Minority Interest                                            880                 941                1,136               1,115               1,127         28%

Income Taxes                                                                              312                 340                 403                 386                 391          25%
Minority Interest, net of tax                                                     5                  7                   6                   9                   10                    100%

Core Income                                                                               $563               $594                 $727               $720                $726          29%

Average Assets (in billions of dollars)                                                   $119               $119                 $152               $167                $173          45%

Return on Assets                                                                        1.92%               2.00%               1.90%               1.71%               1.70%


KEY INDICATORS
(in billions of dollars)

Owned and Serviced Average Loans (in billion of dollars):
   North America                                                                         $53.8               $54.7               $63.8               $66.8               $68.9         28%
   International                                                                          37.9                37.1                37.8                37.7                36.7         (3%)

   Average Loans (1)                                                                     $91.7               $91.8              $101.6              $104.5              $105.6         15%


Average Customer Deposits (in billions of dollars)
    North America                                                                        $53.0               $53.8               $80.7               $85.5               $89.4         69%
    International                                                                         78.6                78.4                79.3                78.6                77.5         (1%)
   Total                                                                                $131.6              $132.2              $160.0              $164.1              $166.9         27%

EOP Accounts (in millions)
    North America                                                                         11.8                11.9                22.3                21.8                21.9         86%
    International                                                                         18.3                18.5                18.8                18.9                19.0          4%
   Total                                                                                  30.1                30.4                41.1                40.7                40.9         36%

Branches
    North America                                                                         577                 576                2,019               1,945               1,950          NM
    International                                                                         897                 906                  907                 913                 909          1%
   Total                                                                                 1,474               1,482               2,926               2,858               2,859         94%

ATM-only locations
    North America                                                                         153                 156                 162                 165                 165           8%
    International                                                                         300                 320                 380                 382                 392          31%
   Total                                                                                  453                 476                 542                 547                 557          23%

Proprietary ATMs
    North America                                                                        2,331               2,320               6,554               6,574               6,652          NM
    International                                                                        2,059               2,101               2,178               2,195               2,197          7%
   Total                                                                                 4,390               4,421               8,732               8,769               8,849          NM

Net Credit Loss Ratio                                                                   0.55%               0.53%               0.72%               0.78%               0.78%

Loans 90+Days Past Due:
  In millions of dollars                                                                $2,270              $2,475              $3,316              $3,437              $3,481
  %                                                                                      2.48%               2.71%               3.19%               3.30%               3.34%

Primerica Financial Services:
   Agents Licensed for Life Insurance                                          88,907            93,998              93,156              95,679              98,272                    11%
   Life Insurance in Force (in billions of dollars)                            $415.4            $422.9              $427.7              $434.8              $441.3                     6%
   Total Mutual Fund Sales (in millions of dollars)                            $993.8            $868.3              $776.5              $770.2              $936.8                    (6%)
   Cash advanced on Loans (in millions of dollars) (2)                         $694.5            $1,091.9            $1,006.1            $1,077.3            $1,253.8                  81%
   Variable Annuity Net Written Premiums & Deposits (in millions of dollars)   $247.6            $237.1              $222.1              $217.2              $224.9                    (9%)

(1) Includes loans held for sale.
(2) Represents loan products marketed by PFS; the receivables are primarily reflected in the assets of Consumer Finance.
NM Not meaningful


                                                                                                                                                                                                     Page 12
GLOBAL CONSUMER
RETAIL BANKING
GEOGRAPHIC AND BUSINESS DISTRIBUTION
(In millions of dollars)

                                                                                                                  1Q 2002 vs.
                                         1Q             2Q             3Q            4Q            1Q           1Q 2001 Increase/
                                        2001           2001           2001          2001          2002             (Decrease)
REVENUES:

North America:

   Citibanking North America                   $637           $692           $740          $762          $796         25%
   Consumer Assets                              239            265            257           261           299         25%
   Primerica Financial Services                 490            497           493           499           512           4%
   Mexico                                        24             28           399           554           565           NM

   Total North America Retail Banking     $1,390         $1,482         $1,889        $2,076        $2,172            56%

International:

   Western Europe                              $389           $373           $397          $406          $416          7%
   Japan                                        106            109            114           106           104         (2%)
   Asia (excluding Japan)                       319            319            323           336           327          3%
   Latin America                                205            200            210           148           224          9%
   CEEMEA                                        81             85            88            87            92          14%

   Total International Retail Banking      1,100          1,086          1,132         1,083         1,163             6%

   Total Retail Banking                   $2,490         $2,568         $3,021        $3,159        $3,335            34%


CORE INCOME:

North America:

   Citibanking North America                   $152           $152           $155          $180          $192         26%
   Consumer Assets                               75             86             90            92            93         24%
   Primerica Financial Services                 125            128            125           134           128         2%
   Mexico                                       (19)           (22)            85            53            90         NM

   Total North America Retail Banking          $333           $344           $455          $459          $503         51%

International:

   Western Europe                               $70            $69           $78           $88           $93          33%
   Japan                                         31             34            38            35            33          6%
   Asia (excluding Japan)                        99            104           105           112           104          5%
   Latin America                                 22             30            35             9           (19)         NM
   CEEMEA                                         8             13            16            17            12          50%

   Total International Retail Banking           230            250           272           261           223          (3%)

   Total Retail Banking                        $563           $594           $727          $720          $726         29%


   NM Not meaningful

                                                                                                                                    Page 13
GLOBAL CORPORATE AND INVESTMENT BANK
INCOME STATEMENT
(In millions of dollars)


                                                                                                                                   1Q 2002 vs.
                                                                 1Q           2Q           3Q           4Q           1Q          1Q 2001 Increase/
                                                                2001         2001         2001         2001         2002            (Decrease)
Revenues:
 Commissions and Fees                                             $1,402       $1,320       $1,218       $1,260       $1,363            (3%)
 Asset Management and Administration Fees                            704          682          695          636          675            (4%)
 Investment Banking                                                1,239        1,138          929        1,210        1,043           (16%)
 Principal Transactions                                            2,077        1,268          812          684        1,360           (35%)
 Other Income                                                        290          139          445          138           (8)            NM
   Total Non-Interest Revenues                                     5,712        4,547        4,099        3,928        4,433           (22%)
    Net Interest and Dividends                                     1,846        1,987        2,015        2,612        2,411           31%
     Total Revenues, Net of Interest Expense                       7,558        6,534        6,114        6,540        6,844           (9%)
Non-Interest Expenses:
 Compensation and Benefits                                         3,333        2,748        2,518        2,754        3,014           (10%)
 Other Operating and Administrative Expenses                       1,630        1,339        1,350        1,419        1,180           (28%)
      Total Non-Interest Expenses                                  4,963        4,087        3,868        4,173        4,194           (15%)
Provision for Credit Losses                                            277          288          217          682          680          NM
Core Income Before Taxes and Minority Interest                     2,318        2,159        2,029        1,685        1,970           (15%)
Income Taxes and Minority Interest, Net of Tax                         842          769          734          591          684         (19%)
   Core Income                                                    $1,476       $1,390       $1,295       $1,094       $1,286           (13%)


Pre-tax Profit Margin                                              30.7%        33.0%        33.2%        25.8%        28.8%
Non-Compensation Expenses as a Percent of
 Net Revenues                                                      21.6%        20.5%        22.1%        21.7%        17.2%
Compensation and Benefits Expenses as a Percent of
 Net Revenues                                                      44.1%        42.1%        41.2%        42.1%        44.0%


NM Not meaningful

Reclassified to conform to the current period's presentation.


                                                                                                                                                     Page 14
GLOBAL CORPORATE AND INVESTMENT BANK
REVENUE DETAILS
(In millions of dollars)


                                                                                                                                        1Q 2002 vs.
                                                                 1Q            2Q            3Q            4Q            1Q           1Q 2001 Increase/
                                                                2001          2001          2001          2001          2002             (Decrease)


Investment Banking Revenue:

 Underwriting                                                          $657          $656          $522          $587          $691          5%
 Advisory and Other Fees                                               582           482           407           623           352          (40%)

   Total Investment Banking Revenues                              $1,239        $1,138             $929     $1,210        $1,043            (16%)


Trading Related Revenue by Product:
       Fixed Income                                               $1,299             $969          $800     $1,016        $1,398             8%
       Equities                                                      472              214           101         95           147            (69%)
       Foreign Exchange                                              365              399           295        458           467             28%
       All Other                                                      64               47            38         48            77             20%

      Total Trading Related Revenue                               $2,200        $1,629        $1,234        $1,617        $2,089            (5%)


Trading Related Revenue by Income Statement Line:
       Principal Transactions                                     $2,077        $1,268             $812          $684     $1,360            (35%)
       Net Interest Revenue                                          123           361              422           933        729             NM

      Total Trading Related Revenue                               $2,200        $1,629        $1,234        $1,617        $2,089            (5%)


NM Not meaningful

Reclassified to conform to the current period's presentation.


                                                                                                                                                          Page 15
GLOBAL CORPORATE AND INVESTMENT BANK
CAPITAL MARKETS AND BANKING
(In millions of dollars)


                                                                                                                                                                     1Q 2002 vs.
                                                                 1Q                  2Q                  3Q                  4Q                    1Q              1Q 2001 Increase/
                                                                2001                2001                2001                2001                  2002                (Decrease)
Total Revenues, Net of Interest Expense                               $5,172              $4,153              $3,868              $4,299               $4,631                (10%)
Adjusted Operating Expenses                                            2,984               2,227               2,089               2,441                2,435                (18%)
Provision for Credit Losses                                              270                 286                 212                 671                  611                 NM

Core Income Before Taxes                                               1,918               1,640               1,567               1,187                1,585                (17%)
Income Taxes                                                    717                 607                 561                 419                  556                         (22%)

Core Income                                                           $1,201              $1,033              $1,006               $768                $1,029                (14%)


Investment Banking
Underwriting (full credit to book manager):
   Debt and equity:
     Global Volume (1)                                            $130,992            $118,924             $95,712            $150,496              $132,098                  1%
     Global Market Share                                             12.2%               11.0%               10.8%               14.2%                 11.6%
     Rank                                                                2                   2                   1                   1                     1

      U.S. Volume (2)                                              $99,735             $94,938             $80,201            $127,913              $109,423                 10%
      U.S. Market Share                                              14.1%               12.5%               11.8%               16.6%                 13.5%
      Rank                                                               2                   2                   1                   1                     1


(1) Includes non-convertible debt, Rule 144A non-convertible debt, Rule 144A non-convertible preferred, non-convertible preferred, preferred, taxable municipal debt, mortgage and asset
    backed debt, all common stock, convertible debt and convertible preferred. Excludes all closed end funds.
(2) Includes all U.S. mortgage and asset backed debt, U.S. non-convertible debt, U.S. Rule 144A non-convertible and U.S. taxable municipal debt, all U.S. common
    stock, U.S. convertible debt and U.S. convertible preferred. Excludes all closed end funds, 144A common stock, 144A convertible stock, and 144A convertible preferred.


NM Not meaningful


                                                                                                                                                                                           Page 16
GLOBAL CORPORATE AND INVESTMENT BANK
PRIVATE CLIENT
(In millions of dollars)


                                                                                                                                           1Q 2002 vs.
                                                              1Q             2Q              3Q             4Q             1Q            1Q 2001 Increase/
                                                             2001           2001            2001           2001           2002              (Decrease)
Total Revenues, Net of Interest Expense                            $1,549         $1,508          $1,450         $1,433         $1,477         (5%)
Adjusted Operating Expenses                                         1,235          1,179           1,157          1,130          1,165         (6%)
Provision for Credit Losses                                             -             (1)              3              2              -           -

Core Income Before Taxes                                             314            330             290            301            312          (1%)
Income Taxes                                                 118            124             108            112            115                  (3%)

Core Income                                                         $196           $206            $182           $189           $197           1%


Private Client
Financial Consultants                                              12,675         12,802          12,963         12,927         12,767          1%
Annualized Revenue per FC (000)                                      $501           $473            $450           $440           $473         (6%)
Branch offices                                                        530            530             538            536            536          1%

Salomon Smith Barney
Client Assets (in billions of dollars)

Assets Under Fee-Based Management

Consulting Group and Internally Managed Accounts                   $134.4         $149.3          $134.9         $150.2         $154.3         15%
Financial Consultant Managed Accounts                                51.9           57.0            49.4           54.9           55.2          6%

   Total (1)                                                       $186.3         $206.3          $184.3         $205.1         $209.5         12%

Total Client Assets                                                  $911           $981           $905            $977          $994           9%
U.S. Bank Deposit Program                                           $17.7          $25.4           $30.9          $35.6          $37.5          NM


(1) Includes some assets jointly managed with Citigroup Asset Management.

NM Not meaningful


                                                                                                                                                             Page 17
GLOBAL CORPORATE AND INVESTMENT BANK
TRANSACTION SERVICES
(In millions of dollars)


                                                                                                                                        1Q 2002 vs.
                                                                 1Q            2Q            3Q            4Q            1Q           1Q 2001 Increase/
                                                                2001          2001          2001          2001          2002             (Decrease)
Total Revenues, Net of Interest Expense                                $902          $891          $856          $867          $835          (7%)
Adjusted Operating Expenses                                             749           698           697           684           642         (14%)
Provision for Credit Losses                                               7             3             2             9            69           NM

Core Income Before Taxes                                               146           190           157           174           124          (15%)
Income Taxes                                                    55            71            55            59            41                  (25%)
Minority Interest, net of tax                                   -             3             2             2             1

Core Income                                                            $91           $116          $100          $113          $82          (10%)


Liability Balances (Average in billions)                               $74           $75           $79           $80           $82          11%


Assets Under Custody (EOP in trillions)                                $4.2          $4.5          $4.6          $4.8          $5.2         24%


NM Not meaningful
Reclassified to conform to the current period's presentation.


                                                                                                                                                          Page 18
citigroup Financial Supplement Reclassifications for 1Q05

Mais conteúdo relacionado

Mais procurados

citigroup Financial Supplement April 18, 2008 - First Quarter
citigroup  Financial Supplement April 18, 2008 - First Quartercitigroup  Financial Supplement April 18, 2008 - First Quarter
citigroup Financial Supplement April 18, 2008 - First QuarterQuarterlyEarningsReports
 
citi group January 21, 2003 - Fourth Quarter Press Release
citi group January 21, 2003 - Fourth Quarter Press Releaseciti group January 21, 2003 - Fourth Quarter Press Release
citi group January 21, 2003 - Fourth Quarter Press ReleaseQuarterlyEarningsReports
 
citigroup April 16, 2007 - First Quarter Financial Supplement
citigroup April 16, 2007 - First Quarter Financial Supplementcitigroup April 16, 2007 - First Quarter Financial Supplement
citigroup April 16, 2007 - First Quarter Financial SupplementQuarterlyEarningsReports
 
ppg industries 1Q08EARNINGSPRESSRELEASETABLES
ppg industries 1Q08EARNINGSPRESSRELEASETABLESppg industries 1Q08EARNINGSPRESSRELEASETABLES
ppg industries 1Q08EARNINGSPRESSRELEASETABLESfinance22
 
citi July 16, 2001 - Second Quarter Financial Supplement
citi July 16, 2001 - Second Quarter Financial Supplementciti July 16, 2001 - Second Quarter Financial Supplement
citi July 16, 2001 - Second Quarter Financial SupplementQuarterlyEarningsReports
 
ameriprise Q308_Release
ameriprise Q308_Releaseameriprise Q308_Release
ameriprise Q308_Releasefinance43
 
citigroup April 16, 2007 - First Quarter Press Release
citigroup April 16, 2007 - First Quarter Press Releasecitigroup April 16, 2007 - First Quarter Press Release
citigroup April 16, 2007 - First Quarter Press ReleaseQuarterlyEarningsReports
 
motorola 2001 Summary Annual Report
motorola 	2001 Summary Annual Reportmotorola 	2001 Summary Annual Report
motorola 2001 Summary Annual Reportfinance7
 
Citigrioup 3 q 2011
Citigrioup 3 q 2011Citigrioup 3 q 2011
Citigrioup 3 q 2011Frank Ragol
 
Q1/05Schedules_Baxter
Q1/05Schedules_BaxterQ1/05Schedules_Baxter
Q1/05Schedules_Baxterfinance24
 

Mais procurados (17)

citigroup Financial Supplement
citigroup Financial Supplementcitigroup Financial Supplement
citigroup Financial Supplement
 
citigroup Financial Supplement April 18, 2008 - First Quarter
citigroup  Financial Supplement April 18, 2008 - First Quartercitigroup  Financial Supplement April 18, 2008 - First Quarter
citigroup Financial Supplement April 18, 2008 - First Quarter
 
citi group January 21, 2003 - Fourth Quarter Press Release
citi group January 21, 2003 - Fourth Quarter Press Releaseciti group January 21, 2003 - Fourth Quarter Press Release
citi group January 21, 2003 - Fourth Quarter Press Release
 
citigroup April 16, 2007 - First Quarter Financial Supplement
citigroup April 16, 2007 - First Quarter Financial Supplementcitigroup April 16, 2007 - First Quarter Financial Supplement
citigroup April 16, 2007 - First Quarter Financial Supplement
 
citigroup Qer084s
citigroup Qer084scitigroup Qer084s
citigroup Qer084s
 
citigroup April 18, 2008 - First Quarter
citigroup April 18, 2008 - First Quartercitigroup April 18, 2008 - First Quarter
citigroup April 18, 2008 - First Quarter
 
First Quarter 2008 Earnings Presentation
First Quarter 2008 Earnings PresentationFirst Quarter 2008 Earnings Presentation
First Quarter 2008 Earnings Presentation
 
ppg industries 1Q08EARNINGSPRESSRELEASETABLES
ppg industries 1Q08EARNINGSPRESSRELEASETABLESppg industries 1Q08EARNINGSPRESSRELEASETABLES
ppg industries 1Q08EARNINGSPRESSRELEASETABLES
 
Bankofamericaslides
BankofamericaslidesBankofamericaslides
Bankofamericaslides
 
citi July 16, 2001 - Second Quarter Financial Supplement
citi July 16, 2001 - Second Quarter Financial Supplementciti July 16, 2001 - Second Quarter Financial Supplement
citi July 16, 2001 - Second Quarter Financial Supplement
 
citigroup Financial Supplement
citigroup Financial Supplementcitigroup Financial Supplement
citigroup Financial Supplement
 
ameriprise Q308_Release
ameriprise Q308_Releaseameriprise Q308_Release
ameriprise Q308_Release
 
citigroup April 16, 2007 - First Quarter Press Release
citigroup April 16, 2007 - First Quarter Press Releasecitigroup April 16, 2007 - First Quarter Press Release
citigroup April 16, 2007 - First Quarter Press Release
 
motorola 2001 Summary Annual Report
motorola 	2001 Summary Annual Reportmotorola 	2001 Summary Annual Report
motorola 2001 Summary Annual Report
 
Citigrioup 3 q 2011
Citigrioup 3 q 2011Citigrioup 3 q 2011
Citigrioup 3 q 2011
 
citigroup January 15, 2008
citigroup January 15, 2008citigroup January 15, 2008
citigroup January 15, 2008
 
Q1/05Schedules_Baxter
Q1/05Schedules_BaxterQ1/05Schedules_Baxter
Q1/05Schedules_Baxter
 

Destaque (6)

Pan Diario 21 De Enero De 2009
Pan Diario 21 De Enero De 2009Pan Diario 21 De Enero De 2009
Pan Diario 21 De Enero De 2009
 
citigroup Financial Supplement July 2, 2008
citigroup Financial Supplement July 2, 2008citigroup Financial Supplement July 2, 2008
citigroup Financial Supplement July 2, 2008
 
Menu
MenuMenu
Menu
 
Flash desktop application development with Screenweaver 3.1
Flash desktop application development with Screenweaver 3.1Flash desktop application development with Screenweaver 3.1
Flash desktop application development with Screenweaver 3.1
 
20060630 Google 10 Q
20060630 Google 10 Q20060630 Google 10 Q
20060630 Google 10 Q
 
A Matter Of Choice
A Matter Of ChoiceA Matter Of Choice
A Matter Of Choice
 

Semelhante a citigroup Financial Supplement Reclassifications for 1Q05

citigroup October 20, 2003 - Third Quarter Financial Supplement
citigroup October 20, 2003 - Third Quarter Financial Supplementcitigroup October 20, 2003 - Third Quarter Financial Supplement
citigroup October 20, 2003 - Third Quarter Financial SupplementQuarterlyEarningsReports
 
citigroup October 16, 2008 - Third Quarter Press Release
citigroup October 16, 2008 - Third Quarter Press Releasecitigroup October 16, 2008 - Third Quarter Press Release
citigroup October 16, 2008 - Third Quarter Press ReleaseQuarterlyEarningsReports
 
citigroup Financial Supplement July 18, 2008 - Second Quarter
citigroup Financial Supplement July 18, 2008 - Second Quartercitigroup Financial Supplement July 18, 2008 - Second Quarter
citigroup Financial Supplement July 18, 2008 - Second QuarterQuarterlyEarningsReports
 
citigroup April 16, 2001 - First Quarter Financial Supplement
citigroup April 16, 2001 - First Quarter  Financial Supplementcitigroup April 16, 2001 - First Quarter  Financial Supplement
citigroup April 16, 2001 - First Quarter Financial SupplementQuarterlyEarningsReports
 
citigroup April 17, 2000 - First Quarter Financial Supplement
citigroup April 17, 2000 - First Quarter Financial Supplementcitigroup April 17, 2000 - First Quarter Financial Supplement
citigroup April 17, 2000 - First Quarter Financial SupplementQuarterlyEarningsReports
 
citigroup July 19, 2000 - Second Quarter Financial Supplement
citigroup July 19, 2000 - Second Quarter Financial Supplementcitigroup July 19, 2000 - Second Quarter Financial Supplement
citigroup July 19, 2000 - Second Quarter Financial SupplementQuarterlyEarningsReports
 
citigroup January 16, 2001 - Fourth Quarter Financial Supplement
citigroup January 16, 2001 - Fourth Quarter Financial Supplementcitigroup January 16, 2001 - Fourth Quarter Financial Supplement
citigroup January 16, 2001 - Fourth Quarter Financial SupplementQuarterlyEarningsReports
 
ciitigroup January 20, 2004 - Fourth Quarter
ciitigroup January 20, 2004 - Fourth Quarterciitigroup January 20, 2004 - Fourth Quarter
ciitigroup January 20, 2004 - Fourth QuarterQuarterlyEarningsReports
 
citigroup January 17, 2002 - Fourth Quarter Financial Supplement
citigroup January 17, 2002 - Fourth Quarter  Financial Supplementcitigroup January 17, 2002 - Fourth Quarter  Financial Supplement
citigroup January 17, 2002 - Fourth Quarter Financial SupplementQuarterlyEarningsReports
 
citigroup April 17, 2006 - First Quarter Press Release
citigroup April 17, 2006 - First Quarter Press Releasecitigroup April 17, 2006 - First Quarter Press Release
citigroup April 17, 2006 - First Quarter Press ReleaseQuarterlyEarningsReports
 
ameriprise 4Q06_Supplement
ameriprise 4Q06_Supplementameriprise 4Q06_Supplement
ameriprise 4Q06_Supplementfinance43
 
citigroup January 15, 2008 - Fourth Quarter Press Release
citigroup January 15, 2008 - Fourth Quarter Press Releasecitigroup January 15, 2008 - Fourth Quarter Press Release
citigroup January 15, 2008 - Fourth Quarter Press ReleaseQuarterlyEarningsReports
 

Semelhante a citigroup Financial Supplement Reclassifications for 1Q05 (20)

citigroup October 20, 2003 - Third Quarter Financial Supplement
citigroup October 20, 2003 - Third Quarter Financial Supplementcitigroup October 20, 2003 - Third Quarter Financial Supplement
citigroup October 20, 2003 - Third Quarter Financial Supplement
 
citigroup October 15, 2007 - Third Quarte
citigroup October 15, 2007 - Third Quartecitigroup October 15, 2007 - Third Quarte
citigroup October 15, 2007 - Third Quarte
 
citigroup July 20, 2007 - Second Quarter
citigroup July 20, 2007 - Second Quartercitigroup July 20, 2007 - Second Quarter
citigroup July 20, 2007 - Second Quarter
 
citigroup October 16, 2008 - Third Quarter Press Release
citigroup October 16, 2008 - Third Quarter Press Releasecitigroup October 16, 2008 - Third Quarter Press Release
citigroup October 16, 2008 - Third Quarter Press Release
 
citigroup Financial Supplement July 18, 2008 - Second Quarter
citigroup Financial Supplement July 18, 2008 - Second Quartercitigroup Financial Supplement July 18, 2008 - Second Quarter
citigroup Financial Supplement July 18, 2008 - Second Quarter
 
citigroup Financial Supplement
citigroup Financial Supplementcitigroup Financial Supplement
citigroup Financial Supplement
 
citigroup April 16, 2001 - First Quarter Financial Supplement
citigroup April 16, 2001 - First Quarter  Financial Supplementcitigroup April 16, 2001 - First Quarter  Financial Supplement
citigroup April 16, 2001 - First Quarter Financial Supplement
 
citigroup April 17, 2000 - First Quarter Financial Supplement
citigroup April 17, 2000 - First Quarter Financial Supplementcitigroup April 17, 2000 - First Quarter Financial Supplement
citigroup April 17, 2000 - First Quarter Financial Supplement
 
citigroup July 19, 2000 - Second Quarter Financial Supplement
citigroup July 19, 2000 - Second Quarter Financial Supplementcitigroup July 19, 2000 - Second Quarter Financial Supplement
citigroup July 19, 2000 - Second Quarter Financial Supplement
 
citigroup Financial Supplement
citigroup Financial Supplementcitigroup Financial Supplement
citigroup Financial Supplement
 
citigroup Financial Supplement
citigroup Financial Supplementcitigroup Financial Supplement
citigroup Financial Supplement
 
citigroup January 16, 2001 - Fourth Quarter Financial Supplement
citigroup January 16, 2001 - Fourth Quarter Financial Supplementcitigroup January 16, 2001 - Fourth Quarter Financial Supplement
citigroup January 16, 2001 - Fourth Quarter Financial Supplement
 
citigroup Financial Supplement
citigroup Financial Supplementcitigroup Financial Supplement
citigroup Financial Supplement
 
ciitigroup January 20, 2004 - Fourth Quarter
ciitigroup January 20, 2004 - Fourth Quarterciitigroup January 20, 2004 - Fourth Quarter
ciitigroup January 20, 2004 - Fourth Quarter
 
citigroup January 17, 2002 - Fourth Quarter Financial Supplement
citigroup January 17, 2002 - Fourth Quarter  Financial Supplementcitigroup January 17, 2002 - Fourth Quarter  Financial Supplement
citigroup January 17, 2002 - Fourth Quarter Financial Supplement
 
citigroup April 17, 2006 - First Quarter Press Release
citigroup April 17, 2006 - First Quarter Press Releasecitigroup April 17, 2006 - First Quarter Press Release
citigroup April 17, 2006 - First Quarter Press Release
 
standardchartered Final Results 2004
standardchartered  	Final Results 2004standardchartered  	Final Results 2004
standardchartered Final Results 2004
 
ameriprise 4Q06_Supplement
ameriprise 4Q06_Supplementameriprise 4Q06_Supplement
ameriprise 4Q06_Supplement
 
citigroupFinancial Supplement
citigroupFinancial SupplementcitigroupFinancial Supplement
citigroupFinancial Supplement
 
citigroup January 15, 2008 - Fourth Quarter Press Release
citigroup January 15, 2008 - Fourth Quarter Press Releasecitigroup January 15, 2008 - Fourth Quarter Press Release
citigroup January 15, 2008 - Fourth Quarter Press Release
 

Mais de QuarterlyEarningsReports

citigroup April 17, 2000 - First Quarter Press Release
citigroup April 17, 2000 - First Quarter Press Releasecitigroup April 17, 2000 - First Quarter Press Release
citigroup April 17, 2000 - First Quarter Press ReleaseQuarterlyEarningsReports
 
citigroup July 19, 2000 - Second Quarter Press Release
citigroup  July 19, 2000 - Second Quarter Press Releasecitigroup  July 19, 2000 - Second Quarter Press Release
citigroup July 19, 2000 - Second Quarter Press ReleaseQuarterlyEarningsReports
 
citigroup October 17, 2000 - Third Quarter Press Release
citigroup October 17, 2000 - Third Quarter Press Releasecitigroup October 17, 2000 - Third Quarter Press Release
citigroup October 17, 2000 - Third Quarter Press ReleaseQuarterlyEarningsReports
 
citigroup January 16, 2001 - Fourth Quarter Press Release
citigroup January 16, 2001 - Fourth Quarter Press Releasecitigroup January 16, 2001 - Fourth Quarter Press Release
citigroup January 16, 2001 - Fourth Quarter Press ReleaseQuarterlyEarningsReports
 
citigroup April 16, 2001 - First Quarter Press Release
citigroup April 16, 2001 - First Quarter Press Releasecitigroup April 16, 2001 - First Quarter Press Release
citigroup April 16, 2001 - First Quarter Press ReleaseQuarterlyEarningsReports
 
citigroup July 16, 2001 - Second Quarter Press Release
citigroup July 16, 2001 - Second Quarter Press Releasecitigroup July 16, 2001 - Second Quarter Press Release
citigroup July 16, 2001 - Second Quarter Press ReleaseQuarterlyEarningsReports
 
citigroup October 17, 2001 - Third Quarter Financial Supplement
citigroup October 17, 2001 - Third Quarter  Financial Supplementcitigroup October 17, 2001 - Third Quarter  Financial Supplement
citigroup October 17, 2001 - Third Quarter Financial SupplementQuarterlyEarningsReports
 
citigroup October 17, 2001 - Third Quarter Press Release
citigroup October 17, 2001 - Third Quarter Press Releasecitigroup October 17, 2001 - Third Quarter Press Release
citigroup October 17, 2001 - Third Quarter Press ReleaseQuarterlyEarningsReports
 
citigroup April 15, 2002 - First Quarter Press Release
citigroup April 15, 2002 - First Quarter Press Releasecitigroup April 15, 2002 - First Quarter Press Release
citigroup April 15, 2002 - First Quarter Press ReleaseQuarterlyEarningsReports
 
citigroup October 15, 2002 - Third Quarter Press Release
citigroup October 15, 2002 - Third Quarter Press Releasecitigroup October 15, 2002 - Third Quarter Press Release
citigroup October 15, 2002 - Third Quarter Press ReleaseQuarterlyEarningsReports
 
citigroup Financial Supplement April 18, 2008 - First Quarter
citigroup  Financial Supplement April 18, 2008 - First Quartercitigroup  Financial Supplement April 18, 2008 - First Quarter
citigroup Financial Supplement April 18, 2008 - First QuarterQuarterlyEarningsReports
 
citigroup April 14, 2003 - First Quarter Financial Supplement
citigroup April 14, 2003 - First Quarter Financial Supplementcitigroup April 14, 2003 - First Quarter Financial Supplement
citigroup April 14, 2003 - First Quarter Financial SupplementQuarterlyEarningsReports
 
citigroup April 14, 2003 - First Quarter Press Release
citigroup April 14, 2003 - First Quarter Press Releasecitigroup April 14, 2003 - First Quarter Press Release
citigroup April 14, 2003 - First Quarter Press ReleaseQuarterlyEarningsReports
 

Mais de QuarterlyEarningsReports (13)

citigroup April 17, 2000 - First Quarter Press Release
citigroup April 17, 2000 - First Quarter Press Releasecitigroup April 17, 2000 - First Quarter Press Release
citigroup April 17, 2000 - First Quarter Press Release
 
citigroup July 19, 2000 - Second Quarter Press Release
citigroup  July 19, 2000 - Second Quarter Press Releasecitigroup  July 19, 2000 - Second Quarter Press Release
citigroup July 19, 2000 - Second Quarter Press Release
 
citigroup October 17, 2000 - Third Quarter Press Release
citigroup October 17, 2000 - Third Quarter Press Releasecitigroup October 17, 2000 - Third Quarter Press Release
citigroup October 17, 2000 - Third Quarter Press Release
 
citigroup January 16, 2001 - Fourth Quarter Press Release
citigroup January 16, 2001 - Fourth Quarter Press Releasecitigroup January 16, 2001 - Fourth Quarter Press Release
citigroup January 16, 2001 - Fourth Quarter Press Release
 
citigroup April 16, 2001 - First Quarter Press Release
citigroup April 16, 2001 - First Quarter Press Releasecitigroup April 16, 2001 - First Quarter Press Release
citigroup April 16, 2001 - First Quarter Press Release
 
citigroup July 16, 2001 - Second Quarter Press Release
citigroup July 16, 2001 - Second Quarter Press Releasecitigroup July 16, 2001 - Second Quarter Press Release
citigroup July 16, 2001 - Second Quarter Press Release
 
citigroup October 17, 2001 - Third Quarter Financial Supplement
citigroup October 17, 2001 - Third Quarter  Financial Supplementcitigroup October 17, 2001 - Third Quarter  Financial Supplement
citigroup October 17, 2001 - Third Quarter Financial Supplement
 
citigroup October 17, 2001 - Third Quarter Press Release
citigroup October 17, 2001 - Third Quarter Press Releasecitigroup October 17, 2001 - Third Quarter Press Release
citigroup October 17, 2001 - Third Quarter Press Release
 
citigroup April 15, 2002 - First Quarter Press Release
citigroup April 15, 2002 - First Quarter Press Releasecitigroup April 15, 2002 - First Quarter Press Release
citigroup April 15, 2002 - First Quarter Press Release
 
citigroup October 15, 2002 - Third Quarter Press Release
citigroup October 15, 2002 - Third Quarter Press Releasecitigroup October 15, 2002 - Third Quarter Press Release
citigroup October 15, 2002 - Third Quarter Press Release
 
citigroup Financial Supplement April 18, 2008 - First Quarter
citigroup  Financial Supplement April 18, 2008 - First Quartercitigroup  Financial Supplement April 18, 2008 - First Quarter
citigroup Financial Supplement April 18, 2008 - First Quarter
 
citigroup April 14, 2003 - First Quarter Financial Supplement
citigroup April 14, 2003 - First Quarter Financial Supplementcitigroup April 14, 2003 - First Quarter Financial Supplement
citigroup April 14, 2003 - First Quarter Financial Supplement
 
citigroup April 14, 2003 - First Quarter Press Release
citigroup April 14, 2003 - First Quarter Press Releasecitigroup April 14, 2003 - First Quarter Press Release
citigroup April 14, 2003 - First Quarter Press Release
 

Último

原版1:1复刻温哥华岛大学毕业证Vancouver毕业证留信学历认证
原版1:1复刻温哥华岛大学毕业证Vancouver毕业证留信学历认证原版1:1复刻温哥华岛大学毕业证Vancouver毕业证留信学历认证
原版1:1复刻温哥华岛大学毕业证Vancouver毕业证留信学历认证rjrjkk
 
(办理原版一样)QUT毕业证昆士兰科技大学毕业证学位证留信学历认证成绩单补办
(办理原版一样)QUT毕业证昆士兰科技大学毕业证学位证留信学历认证成绩单补办(办理原版一样)QUT毕业证昆士兰科技大学毕业证学位证留信学历认证成绩单补办
(办理原版一样)QUT毕业证昆士兰科技大学毕业证学位证留信学历认证成绩单补办fqiuho152
 
Role of Information and technology in banking and finance .pptx
Role of Information and technology in banking and finance .pptxRole of Information and technology in banking and finance .pptx
Role of Information and technology in banking and finance .pptxNarayaniTripathi2
 
AnyConv.com__FSS Advance Retail & Distribution - 15.06.17.ppt
AnyConv.com__FSS Advance Retail & Distribution - 15.06.17.pptAnyConv.com__FSS Advance Retail & Distribution - 15.06.17.ppt
AnyConv.com__FSS Advance Retail & Distribution - 15.06.17.pptPriyankaSharma89719
 
Stock Market Brief Deck FOR 4/17 video.pdf
Stock Market Brief Deck FOR 4/17 video.pdfStock Market Brief Deck FOR 4/17 video.pdf
Stock Market Brief Deck FOR 4/17 video.pdfMichael Silva
 
BPPG response - Options for Defined Benefit schemes - 19Apr24.pdf
BPPG response - Options for Defined Benefit schemes - 19Apr24.pdfBPPG response - Options for Defined Benefit schemes - 19Apr24.pdf
BPPG response - Options for Defined Benefit schemes - 19Apr24.pdfHenry Tapper
 
2024 Q1 Crypto Industry Report | CoinGecko
2024 Q1 Crypto Industry Report | CoinGecko2024 Q1 Crypto Industry Report | CoinGecko
2024 Q1 Crypto Industry Report | CoinGeckoCoinGecko
 
Vp Girls near me Delhi Call Now or WhatsApp
Vp Girls near me Delhi Call Now or WhatsAppVp Girls near me Delhi Call Now or WhatsApp
Vp Girls near me Delhi Call Now or WhatsAppmiss dipika
 
GOODSANDSERVICETAX IN INDIAN ECONOMY IMPACT
GOODSANDSERVICETAX IN INDIAN ECONOMY IMPACTGOODSANDSERVICETAX IN INDIAN ECONOMY IMPACT
GOODSANDSERVICETAX IN INDIAN ECONOMY IMPACTharshitverma1762
 
NO1 Certified kala jadu karne wale ka contact number kala jadu karne wale bab...
NO1 Certified kala jadu karne wale ka contact number kala jadu karne wale bab...NO1 Certified kala jadu karne wale ka contact number kala jadu karne wale bab...
NO1 Certified kala jadu karne wale ka contact number kala jadu karne wale bab...Amil baba
 
PMFBY , Pradhan Mantri Fasal bima yojna
PMFBY , Pradhan Mantri  Fasal bima yojnaPMFBY , Pradhan Mantri  Fasal bima yojna
PMFBY , Pradhan Mantri Fasal bima yojnaDharmendra Kumar
 
Economics, Commerce and Trade Management: An International Journal (ECTIJ)
Economics, Commerce and Trade Management: An International Journal (ECTIJ)Economics, Commerce and Trade Management: An International Journal (ECTIJ)
Economics, Commerce and Trade Management: An International Journal (ECTIJ)ECTIJ
 
Economic Risk Factor Update: April 2024 [SlideShare]
Economic Risk Factor Update: April 2024 [SlideShare]Economic Risk Factor Update: April 2024 [SlideShare]
Economic Risk Factor Update: April 2024 [SlideShare]Commonwealth
 
《加拿大本地办假证-寻找办理Dalhousie毕业证和达尔豪斯大学毕业证书的中介代理》
《加拿大本地办假证-寻找办理Dalhousie毕业证和达尔豪斯大学毕业证书的中介代理》《加拿大本地办假证-寻找办理Dalhousie毕业证和达尔豪斯大学毕业证书的中介代理》
《加拿大本地办假证-寻找办理Dalhousie毕业证和达尔豪斯大学毕业证书的中介代理》rnrncn29
 
212MTAMount Durham University Bachelor's Diploma in Technology
212MTAMount Durham University Bachelor's Diploma in Technology212MTAMount Durham University Bachelor's Diploma in Technology
212MTAMount Durham University Bachelor's Diploma in Technologyz xss
 
Governor Olli Rehn: Dialling back monetary restraint
Governor Olli Rehn: Dialling back monetary restraintGovernor Olli Rehn: Dialling back monetary restraint
Governor Olli Rehn: Dialling back monetary restraintSuomen Pankki
 
Call Girls Near Delhi Pride Hotel, New Delhi|9873777170
Call Girls Near Delhi Pride Hotel, New Delhi|9873777170Call Girls Near Delhi Pride Hotel, New Delhi|9873777170
Call Girls Near Delhi Pride Hotel, New Delhi|9873777170Sonam Pathan
 
Financial analysis on Risk and Return.ppt
Financial analysis on Risk and Return.pptFinancial analysis on Risk and Return.ppt
Financial analysis on Risk and Return.ppttadegebreyesus
 

Último (20)

原版1:1复刻温哥华岛大学毕业证Vancouver毕业证留信学历认证
原版1:1复刻温哥华岛大学毕业证Vancouver毕业证留信学历认证原版1:1复刻温哥华岛大学毕业证Vancouver毕业证留信学历认证
原版1:1复刻温哥华岛大学毕业证Vancouver毕业证留信学历认证
 
(办理原版一样)QUT毕业证昆士兰科技大学毕业证学位证留信学历认证成绩单补办
(办理原版一样)QUT毕业证昆士兰科技大学毕业证学位证留信学历认证成绩单补办(办理原版一样)QUT毕业证昆士兰科技大学毕业证学位证留信学历认证成绩单补办
(办理原版一样)QUT毕业证昆士兰科技大学毕业证学位证留信学历认证成绩单补办
 
Role of Information and technology in banking and finance .pptx
Role of Information and technology in banking and finance .pptxRole of Information and technology in banking and finance .pptx
Role of Information and technology in banking and finance .pptx
 
AnyConv.com__FSS Advance Retail & Distribution - 15.06.17.ppt
AnyConv.com__FSS Advance Retail & Distribution - 15.06.17.pptAnyConv.com__FSS Advance Retail & Distribution - 15.06.17.ppt
AnyConv.com__FSS Advance Retail & Distribution - 15.06.17.ppt
 
Stock Market Brief Deck FOR 4/17 video.pdf
Stock Market Brief Deck FOR 4/17 video.pdfStock Market Brief Deck FOR 4/17 video.pdf
Stock Market Brief Deck FOR 4/17 video.pdf
 
🔝+919953056974 🔝young Delhi Escort service Pusa Road
🔝+919953056974 🔝young Delhi Escort service Pusa Road🔝+919953056974 🔝young Delhi Escort service Pusa Road
🔝+919953056974 🔝young Delhi Escort service Pusa Road
 
Q1 2024 Newsletter | Financial Synergies Wealth Advisors
Q1 2024 Newsletter | Financial Synergies Wealth AdvisorsQ1 2024 Newsletter | Financial Synergies Wealth Advisors
Q1 2024 Newsletter | Financial Synergies Wealth Advisors
 
BPPG response - Options for Defined Benefit schemes - 19Apr24.pdf
BPPG response - Options for Defined Benefit schemes - 19Apr24.pdfBPPG response - Options for Defined Benefit schemes - 19Apr24.pdf
BPPG response - Options for Defined Benefit schemes - 19Apr24.pdf
 
2024 Q1 Crypto Industry Report | CoinGecko
2024 Q1 Crypto Industry Report | CoinGecko2024 Q1 Crypto Industry Report | CoinGecko
2024 Q1 Crypto Industry Report | CoinGecko
 
Vp Girls near me Delhi Call Now or WhatsApp
Vp Girls near me Delhi Call Now or WhatsAppVp Girls near me Delhi Call Now or WhatsApp
Vp Girls near me Delhi Call Now or WhatsApp
 
GOODSANDSERVICETAX IN INDIAN ECONOMY IMPACT
GOODSANDSERVICETAX IN INDIAN ECONOMY IMPACTGOODSANDSERVICETAX IN INDIAN ECONOMY IMPACT
GOODSANDSERVICETAX IN INDIAN ECONOMY IMPACT
 
NO1 Certified kala jadu karne wale ka contact number kala jadu karne wale bab...
NO1 Certified kala jadu karne wale ka contact number kala jadu karne wale bab...NO1 Certified kala jadu karne wale ka contact number kala jadu karne wale bab...
NO1 Certified kala jadu karne wale ka contact number kala jadu karne wale bab...
 
PMFBY , Pradhan Mantri Fasal bima yojna
PMFBY , Pradhan Mantri  Fasal bima yojnaPMFBY , Pradhan Mantri  Fasal bima yojna
PMFBY , Pradhan Mantri Fasal bima yojna
 
Economics, Commerce and Trade Management: An International Journal (ECTIJ)
Economics, Commerce and Trade Management: An International Journal (ECTIJ)Economics, Commerce and Trade Management: An International Journal (ECTIJ)
Economics, Commerce and Trade Management: An International Journal (ECTIJ)
 
Economic Risk Factor Update: April 2024 [SlideShare]
Economic Risk Factor Update: April 2024 [SlideShare]Economic Risk Factor Update: April 2024 [SlideShare]
Economic Risk Factor Update: April 2024 [SlideShare]
 
《加拿大本地办假证-寻找办理Dalhousie毕业证和达尔豪斯大学毕业证书的中介代理》
《加拿大本地办假证-寻找办理Dalhousie毕业证和达尔豪斯大学毕业证书的中介代理》《加拿大本地办假证-寻找办理Dalhousie毕业证和达尔豪斯大学毕业证书的中介代理》
《加拿大本地办假证-寻找办理Dalhousie毕业证和达尔豪斯大学毕业证书的中介代理》
 
212MTAMount Durham University Bachelor's Diploma in Technology
212MTAMount Durham University Bachelor's Diploma in Technology212MTAMount Durham University Bachelor's Diploma in Technology
212MTAMount Durham University Bachelor's Diploma in Technology
 
Governor Olli Rehn: Dialling back monetary restraint
Governor Olli Rehn: Dialling back monetary restraintGovernor Olli Rehn: Dialling back monetary restraint
Governor Olli Rehn: Dialling back monetary restraint
 
Call Girls Near Delhi Pride Hotel, New Delhi|9873777170
Call Girls Near Delhi Pride Hotel, New Delhi|9873777170Call Girls Near Delhi Pride Hotel, New Delhi|9873777170
Call Girls Near Delhi Pride Hotel, New Delhi|9873777170
 
Financial analysis on Risk and Return.ppt
Financial analysis on Risk and Return.pptFinancial analysis on Risk and Return.ppt
Financial analysis on Risk and Return.ppt
 

citigroup Financial Supplement Reclassifications for 1Q05

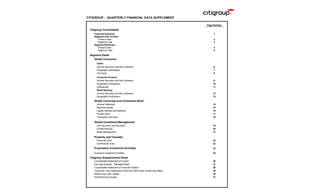
  • 1. CITIGROUP - QUARTERLY FINANCIAL DATA SUPPLEMENT Page Number Citigroup Consolidated Financial Summary 1 Segment Core Income: Product View 2 Regional View 3 Segment Revenues: Product View 4 Regional View 5 Segment Detail Global Consumer: Cards Income Summary and Key Indicators 6 Geographic Distribution 7 Citi Cards 8 Consumer Finance Income Summary and Key Indicators 9 Geographic Distribution 10 Citifinancial 11 Retail Banking Income Summary and Key Indicators 12 Geographic Distribution 13 Global Corporate and Investment Bank: Income Statement 14 Revenue Details 15 Capital Markets and Banking 16 Private Client 17 Transaction Services 18 Global Investment Management: Life Insurance and Annuities 19 Private Banking 20 Asset Management 21 Property and Casualty: Personal Lines 22 Commercial Lines 23 Proprietary Investment Activities 24 Insurance Investment Portfolio 25 Citigroup Supplemental Detail Consolidated Statement of Income 26 Earnings Analysis - Managed Basis 27 Consolidated Statement of Financial Position 28 Consumer Loan Delinquency Amounts, Net Credit Losses and Ratios 29 Reserve for Loan Losses 30 NonPerforming Assets 31
  • 2. CITIGROUP -- FINANCIAL SUMMARY (In millions of dollars, except per share amounts) Citigroup, the preeminent global financial services company with 200 million customer accounts in more than 100 countries, provides consumers, corporations, governments and institutions a complete range of financial products and services. 1Q 2002 vs. 1Q 2Q 3Q 4Q 1Q 1Q 2001 Increase/ 2001 2001 2001 2001 2002 (Decrease) Core Income $3,660 $3,785 $3,262 $3,862 $3,859 5% Restructuring -Related Items (80) (133) (85) 13 (30) Gain on Sale of Stock by Subsidiary - - - - 1,061 Cumulative Effect of Accounting Changes (42) ### (116) ### - ### - (47) Net Income $3,538 $3,536 $3,177 $3,875 $4,843 37% Basic Earnings Per Share: Core Income $0.73 $0.75 $0.64 $0.75 $0.75 3% Net Income $0.70 $0.70 $0.62 $0.75 $0.94 34% Weighted average common shares applicable to Basic EPS 4,984.7 4,979.6 5,060.8 5,101.8 5,110.5 Preferred Dividends - Basic $28 $28 $28 $26 $21 Diluted Earnings Per Share: Core Income $0.71 $0.74 $0.63 $0.74 $0.74 4% Net Income $0.69 $0.69 $0.61 $0.74 $0.93 35% Adjusted weighted average common shares applicable to Diluted EPS 5,110.0 5,100.0 5,169.0 5,209.1 5,209.8 Preferred Dividends - Diluted $28 $28 $28 $26 $21 Common Shares Outstanding, at period end 5,033.7 5,026.1 5,144.2 5,148.7 5,165.4 Tier 1 Capital Ratio 8.56% 8.82% 8.20% 8.42% 9.13% Total Capital Ratio 11.31% 11.49% 10.77% 10.92% 11.59% Leverage Ratio 6.10% 6.17% 5.65% 5.64% 5.89% Total Assets, at period end (in billions) $944.3 $953.4 $1,068.2 $1,051.5 $1,057.7 Stockholders' Equity, at period end (in billions) $68.7 $70.5 $78.4 $81.2 $83.6 Stockholders' Equity and Trust Securities, at period end (in billions) $73.6 $75.1 $85.5 $88.4 $90.3 Book Value Per Share, at period end $13.29 $13.68 $14.90 $15.48 $15.92 Return on Common Equity (Net Income) 21.7% 20.9% 17.1% 19.5% 24.0% Return on Common Equity (Core Income) 22.5% 22.4% 17.5% 19.4% 19.1% Page 1
  • 3. CITIGROUP -- CORE INCOME PRODUCT VIEW (In millions of dollars) 1Q 2002 vs. 1Q 2Q 3Q 4Q 1Q 1Q 2001 Increase/ 2001 2001 2001 2001 2002 (Decrease) Global Consumer: Cards $586 $555 $710 $731 $597 2% Consumer Finance 397 491 549 488 536 35% Retail Banking 563 594 727 720 726 29% Other (41) (29) (24) (54) (47) (15%) Total Global Consumer 1,505 1,611 1,962 1,885 1,812 20% Global Corporate and Investment Bank: Capital Markets and Banking 1,201 1,033 1,006 768 1,029 (14%) Private Client 196 206 182 189 197 1% Transaction Services 91 116 100 113 82 (10%) Other (12) 35 7 24 (22) (83%) Total Global Corporate and Investment Bank 1,476 1,390 1,295 1,094 1,286 (13%) Global Investment Management: Life Insurance and Annuities 215 236 185 200 204 (5%) Private Banking 95 92 91 94 112 18% Asset Management 91 84 104 125 126 38% Total Global Investment Management 401 412 380 419 442 10% Proprietary Investment Activities (1) 6 208 (185) 289 51 NM Corporate / Other (196) (179) (133) (129) (78) 60% Property and Casualty: Personal Lines 95 47 32 60 71 (25%) Commercial Lines 296 302 (127) 281 278 (6%) Realized Insurance Investment Portfolio Gains (Losses) 125 32 63 (10) 19 (85%) Interest and Other (48) (38) (25) (27) (22) 54% Total Property and Casualty 468 343 (57) 304 346 (26%) Total Core Income $3,660 $3,785 $3,262 $3,862 $3,859 5% (1) Includes Realized Insurance Investment Portfolio Gains (Losses) primarily from the Life Insurance and Annuities, and Primerica Financial Services businesses. NM Not meaningful Reclassified to conform to the current period's presentation. Page 2
  • 4. CITIGROUP -- CORE INCOME REGIONAL VIEW (In millions of dollars) 1Q 2002 vs. 1Q 2Q 3Q 4Q 1Q 1Q 2001 Increase/ 2001 2001 2001 2001 2002 (Decrease) North America (excluding Mexico) (1) Consumer $1,005 $1,065 ### $1,238 ### $1,275 $1,215 21% Corporate 731 752 794 542 907 24% Investment Management 327 355 306 328 357 9% Total North America (excluding Mexico) 2,063 2,172 ### 2,338 ### 2,145 2,479 20% Mexico Consumer (14) (13) 112 110 145 NM Corporate 19 22 4 61 98 NM Investment Management 7 10 19 46 48 NM Total Mexico 12 19 ### 135 ### 217 291 NM Western Europe Consumer 104 98 115 130 134 29% Corporate 186 126 85 146 44 (76%) Investment Management 1 1 - 4 (7) NM Total Western Europe 291 225 ### 200 ### 280 171 (41%) Japan Consumer 205 242 259 ### 257 240 17% Corporate 98 4 19 (21) 23 (77%) Investment Management 8 6 9 10 16 100% Total Japan 311 252 ### 287 ### 246 279 (10%) Asia (excluding Japan) Consumer 142 144 157 165 145 2% Corporate 128 225 101 176 175 37% Investment Management 27 14 18 20 27 - Total Asia 297 383 ### 276 ### 361 347 17% Latin America Consumer 49 55 57 (78) (92) NM Corporate 162 155 175 57 (92) NM Investment Management 23 18 22 2 (3) NM Total Latin America 234 228 ### 254 ### (19) (187) NM Central & Eastern Europe, Middle East & Africa Consumer 14 20 24 26 25 79% Corporate 152 106 117 133 131 (14%) Investment Management 8 8 6 9 4 (50%) Total Central & Eastern Europe, Middle East & Africa 174 134 ### 147 ### 168 160 ### (8%) Proprietary Investment Activities 6 208 (185) 289 51 NM Corporate / Other (196) (179) (133) (129) (78) 60% Property and Casualty: Personal Lines 95 47 32 60 71 (25%) Commercial Lines 296 302 (127) 281 278 (6%) Realized Insurance Investment Portfolio Gains (Losses) 125 32 63 (10) 19 (85%) Interest and Other (48) (38) (25) (27) (22) 54% Total Property and Casualty 468 343 (57) 304 346 (26%) Total Core Income $3,660 $3,785 $3,262 $3,862 $3,859 5% (1) Excludes Property and Casualty, Proprietary Investment Activities and Corporate / Other. NM Not meaningful Reclassified to conform to the current period's presentation. Page 3
  • 5. CITIGROUP -- ADJUSTED NET REVENUES PRODUCT VIEW (In millions of dollars) 1Q 2002 vs. 1Q 2Q 3Q 4Q 1Q 1Q 2001 Increase/ 2001 2001 2001 2001 2002 (Decrease) Global Consumer: Cards $3,606 $3,675 $4,032 $4,195 $4,150 15% Consumer Finance 2,153 2,178 2,300 2,237 2,298 7% Retail Banking 2,490 2,568 3,021 3,159 3,335 34% Other 42 120 103 54 35 (17%) Total Global Consumer 8,291 8,541 9,456 9,645 9,818 18% Global Corporate and Investment Bank: Capital Markets and Banking 5,172 4,153 3,868 4,299 4,631 (10%) Private Client 1,549 1,508 1,450 1,433 1,477 (5%) Transaction Services 902 891 856 867 835 (7%) Other (65) (18) (60) (59) (99) (52%) Total Global Corporate and Investment Bank 7,558 6,534 6,114 6,540 6,844 (9%) Global Investment Management: Life Insurance and Annuities 1,170 1,014 972 1,223 1,002 (14%) Private Banking 392 376 366 408 423 8% Asset Management 516 491 546 532 519 1% Total Global Investment Management 2,078 1,881 1,884 2,163 1,944 (6%) Proprietary Investment Activities (1) 41 311 (262) 494 117 NM Corporate / Other (132) (105) (87) (10) 96 NM Property and Casualty: Personal Lines 1,092 1,117 1,137 1,156 1,155 6% Commercial Lines 1,994 2,040 1,992 2,036 2,047 3% Realized Insurance Investment Portfolio Gains (Losses) 192 50 96 (16) 29 (85%) Interest and Other (67) (54) (36) (39) (34) 49% Total Property and Casualty 3,211 3,153 3,189 3,137 3,197 - Total Adjusted Net Revenues $21,047 $20,315 $20,294 $21,969 $22,016 5% (1) Includes Realized Insurance Investment Portfolio Gains (Losses) primarily from the Life Insurance and Annuities, and Primerica Financial Services businesses. NM Not meaningful Reclassified to conform to the current period's presentation. Page 4
  • 6. CITIGROUP -- ADJUSTED NET REVENUES REGIONAL VIEW (In millions of dollars) 1Q 2002 vs. 1Q 2Q 3Q 4Q 1Q 1Q 2001 Increase/ 2001 2001 2001 2001 2002 (Decrease) North America (excluding Mexico) (1) Consumer $5,786 $6,049 $6,406 $6,577 $6,601 14% Corporate 4,634 3,820 3,746 3,923 4,400 (5%) Investment Management 1,613 1,457 1,354 1,587 1,402 (13%) Total North America (excluding Mexico) 12,033 11,326 ### 11,506 ### 12,087 12,403 3% Mexico Consumer 57 72 532 750 753 NM Corporate 84 77 83 205 198 NM Investment Management 46 46 106 212 185 NM Total Mexico 187 195 ### 721 ### 1,167 1,136 NM Western Europe Consumer 564 540 583 607 612 9% Corporate 1,129 1,058 803 956 796 (29%) Investment Management 77 73 75 71 66 (14%) Total Western Europe 1,770 1,671 ### 1,461 ### 1,634 1,474 (17%) Japan Consumer 835 837 880 878 817 (2%) Corporate 192 50 66 16 63 (67%) Investment Management 57 57 58 63 70 23% Total Japan 1,084 944 ### 1,004 ### 957 950 ### (12%) Asia (excluding Japan) Consumer 548 545 559 571 557 2% Corporate 557 651 509 564 569 2% Investment Management 107 81 85 99 103 (4%) Total Asia 1,212 1,277 ### 1,153 ### 1,234 1,229 1% Latin America Consumer 366 357 350 114 322 (12%) Corporate 473 456 492 447 387 (18%) Investment Management 139 131 171 91 80 (42%) Total Latin America 978 944 ### 1,013 ### 652 789 (19%) Central & Eastern Europe, Middle East & Africa Consumer 135 141 146 148 156 16% Corporate 489 422 415 429 431 (12%) Investment Management 39 36 35 40 38 (3%) Total Central & Eastern Europe, Middle East & Africa 663 599 ### 596 ### 617 625 (6%) Proprietary Investment Activities 41 311 (262) 494 117 NM Corporate / Other (132) (105) (87) (10) 96 NM Property and Casualty: Personal Lines 1,092 1,117 1,137 1,156 1,155 6% Commercial Lines 1,994 2,040 1,992 2,036 2,047 3% Realized Insurance Investment Portfolio Gains (Losses) 192 50 96 (16) 29 (85%) Interest and Other (67) (54) (36) (39) (34) 49% Total Property and Casualty 3,211 3,153 ### 3,189 ### 3,137 3,197 - Total Adjusted Net Revenues $21,047 $20,315 $20,294 $21,969 $22,016 5% (1) Excludes Property and Casualty, Proprietary Investment Activities and Corporate / Other. NM- Not meaningful Page 5
  • 7. GLOBAL CONSUMER CARDS (In millions of dollars) 1Q 2002 vs. 1Q 2Q 3Q 4Q 1Q 1Q 2001 Increase/ 2001 2001 2001 2001 2002 (Decrease) Adjusted Revenues, Net of Interest Expense (1) $3,606 $3,675 $4,032 $4,195 $4,150 15% Adjusted Operating Expenses 1,355 1,314 1,361 1,398 1,321 (3%) Adjusted Provision for Credit Losses (1) 1,322 1,482 1,552 1,694 1,911 45% Core Income Before Taxes 929 879 1,119 1,103 918 (1%) Income Taxes 343 324 409 372 321 (6%) Core Income $586 $555 $710 $731 $597 2% Managed Average Assets (in billions of dollars) $117 $118 $122 $123 $123 5% Return on Managed Assets 2.03% 1.89% 2.31% 2.36% 1.97% KEY INDICATORS: (in billions of dollars) Total EOP Open Accounts (in millions): North America 95.5 95.5 97.3 96.8 95.5 - International 11.3 12.0 12.4 12.9 12.9 14% Total 106.8 107.5 109.7 109.7 108.4 1% Total Sales: North America $54.8 $59.0 $58.5 $60.9 $54.9 - International 7.7 8.2 8.2 8.3 7.7 - Total $62.5 $67.2 $66.7 $69.2 $62.6 - Average Managed Loans: North America $102.2 $102.4 $105.9 $107.6 $107.6 5% International 9.5 9.8 10.4 10.4 10.2 7% Total $111.7 $112.2 $116.3 $118.0 $117.8 5% Managed Net Credit Losses (in millions of dollars): North America $1,217 $1,401 $1,448 $1,589 $1,681 38% International 90 102 100 104 112 24% Total $1,307 $1,503 $1,548 $1,693 $1,793 37% End of Period Managed Receivables $111.9 $116.0 $119.5 $122.6 $118.9 6% Net Credit Loss Ratio 4.74% 5.37% 5.28% 5.69% 6.17% Loans 90+Days Past Due: In millions of dollars $2,001 $1,938 $2,119 $2,384 $2,488 24% % 1.80% 1.68% 1.79% 1.96% 2.11% (1) On a managed basis. NM Not meaningful Reclassified to conform to the current period's presentation. Page 6
  • 8. GLOBAL CONSUMER CARDS GEOGRAPHIC DISTRIBUTION (In millions of dollars) 1Q 2002 vs. 1Q 2Q 3Q 4Q 1Q 1Q 2001 Increase/ 2001 2001 2001 2001 2002 (Decrease) GEOGRAPHIC DISTRIBUTION North America Adjusted Revenues, Net of Interest Expense (1) $3,047 $3,130 $3,470 $3,738 $3,609 18% Adjusted Operating Expenses 1,058 1,024 1,082 1,122 1,040 (2%) Adjusted Provision for Credit Losses (1) 1,229 1,379 1,449 1,589 1,681 37% Core Income Before Taxes 760 727 939 1,027 888 17% Income Taxes 283 271 348 349 320 13% Core Income $477 $456 $591 $678 $568 19% Managed Average Assets (in billions of dollars) $107 $107 $111 $112 $112 5% Return on Managed Assets 1.81% 1.71% 2.11% 2.40% 2.06% International Total Revenues, Net of Interest Expense $559 $545 $562 $457 $541 (3%) Adjusted Operating Expenses 297 290 279 276 281 (5%) Provision for Credit Losses 93 103 103 105 230 NM Core Income Before Taxes 169 152 180 76 30 (82%) Income Taxes 60 53 61 23 1 (98%) Core Income $109 $99 $119 $53 $29 (73%) Average Assets (in billions of dollars) $10 $11 $11 $11 $11 10% Return on Assets 4.42% 3.61% 4.29% 1.91% 1.07% (1) On a managed basis. NM Not meaningful Reclassified to conform to the current period's presentation. Page 7
  • 9. GLOBAL CONSUMER CARDS CitiCards - Supplemental Data (In millions of dollars) 1Q 2002 vs. 1Q 2Q 3Q 4Q 1Q 1Q 2001 Increase/ 2001 2001 2001 2001 2002 (Decrease) CitiCards and Diners Club: Adjusted Revenues, Net of Interest Expense $3,012 $3,085 $3,340 $3,548 $3,438 14% Adjusted Operating Expenses 1,040 1,002 1,002 1,019 953 (8%) Adjusted Provision for Credit Losses 1,221 1,371 1,434 1,567 1,659 36% Core Income Before Taxes 751 712 904 962 826 10% Income Taxes 279 264 338 339 306 10% Core Income $472 $448 $566 $623 $520 10% Managed Average Assets (in billions of dollars) $106 $106 $109 $110 $110 4% Return on Managed Assets 1.81% 1.70% 2.06% 2.25% 1.92% CitiCards (1): KEY INDICATORS: (in billions of dollars) Net Interest Revenue (in millions of dollars) (2) $2,379 $2,421 $2,696 $2,904 $2,767 16% % of Average Managed Loans 9.63% 9.65% 10.38% 11.04% 10.77% Risk Adjusted Revenue (in millions of dollars) (3) $1,716 $1,613 $1,838 $1,909 $1,705 (1%) % of Average Managed Loans 6.95% 6.43% 7.08% 7.25% 6.64% Adjusted Operating Expenses as % of Average Managed Loans 3.93% 3.73% 3.61% 3.50% 3.48% End of Period Managed Receivables $100.5 $103.9 $105.6 $108.9 $105.4 5% Total EOP Open Accounts (in millions) 93.2 94.1 93.4 92.9 91.6 (2%) Total Sales $51.2 $55.6 $55.0 $56.7 $50.8 (1%) End of Period Loans: On Balance Sheet $32.6 $32.6 $33.0 $34.2 $31.8 (2%) Securitized 60.1 61.4 65.2 67.0 65.9 10% Held for Sale 7.0 9.0 6.5 6.5 6.5 (7%) Total $99.7 $103.0 $104.7 $107.7 $104.2 5% Average Loans: On Balance Sheet $34.7 $33.5 $33.5 $33.0 $30.9 (11%) Securitized 58.5 59.7 61.3 64.9 66.8 14% Held for Sale 7.0 7.4 8.2 6.5 6.5 (7%) Total $100.2 $100.6 $103.0 $104.4 $104.2 4% Net Credit Losses (in millions of dollars): On Balance Sheet $465 $481 $541 $615 $633 36% Securitized 668 812 790 870 935 40% Held for Sale 63 90 92 69 78 24% Total $1,196 $1,383 $1,423 $1,554 $1,646 38% Coincident Net Credit Loss Ratio 4.84% 5.51% 5.48% 5.91% 6.41% 12 Month Lagged Net Credit Loss Ratio 5.72% 6.29% 5.96% 6.23% 6.66% Loans 90+ Days Past Due: In millions of dollars $1,836 $1,775 $1,908 $2,135 $2,219 21% % 1.84% 1.72% 1.82% 1.98% 2.13% (1) CitiCards is included within the North American Region of Cards and excludes Diners Club, Mexico and Puerto Rico. (2) Includes delinquency and other risk-based charges. (3) Risk Adjusted Revenue is adjusted revenues less managed net credit losses. NM Not meaningful Reclassified to conform to the current period's presentation. Page 8
  • 10. GLOBAL CONSUMER CONSUMER FINANCE (In millions of dollars) 1Q 2002 vs. 1Q 2Q 3Q 4Q 1Q 1Q 2001 Increase/ 2001 2001 2001 2001 2002 (Decrease) Adjusted Revenues, Net of Interest Expense $2,153 $2,178 $2,300 $2,237 $2,298 7% Adjusted Operating Expenses 922 813 812 755 728 (21%) Adjusted Provision for Credit Losses 603 594 623 709 737 22% Core Income Before Taxes 628 771 865 773 833 33% Income Taxes 231 280 316 285 297 29% Core Income $397 $491 $549 $488 $536 35% Average Assets (in billions of dollars) $82 $83 $85 $86 $87 6% Return on Assets 1.96% 2.37% 2.56% 2.25% 2.50% KEY INDICATORS Average Loans (in billions of dollars): Real estate secured loans $43.1 $43.4 $44.5 $45.3 $45.5 6% Personal loans 18.7 18.9 19.4 19.6 19.2 3% Auto 3.8 4.4 4.9 5.4 5.7 50% Sales finance and other 3.5 3.5 3.5 3.5 3.0 (14%) Total $69.1 $70.2 $72.3 $73.8 $73.4 6% Average Loans (in billions of dollars): North America $56.2 $57.0 $58.2 $59.2 $59.8 6% International 12.9 13.2 14.1 14.6 13.6 5% Total $69.1 $70.2 $72.3 $73.8 $73.4 6% Average Yield: North America 14.05% 13.86% 13.53% 13.20% 13.18% International 27.25% 25.36% 24.83% 23.07% 22.43% Total 16.50% 16.02% 15.73% 15.14% 14.93% Average Net Interest Margin: North America 7.92% 8.18% 8.31% 8.36% 8.57% International 23.78% 22.10% 21.78% 20.84% 20.59% Total 10.87% 10.79% 10.93% 10.83% 10.84% Net Credit Loss Ratio 2.99% 2.91% 2.94% 3.54% 3.63% Loans 90+ Days Past Due: In millions of dollars $1,764 $1,943 $2,134 $2,243 $2,213 25% % 2.54% 2.74% 2.89% 3.04% 2.97% Number of Offices: North America 2,576 2,484 2,468 2,413 2,394 (7%) International 1,180 1,183 1,174 1,150 1,141 (3%) Total 3,756 3,667 3,642 3,563 3,535 (6%) NM Not meaningful Reclassified to conform to the current period's presentation. Page 9
  • 11. GLOBAL CONSUMER CONSUMER FINANCE GEOGRAPHIC DISTRIBUTION (In millions of dollars) 1Q 2002 vs. 1Q 2Q 3Q 4Q 1Q 1Q 2001 Increase/ 2001 2001 2001 2001 2002 (Decrease) GEOGRAPHIC DISTRIBUTION North America Adjusted Revenues, Net of Interest Expense $1,366 $1,388 $1,476 $1,457 $1,539 13% Adjusted Operating Expenses 593 523 515 470 503 (15%) Adjusted Provision for Benefits, Claims, and Credit Losses 415 419 439 504 509 23% Core Income Before Taxes 358 446 522 483 527 47% Income Taxes 134 164 195 181 193 44% Core Income $224 $282 $327 $302 $334 49% Average Assets (in billions of dollars) $65 $67 $68 $68 $69 6% Return on Assets 1.40% 1.69% 1.91% 1.76% 1.96% International Total Revenues, Net of Interest Expense $787 $790 $824 $780 $759 (4%) Adjusted Operating Expenses 329 290 297 285 225 (32%) Provision for Benefits, Claims, and Credit Losses 188 ### 175 184 205 228 21% Core Income Before Taxes 270 325 343 290 306 13% Income Taxes 97 116 121 104 104 7% Core Income $173 $209 $222 $186 $202 17% Average Assets (in billions of dollars) $17 $16 $17 $18 $18 6% Return on Assets 4.13% 5.24% 5.18% 4.10% 4.55% NM Not meaningful Reclassified to conform to the current period's presentation. Page 10
  • 12. GLOBAL CONSUMER CONSUMER FINANCE CITIFINANCIAL (1) (In millions of dollars) 1Q 2002 vs. 1Q 2Q 3Q 4Q 1Q 1Q 2001 Increase/ 2001 2001 2001 2001 2002 (Decrease) Adjusted Revenues, Net of Interest Expense $1,330 $1,346 $1,430 $1,405 $1,479 11% Adjusted Operating Expenses 569 502 492 443 475 (17%) Adjusted Provision for Benefits, Claims, and Credit Losses 408 412 431 495 500 23% Core Income Before Taxes 353 432 507 467 504 43% Income Taxes 133 157 190 174 184 38% Core Income $220 $275 $317 $293 $320 45% Average Assets (in billions of dollars) $64 $66 $67 $67 $68 6% Return on Assets 1.39% 1.67% 1.88% 1.73% 1.91% KEY INDICATORS: (in billions of dollars) Average Net Receivables (in billions of dollars): Real estate secured loans - Other $34.5 $34.2 $34.1 $33.9 $33.3 (3%) Real estate secured loans - PFS Sourced 5.4 6.1 6.8 7.5 8.2 52% Personal loans 9.7 9.7 9.6 9.6 9.6 (1%) Auto 3.5 4.1 4.6 5.1 5.4 54% Sales finance and other 2.6 2.4 2.6 2.6 2.7 4% Total $55.7 $56.5 $57.7 $58.7 $59.2 6% Number of offices 2,430 2,336 2,320 2,221 2,199 (10%) Average yield 13.87% 13.65% 13.30% 12.95% 13.07% Average net interest margin 7.76% 7.98% 8.09% 8.13% 8.41% Net credit loss ratio 2.50% 2.46% 2.45% 3.06% 2.97% Loans 90+ Days Past Due: In millions of dollars $1,580 $1,751 $1,898 $1,991 $1,969 25% % 2.82% 3.07% 3.25% 3.38% 3.30% (1) CitiFinancial is included within the North American Region of Consumer Finance and excludes Mexico and Puerto Rico. NM Not meaningful Reclassified to conform to the current period's presentation. Page 11
  • 13. GLOBAL CONSUMER RETAIL BANKING (In millions of dollars) 1Q 2002 vs. 1Q 2Q 3Q 4Q 1Q 1Q 2001 Increase/ 2001 2001 2001 2001 2002 (Decrease) Total Revenues, Net of Interest Expense $2,490 $2,568 $3,021 $3,159 $3,335 34% Adjusted Operating Expenses 1,373 1,397 1,594 1,741 1,773 29% Provision for Benefits, Claims and Credit Losses 237 230 291 303 435 84% Core Income Before Taxes and Minority Interest 880 941 1,136 1,115 1,127 28% Income Taxes 312 340 403 386 391 25% Minority Interest, net of tax 5 7 6 9 10 100% Core Income $563 $594 $727 $720 $726 29% Average Assets (in billions of dollars) $119 $119 $152 $167 $173 45% Return on Assets 1.92% 2.00% 1.90% 1.71% 1.70% KEY INDICATORS (in billions of dollars) Owned and Serviced Average Loans (in billion of dollars): North America $53.8 $54.7 $63.8 $66.8 $68.9 28% International 37.9 37.1 37.8 37.7 36.7 (3%) Average Loans (1) $91.7 $91.8 $101.6 $104.5 $105.6 15% Average Customer Deposits (in billions of dollars) North America $53.0 $53.8 $80.7 $85.5 $89.4 69% International 78.6 78.4 79.3 78.6 77.5 (1%) Total $131.6 $132.2 $160.0 $164.1 $166.9 27% EOP Accounts (in millions) North America 11.8 11.9 22.3 21.8 21.9 86% International 18.3 18.5 18.8 18.9 19.0 4% Total 30.1 30.4 41.1 40.7 40.9 36% Branches North America 577 576 2,019 1,945 1,950 NM International 897 906 907 913 909 1% Total 1,474 1,482 2,926 2,858 2,859 94% ATM-only locations North America 153 156 162 165 165 8% International 300 320 380 382 392 31% Total 453 476 542 547 557 23% Proprietary ATMs North America 2,331 2,320 6,554 6,574 6,652 NM International 2,059 2,101 2,178 2,195 2,197 7% Total 4,390 4,421 8,732 8,769 8,849 NM Net Credit Loss Ratio 0.55% 0.53% 0.72% 0.78% 0.78% Loans 90+Days Past Due: In millions of dollars $2,270 $2,475 $3,316 $3,437 $3,481 % 2.48% 2.71% 3.19% 3.30% 3.34% Primerica Financial Services: Agents Licensed for Life Insurance 88,907 93,998 93,156 95,679 98,272 11% Life Insurance in Force (in billions of dollars) $415.4 $422.9 $427.7 $434.8 $441.3 6% Total Mutual Fund Sales (in millions of dollars) $993.8 $868.3 $776.5 $770.2 $936.8 (6%) Cash advanced on Loans (in millions of dollars) (2) $694.5 $1,091.9 $1,006.1 $1,077.3 $1,253.8 81% Variable Annuity Net Written Premiums & Deposits (in millions of dollars) $247.6 $237.1 $222.1 $217.2 $224.9 (9%) (1) Includes loans held for sale. (2) Represents loan products marketed by PFS; the receivables are primarily reflected in the assets of Consumer Finance. NM Not meaningful Page 12
  • 14. GLOBAL CONSUMER RETAIL BANKING GEOGRAPHIC AND BUSINESS DISTRIBUTION (In millions of dollars) 1Q 2002 vs. 1Q 2Q 3Q 4Q 1Q 1Q 2001 Increase/ 2001 2001 2001 2001 2002 (Decrease) REVENUES: North America: Citibanking North America $637 $692 $740 $762 $796 25% Consumer Assets 239 265 257 261 299 25% Primerica Financial Services 490 497 493 499 512 4% Mexico 24 28 399 554 565 NM Total North America Retail Banking $1,390 $1,482 $1,889 $2,076 $2,172 56% International: Western Europe $389 $373 $397 $406 $416 7% Japan 106 109 114 106 104 (2%) Asia (excluding Japan) 319 319 323 336 327 3% Latin America 205 200 210 148 224 9% CEEMEA 81 85 88 87 92 14% Total International Retail Banking 1,100 1,086 1,132 1,083 1,163 6% Total Retail Banking $2,490 $2,568 $3,021 $3,159 $3,335 34% CORE INCOME: North America: Citibanking North America $152 $152 $155 $180 $192 26% Consumer Assets 75 86 90 92 93 24% Primerica Financial Services 125 128 125 134 128 2% Mexico (19) (22) 85 53 90 NM Total North America Retail Banking $333 $344 $455 $459 $503 51% International: Western Europe $70 $69 $78 $88 $93 33% Japan 31 34 38 35 33 6% Asia (excluding Japan) 99 104 105 112 104 5% Latin America 22 30 35 9 (19) NM CEEMEA 8 13 16 17 12 50% Total International Retail Banking 230 250 272 261 223 (3%) Total Retail Banking $563 $594 $727 $720 $726 29% NM Not meaningful Page 13
  • 15. GLOBAL CORPORATE AND INVESTMENT BANK INCOME STATEMENT (In millions of dollars) 1Q 2002 vs. 1Q 2Q 3Q 4Q 1Q 1Q 2001 Increase/ 2001 2001 2001 2001 2002 (Decrease) Revenues: Commissions and Fees $1,402 $1,320 $1,218 $1,260 $1,363 (3%) Asset Management and Administration Fees 704 682 695 636 675 (4%) Investment Banking 1,239 1,138 929 1,210 1,043 (16%) Principal Transactions 2,077 1,268 812 684 1,360 (35%) Other Income 290 139 445 138 (8) NM Total Non-Interest Revenues 5,712 4,547 4,099 3,928 4,433 (22%) Net Interest and Dividends 1,846 1,987 2,015 2,612 2,411 31% Total Revenues, Net of Interest Expense 7,558 6,534 6,114 6,540 6,844 (9%) Non-Interest Expenses: Compensation and Benefits 3,333 2,748 2,518 2,754 3,014 (10%) Other Operating and Administrative Expenses 1,630 1,339 1,350 1,419 1,180 (28%) Total Non-Interest Expenses 4,963 4,087 3,868 4,173 4,194 (15%) Provision for Credit Losses 277 288 217 682 680 NM Core Income Before Taxes and Minority Interest 2,318 2,159 2,029 1,685 1,970 (15%) Income Taxes and Minority Interest, Net of Tax 842 769 734 591 684 (19%) Core Income $1,476 $1,390 $1,295 $1,094 $1,286 (13%) Pre-tax Profit Margin 30.7% 33.0% 33.2% 25.8% 28.8% Non-Compensation Expenses as a Percent of Net Revenues 21.6% 20.5% 22.1% 21.7% 17.2% Compensation and Benefits Expenses as a Percent of Net Revenues 44.1% 42.1% 41.2% 42.1% 44.0% NM Not meaningful Reclassified to conform to the current period's presentation. Page 14
  • 16. GLOBAL CORPORATE AND INVESTMENT BANK REVENUE DETAILS (In millions of dollars) 1Q 2002 vs. 1Q 2Q 3Q 4Q 1Q 1Q 2001 Increase/ 2001 2001 2001 2001 2002 (Decrease) Investment Banking Revenue: Underwriting $657 $656 $522 $587 $691 5% Advisory and Other Fees 582 482 407 623 352 (40%) Total Investment Banking Revenues $1,239 $1,138 $929 $1,210 $1,043 (16%) Trading Related Revenue by Product: Fixed Income $1,299 $969 $800 $1,016 $1,398 8% Equities 472 214 101 95 147 (69%) Foreign Exchange 365 399 295 458 467 28% All Other 64 47 38 48 77 20% Total Trading Related Revenue $2,200 $1,629 $1,234 $1,617 $2,089 (5%) Trading Related Revenue by Income Statement Line: Principal Transactions $2,077 $1,268 $812 $684 $1,360 (35%) Net Interest Revenue 123 361 422 933 729 NM Total Trading Related Revenue $2,200 $1,629 $1,234 $1,617 $2,089 (5%) NM Not meaningful Reclassified to conform to the current period's presentation. Page 15
  • 17. GLOBAL CORPORATE AND INVESTMENT BANK CAPITAL MARKETS AND BANKING (In millions of dollars) 1Q 2002 vs. 1Q 2Q 3Q 4Q 1Q 1Q 2001 Increase/ 2001 2001 2001 2001 2002 (Decrease) Total Revenues, Net of Interest Expense $5,172 $4,153 $3,868 $4,299 $4,631 (10%) Adjusted Operating Expenses 2,984 2,227 2,089 2,441 2,435 (18%) Provision for Credit Losses 270 286 212 671 611 NM Core Income Before Taxes 1,918 1,640 1,567 1,187 1,585 (17%) Income Taxes 717 607 561 419 556 (22%) Core Income $1,201 $1,033 $1,006 $768 $1,029 (14%) Investment Banking Underwriting (full credit to book manager): Debt and equity: Global Volume (1) $130,992 $118,924 $95,712 $150,496 $132,098 1% Global Market Share 12.2% 11.0% 10.8% 14.2% 11.6% Rank 2 2 1 1 1 U.S. Volume (2) $99,735 $94,938 $80,201 $127,913 $109,423 10% U.S. Market Share 14.1% 12.5% 11.8% 16.6% 13.5% Rank 2 2 1 1 1 (1) Includes non-convertible debt, Rule 144A non-convertible debt, Rule 144A non-convertible preferred, non-convertible preferred, preferred, taxable municipal debt, mortgage and asset backed debt, all common stock, convertible debt and convertible preferred. Excludes all closed end funds. (2) Includes all U.S. mortgage and asset backed debt, U.S. non-convertible debt, U.S. Rule 144A non-convertible and U.S. taxable municipal debt, all U.S. common stock, U.S. convertible debt and U.S. convertible preferred. Excludes all closed end funds, 144A common stock, 144A convertible stock, and 144A convertible preferred. NM Not meaningful Page 16
  • 18. GLOBAL CORPORATE AND INVESTMENT BANK PRIVATE CLIENT (In millions of dollars) 1Q 2002 vs. 1Q 2Q 3Q 4Q 1Q 1Q 2001 Increase/ 2001 2001 2001 2001 2002 (Decrease) Total Revenues, Net of Interest Expense $1,549 $1,508 $1,450 $1,433 $1,477 (5%) Adjusted Operating Expenses 1,235 1,179 1,157 1,130 1,165 (6%) Provision for Credit Losses - (1) 3 2 - - Core Income Before Taxes 314 330 290 301 312 (1%) Income Taxes 118 124 108 112 115 (3%) Core Income $196 $206 $182 $189 $197 1% Private Client Financial Consultants 12,675 12,802 12,963 12,927 12,767 1% Annualized Revenue per FC (000) $501 $473 $450 $440 $473 (6%) Branch offices 530 530 538 536 536 1% Salomon Smith Barney Client Assets (in billions of dollars) Assets Under Fee-Based Management Consulting Group and Internally Managed Accounts $134.4 $149.3 $134.9 $150.2 $154.3 15% Financial Consultant Managed Accounts 51.9 57.0 49.4 54.9 55.2 6% Total (1) $186.3 $206.3 $184.3 $205.1 $209.5 12% Total Client Assets $911 $981 $905 $977 $994 9% U.S. Bank Deposit Program $17.7 $25.4 $30.9 $35.6 $37.5 NM (1) Includes some assets jointly managed with Citigroup Asset Management. NM Not meaningful Page 17
  • 19. GLOBAL CORPORATE AND INVESTMENT BANK TRANSACTION SERVICES (In millions of dollars) 1Q 2002 vs. 1Q 2Q 3Q 4Q 1Q 1Q 2001 Increase/ 2001 2001 2001 2001 2002 (Decrease) Total Revenues, Net of Interest Expense $902 $891 $856 $867 $835 (7%) Adjusted Operating Expenses 749 698 697 684 642 (14%) Provision for Credit Losses 7 3 2 9 69 NM Core Income Before Taxes 146 190 157 174 124 (15%) Income Taxes 55 71 55 59 41 (25%) Minority Interest, net of tax - 3 2 2 1 Core Income $91 $116 $100 $113 $82 (10%) Liability Balances (Average in billions) $74 $75 $79 $80 $82 11% Assets Under Custody (EOP in trillions) $4.2 $4.5 $4.6 $4.8 $5.2 24% NM Not meaningful Reclassified to conform to the current period's presentation. Page 18