Weekly market report
•
0 likes•473 views

The Qatar Exchange Index gained 4.39% over the week to close at 12,919.63 points. Trading value decreased 21% to QR2.7bn while volume fell 19.7% to 68.8mn shares. QNB Group reported a 7% YoY rise in 1H2014 net profit to QR5.1bn, driven by a 6% increase in net interest income. Ahli Bank's 2Q2014 net profit was flat QoQ but grew 12% YoY. GISS announced a QR1.6bn contract extension for four onshore rigs through 2Q2019, raising its price target to QR129 per share.

Recommended
More Related Content
What's hot
What's hot (20)
Similar to Weekly market report
Similar to Weekly market report (20)
More from QNB Group
More from QNB Group (20)
Recently uploaded
Recently uploaded (20)
Weekly market report
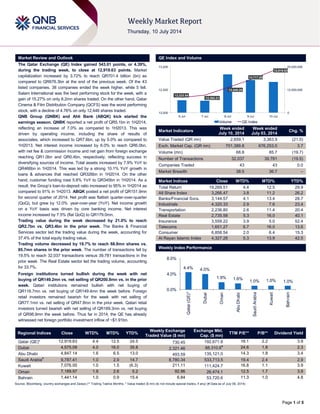
- 1. Page 1 of 5 Market Review and Outlook QE Index and Volume The Qatar Exchange (QE) Index gained 543.01 points, or 4.39%, during the trading week, to close at 12,919.63 points. Market capitalization increased by 3.72% to reach QR701.4 billion (bn) as compared to QR676.3bn at the end of the previous week. Of the 43 listed companies, 38 companies ended the week higher, while 5 fell. Salam International was the best performing stock for the week, with a gain of 15.27% on only 8.2mn shares traded. On the other hand, Qatar Cinema & Film Distribution Company (QCFS) was the worst performing stock, with a decline of 4.76% on only 12,446 shares traded. QNB Group (QNBK) and Ahli Bank (ABQK) kick started the earnings season. QNBK reported a net profit of QR5.1bn in 1H2014, reflecting an increase of 7.0% as compared to 1H2013. This was driven by operating income, including the share of results of associates, which increased to QR7.6bn, up by 5.0% as compared to 1H2013. Net interest income increased by 6.0% to reach QR6.0bn, with net fee & commission income and net gain from foreign exchange reaching QR1.0bn and QR0.4bn, respectively, reflecting success in diversifying sources of income. Total assets increased by 7.9% YoY to QR466bn in 1H2014. This was led by a strong 10.1% YoY growth in loans & advances that reached QR326bn in 1H2014. On the other hand, customer funding rose 5.8% YoY to QR345bn in 1H2014. As a result, the Group’s loan-to-deposit ratio increased to 95% in 1H2014 as compared to 91% in 1H2013. ABQK posted a net profit of QR151.9mn for second quarter of 2014. Net profit was flattish quarter-over-quarter (QoQ), but grew by 12.0% year-over-year (YoY). Net income growth on a YoY basis was driven by core banking income. Net interest income increased by 7.5% (flat QoQ) to QR179.0mn. Trading value during the week decreased by 21.0% to reach QR2.7bn vs. QR3.4bn in the prior week. The Banks & Financial Services sector led the trading value during the week, accounting for 37.4% of the total equity trading value. Trading volume decreased by 19.7% to reach 68.8mn shares vs. 85.7mn shares in the prior week. The number of transactions fell by 19.5% to reach 32,037 transactions versus 39,781 transactions in the prior week. The Real Estate sector led the trading volume, accounting for 33.7%. Foreign institutions turned bullish during the week with net buying of QR149.2mn vs. net selling of QR200.8mn vs. in the prior week. Qatari institutions remained bullish with net buying of QR116.7mn vs. net buying of QR149.4mn the week before. Foreign retail investors remained bearish for the week with net selling of QR77.1mn vs. net selling of QR47.8mn in the prior week. Qatari retail investors turned bearish with net selling of QR189.3mn vs. net buying of QR98.9mn the week before. Thus far in 2014, the QE has already witnessed net foreign portfolio investment inflow of ~$1.91bn. Market Indicators Week ended July 10, 2014 Week ended July 03, 2014 Chg. % Value Traded (QR mn) 2,659.1 3,363.9 (21.0) Exch. Market Cap. (QR mn) 701,389.8 676,253.0 3.7 Volume (mn) 68.8 85.7 (19.7) Number of Transactions 32,037 39,781 (19.5) Companies Traded 43 43 0.0 Market Breadth 38:5 36:7 – Market Indices Close WTD% MTD% YTD% Total Return 19,269.51 4.4 12.5 29.9 All Share Index 3,266.47 3.8 11.2 26.2 Banks/Financial Svcs. 3,144.57 4.1 13.4 28.7 Industrials 4,320.33 2.9 7.6 23.4 Transportation 2,236.80 2.6 11.4 20.4 Real Estate 2,735.58 5.3 16.0 40.1 Insurance 3,559.22 3.9 5.0 52.4 Telecoms 1,651.27 6.7 16.0 13.6 Consumer 6,858.54 2.0 6.4 15.3 Al Rayan Islamic Index 4,327.28 5.3 13.9 42.5 Market Indices Weekly Index Performance Regional Indices Close WTD% MTD% YTD% Weekly Exchange Traded Value ($ mn) Exchange Mkt. Cap. ($ mn) TTM P/E** P/B** Dividend Yield Qatar (QE)* 12,919.63 4.4 12.5 24.5 730.45 192,671.8 16.1 2.2 3.9 Dubai 4,575.09 4.0 16.0 35.8 2,321.46 88,310.6# 24.6 1.8 2.3 Abu Dhabi 4,847.14 1.6 6.5 13.0 493.59 135,121.0 14.3 1.8 3.4 Saudi Arabia# 9,787.41 1.0 2.9 14.7 8,780.34 533,713.5 19.4 2.4 2.9 Kuwait 7,076.00 1.0 1.5 (6.3) 211.11 111,424.7 16.8 1.1 3.9 Oman 7,189.97 1.9 2.6 5.2 92.96 26,474.1 12.5 1.7 3.9 Bahrain 1,441.14 1.0 0.9 15.4 6.84 53,720.6 11.3 1.0 4.8 Source: Bloomberg, country exchanges and Zawya (** Trailing Twelve Months; * Value traded ($ mn) do not include special trades, if any) (# Data as of July 09, 2014) 12,333.54 12,382.21 12,549.28 12,717.00 12,919.63 0 12,500,000 25,000,000 12,000 12,500 13,000 6-Jul 7-Jul 8-Jul 9-Jul 10-Jul Volume QE Index 4.4% 4.0% 1.9% 1.6% 1.0% 1.0% 1.0% 0.0% 4.0% 8.0% Qatar(QE)* Dubai Oman AbuDhabi SaudiArabia Kuwait Bahrain
- 2. Page 2 of 5 News Market & Corporate News QNBK delivers strong 1H2014 results, net profit surges 7% YoY – The QNB Group (QNBK) reported a net profit of QR5.1bn in 1H2014, reflecting an increase of 7.0% as compared to 1H2013. This was driven by operating income, including the share of results of associates, which increased to QR7.6bn, up by 5.0% as compared to 1H2013. Net interest income increased by 6.0% to reach QR6.0bn, with net fee & commission income and net gain from foreign exchange reaching QR1.0bn and QR0.4bn, respectively, reflecting success in diversifying sources of income. The Group’s prudent cost control policy and strong revenue generating capabilities allowed it to maintain its efficiency ratio at 21.5% in 1H2014, marginally up from 20.5% in 1H2013. Earnings per share stood at QR7.2 in 1H2014 as compared to QR6.8 in 1H2013. Total assets increased 7.9% YoY to QR466bn in 1H2014 –yet again scaling the highest ever level achieved by the Group. This was led by a strong 10.1% YoY growth in loans & advances that reached QR326bn in 1H2014. On the other hand, customer funding rose 5.8% YoY to QR345bn in 1H2014. As a result, the Group’s loan-to-deposit ratio increased to 95% in 1H2014 as compared to 91% in 1H2013. The Group continued to maintain strong asset quality as reflected by its NPL ratio that stood at 1.6% in 1H2014 (1.5% in 1H2013), one of the lowest among the banks in the Middle East and Africa. The low NPL ratio reflects high quality of QNBK’s loan book coupled with effective credit risk management. The Group’s conservative policy in regard to provisioning continued with the coverage ratio reaching 123% in June 2014. QNBK’s total shareholders' equity increased to QR54bn in 1H2014, up by 10.4% from June 2013. The Group’s Capital Adequacy Ratio, on a Basel III basis, stood at 15.9% as at 30 June 2014, higher than the minimum regulatory requirements of the Qatar Central Bank. (QNB Press Release) Woqod to start mobile fuel station in Al Shamal soon – Responding to reports of fuel shortage due to its fuel station undergoing maintenance in Al Shamal, Woqod (QFLS) has assured its clients that the scarcity situation is of temporary nature and should not exceed a few days. The company had felt an urgent need to close the fuel station for maintenance for public safety as well as for better conservation of the local environment from any potential contamination or pollution hazards. The company is expected to open a mobile station, which includes all essential services needed by clients, in the next few days. Woqod said that tankers shall be made available immediately for Premium petrol (Super), while umbrellas will be installed to offer sun protection to drivers. The company is studying the actual need for the availability of tankers in the area, and if there is a need for an extended availability for more than 12 hours, it will not hesitate in providing so. Further, Woqod assured that there is no danger associated with these supply measures (through tankers) because tankers have the required equipment to provide safety, security and deal with gas emissions. (Qatar Peninsula) GISS announces QR1.6bn onshore contract extension; raising estimates and PT to QR129 – GDI announces 5-year contract extension for GDI 1-4 land rigs. GDI announced that four of its contracts with Qatar Petroleum (QP), covering the provision of the onshore rigs GDI-1, GDI-2, GDI-3 and GDI-4, were extended for an additional five years with effect from 2Q2014. The cumulative value of these contract extensions (including income from ancillary services) is worth QR1.6bn. These rigs have been working exclusively for QP in the Dukhan oilfields since they were first acquired. The 1500hp rigs, GDI-1, GDI-2 and GDI-4, commenced operations in 2004, 2005 and 2006, respectively, while the 1000hp rig, GDI-3, began operating in 2008. Deal extension terms imply 2x existing land rig rates. While the extension value includes one-off charges, taking into account the overall value, the daily rate for each of these four rigs works out to around $60k/d. This is almost double the $30.4k/rig for the existing land fleet as of 2013. Increasing estimates by an average of 3-5%. As a result of this new extension, we are increasing our revenue forecast to QR3.81bn vs. QR3.73bn for 2014. Moreover, we also raise top-line estimates for 2015 (QR4.92bn vs. QR4.77bn) and 2016 (QR5.27bn vs. QR5.05bn). Consequently, our 2014 EBITDA increases to QR1.41bn vs. QR1.36bn. Moreover, our 2015 EBITDA increases to QR1.73bn vs. QR1.66bn. Furthermore, our 2016 EBITDA increases to QR1.87bn vs. 1.76bn. Our net profit estimates change from QR981mn to QR1.01bn (2014), from QR1.08bn to QR1.12bn (2015), and from QR1.15bn to QR1.21bn (2016). We note that these revisions are subject to change pending discussion with GISS management. Increasing price target to QR129 from QR121; maintain Outperform rating. We recently raised GISS’ estimates and PT factoring in recent deals (again on extremely attractive terms) for the Dukhan (offshore) and the GDI 7/8 (land) rigs. Thus new contract extension prompts us to raise our price target further to QR129. (QNBFS Research, Peninsula Qatar) IHGS reports a net profit of QR4.6mn in 2Q2014, up 55.0% QoQ – Islamic Holding Group (IHGS) reported a net profit of QR7.6mn in 1H2014 (QR4.6mn in 2Q2014, up 55% QoQ and 100% YoY) as compared to QR4.4mn in 1H2013, reflecting an increase of 71.7% YoY. EPS stood at QR1.89 in 1H2014 (QR1.15 in 2Q2014) in comparison to QR1.10 in 1H2013 (QR0.57 in 2Q2013). The rise in IHGS’s net income was on account of substantial increase in its net brokerage & commission income that rose to QR13.1mn in 1H2014 from QR5.6mn in 1H2013 while, on a QoQ basis, it grew 55.7% to QR8.0mn in 2Q2014. Also, net income growth was supported by higher net gain from sale of available for sale investments (QR0.5mn in 1H2014 compared to QR0.2mn in 1H2013) and lower impairment losses on available for sale investments of QR0.3mn in 1H2014 compared to QR0.5mn in 1H2013. (QE) ABQK reports a net profit of QR302.7mn in 1H2014 – Ahli Bank (ABQK) reported a net profit of QR302.71mn in 1H2014 vs. QR270.73mn for the same period last year. EPS amounted to QR1.83 vs. QR1.64 for the corresponding period in 2013. (QE) QATI postpones results disclosure to July 14 – Qatar Insurance Company (QATI) has postponed the announcement of its reviewed financial reports for the period ending June 30, 2014, from July 13, 2014 to July 14, 2014. (QE) QGMD to announce results on July 24 – Qatari German for Medical Devices Company (QGMD) will disclose its financial reports for the period ending June 30, 2014, on July 24, 2014. (QE) AHCS to announce results on July 24 – Aamal Company (AHCS) will disclose its financial reports for the period ending June 30, 2014, on July 24, 2014. (QE) NLCS to announce results on July 24 – Alijarah Holding Company (NLCS) will disclose its financial reports for the period ending June 30, 2014, on July 24, 2014. (QE)
- 3. Page 3 of 5 Qatar Exchange Top 5 Gainers Top 5 Decliners Source: Qatar Exchange (QE) Source: Qatar Exchange (QE) Most Active Shares by Value (QR Million) Most Active Shares by Volume (Million) Source: Qatar Exchange (QE) Source: Qatar Exchange (QE) Investor Trading Percentage to Total Value Traded Net Traded Value by Nationality (QR Million) Source: Qatar Exchange (QE) Source: Qatar Exchange (QE) 15.3% 10.8% 9.8% 9.5% 8.9% 0.0% 6.0% 12.0% 18.0% Salam International Investment Ezdan Real Estate Qatar Islamic Bank Masraf Al Rayan Mazaya Qatar -4.8% -1.4% -0.8% -0.6% -0.4% -6.0% -4.0% -2.0% 0.0% Qatar Cinema & Film Distribution Qatar German Co. for Medical Devices Mesaieed Petrochemical Holding Company QNB Group Zad Holding 464.5 330.8 170.2 161.6 151.7 0.0 200.0 400.0 600.0 Masraf Al Rayan Ezdan Real Estate Gulf International Services QNB Group Salam International Investment 14.3 8.8 8.2 7.0 4.6 0.0 5.0 10.0 15.0 Ezdan Real Estate Masraf Al Rayan Salam International Investment Vodafone Qatar Mazaya Qatar 0% 20% 40% 60% 80% 100% Buy Sell 48.29% 55.41% 18.17% 13.78% 15.47% 18.37% 18.06% 12.45% Qatari Individuals Qatari Institutions Non-Qatari Individuals Non-Qatari Institutions 1,767 892 1,840 820 (73) 72 (500) - 500 1,000 1,500 2,000 Qatari Non-Qatari Net Investment Total Sold Total Bought
- 4. Page 4 of 5 TECHNICAL ANALYSIS OF THE QE INDEX Source: Bloomberg The QE Index continued its northward journey for the second consecutive week and registered strong gains of around 543 points to close above the 12,900.0 mark. The index started the week on a weak note, but witnessed a remarkable rally during the remaining four trading sessions breaching the important resistances of both the 21-day and 55-day moving averages. This has changed the underlying sentiment of the index to bullish as the bears have been trapped. We believe the bulls may continue to dominate the bears until the index stays above the 12,800.0 level. Meanwhile, the index faces its next key resistance at the 13,000.0 psychological level. A move above this level may confirm its bull grip and the index may further continue its positive momentum. On the flip side, traders may need to keep a close watch on 12,800.0 which is also in proximity to the 55-day moving average (currently at 12,802.35) for any reversal signs, as a drop below these levels may result in a pullback. Meanwhile, the RSI is in the buy zone, while the MACD is diverging away from the signal line toward the upside showing no immediate trend reversal signs, thus supporting this bullish sentiment. DEFINITIONS OF KEY TERMS USED IN TECHNICAL ANALYSIS RSI (Relative Strength Index) indicator – RSI is a momentum oscillator that measures the speed and change of price movements. The RSI oscillates between 0 to 100. The index is deemed to be overbought once the RSI approaches the 70 level, indicating that a correction is likely. On the other hand, if the RSI approaches 30, it is an indication that the index may be getting oversold and therefore likely to bounce back. MACD (Moving Average Convergence Divergence) indicator – The indicator consists of the MACD line and a signal line. The divergence or the convergence of the MACD line with the signal line indicates the strength in the momentum during the uptrend or downtrend, as the case may be. When the MACD crosses the signal line from below and trades above it, it gives a positive indication. The reverse is the situation for a bearish trend. Candlestick chart – A candlestick chart is a price chart that displays the high, low, open, and close for a security. The ‘body’ of the chart is portion between the open and close price, while the high and low intraday movements form the ‘shadow’. The candlestick may represent any time frame. We use a one-day candlestick chart (every candlestick represents one trading day) in our analysis. Doji candlestick pattern – A Doji candlestick is formed when a security's open and close are practically equal. The pattern indicates indecisiveness, and based on preceding price actions and future confirmation, may indicate a bullish or bearish trend reversal. Shooting Star/Inverted Hammer candlestick patterns – These candlestick patterns have a small real body (open price and close price are near to each other), and a long upper shadow (large intraday movement on the upside). The Shooting Star is a bearish reversal pattern that forms after a rally. The Inverted Hammer looks exactly like a Shooting Star, but forms after a downtrend. Inverted Hammers represent a potential bullish trend reversal.
- 5. Contacts Saugata Sarkar Abdullah Amin, CFA Shahan Keushgerian Head of Research Senior Research Analyst Senior Research Analyst Tel: (+974) 4476 6534 Tel: (+974) 4476 6569 Tel: (+974) 4476 6509 saugata.sarkar@qnbfs.com.qa abdullah.amin@qnbfs.com.qa shahan.keushgerian@qnbfs.com.qa Sahbi Kasraoui Ahmed Al-Khoudary QNB Financial Services SPC Manager – HNWI Head of Sales Trading – Institutional Contact Center: (+974) 4476 6666 Tel: (+974) 4476 6544 Tel: (+974) 4476 6548 PO Box 24025 sahbi.alkasraoui@qnbfs.com.qa ahmed.alkhoudary@qnbfs.com.qa Doha, Qatar DISCLAIMER: This publication has been prepared by QNB Financial Services SPC (“QNBFS”) a wholly-owned subsidiary of Qatar National Bank (“QNB”). QNBFS is regulated by the Qatar Financial Markets Authority and the Qatar Exchange; QNB is regulated by the Qatar Central Bank. This publication expresses the views and opinions of QNBFS at a given time only. It is not an offer, promotion or recommendation to buy or sell securities or other investments, nor is it intended to constitute legal, tax, accounting, or financial advice. We therefore strongly advise potential investors to seek independent professional advice before making any investment decision. Although the information in this report has been obtained from sources that QNBFS believes to be reliable, we have not independently verified such information and it may not be accurate or complete. While this publication has been prepared with the utmost degree of care by our analysts, QNBFS does not make any representations warranties as to the accuracy and completeness of the information it may contain, and declines any liability in that respect. QNBFS reserves the right to amend the views and opinions expressed in this publication at any time. It may also express viewpoints or make investment decisions that differ significantly from, or even contradict, the views and opinions included in this report. COPYRIGHT: No part of this document may be reproduced without the explicit written permission of QNBFS. Page 5 of 5 Source: Bloomberg Com pany Nam e Price (July 10) % Change 5-Day % Change YTD Market Cap. QR Million TTM P/E P/B Div. Yield Qatar National Bank 177.00 (0.56) 2.91 123,852 12.6 2.4 4.0 Qatar Islamic Bank 101.00 9.78 46.38 23,866 17.4 2.1 4.0 Commercial Bank of Qatar 68.40 5.23 15.93 20,310 12.4 1.3 2.4 Doha Bank 58.00 1.75 (0.34) 14,986 10.5 1.4 7.8 Al Ahli Bank 52.40 1.75 23.85 8,656 15.5 2.3 N/A Qatar International Islamic Bank 86.90 5.46 40.84 13,154 17.1 2.7 4.3 Masraf Al Rayan 55.10 9.54 76.04 41,325 23.8 4.2 2.7 Al Khaliji Bank 22.50 3.64 12.56 8,100 15.3 1.5 4.4 National Leasing 31.50 1.78 4.48 1,559 24.9 1.2 4.8 Dlala Holding 52.90 1.73 139.37 1,174 203.4 4.6 N/A Qatar & Oman Investment 15.21 5.99 21.49 479 22.0 1.5 3.9 Islamic Holding Group 70.70 1.73 53.70 283 23.2 5.1 2.4 Banking and Financial Services 257,744 Zad Holding 82.20 (0.36) 18.27 1,075 10.0 0.8 4.3 Qatar German Co. for Medical Devices 14.35 (1.44) 3.61 166 N/M 1.0 N/A Salam International Investment 18.80 15.27 44.50 2,149 16.7 1.3 5.3 Medicare Group 87.40 5.30 66.48 2,460 24.8 3.2 2.1 Qatar Cinema & Film Distribution 50.00 (4.76) 24.69 285 24.8 2.0 N/A Qatar Fuel 214.40 0.19 (1.89) 18,108 15.0 3.1 3.6 Qatar Meat and Livestock 56.00 6.67 8.32 1,008 18.8 3.7 3.8 Al Meera Consumer Goods 175.50 0.29 31.66 3,510 16.0 2.8 4.6 Consum er Goods and Services 28,761 Qatar Industrial Manufacturing 45.90 0.88 8.85 2,181 10.5 1.5 N/A Qatar National Cement 136.00 2.49 14.29 6,678 14.9 2.8 4.4 Industries Qatar 179.80 2.98 6.45 108,779 15.5 3.8 6.1 Qatari Investors Group 56.00 1.08 28.15 6,962 30.8 3.3 1.3 Qatar Electricity and Water 186.00 0.81 12.48 20,460 13.8 3.6 3.7 Mannai Corp. 110.40 0.09 22.80 5,036 9.9 2.8 5.0 Aamal 16.55 2.48 10.33 9,930 18.8 1.4 N/A Gulf International Services 102.50 5.45 110.04 19,049 26.2 6.4 1.6 Mesaieed Petrochemical Holding 32.05 (0.77) N/A 40,265 N/A 3.0 1.1 Industrials 219,340 Qatar Insurance 84.50 5.23 58.83 13,566 16.9 2.6 2.4 Doha Insurance 25.25 0.20 1.00 1,263 9.4 1.2 7.9 Qatar General Insurance & Reinsurance 45.00 0.90 12.73 3,113 1.5 0.6 2.8 Al Khaleej Takaful Insurance 44.45 3.37 58.32 987 13.4 1.5 N/A Qatar Islamic Insurance 77.50 0.65 33.85 1,163 15.2 4.5 4.8 Insurance 20,090 United Development 25.40 3.67 17.96 8,994 19.4 0.9 3.8 Barw a Real Estate 41.50 5.87 39.26 16,149 10.9 1.1 4.8 Ezdan Real Estate 23.60 10.80 38.82 62,599 50.2 2.1 1.3 Mazaya Qatar Real Estate Development 19.14 8.94 71.20 1,914 12.4 1.6 3.9 Real Estate 89,655 Qatar Telecom 135.50 6.53 (1.24) 43,403 16.6 1.7 3.0 Vodafone Qatar 19.30 7.34 80.21 16,316 N/M 2.8 0.9 Telecom s 59,720 Qatar Navigation (Milaha) 97.70 5.05 17.71 11,189 11.6 0.9 5.1 Gulf Warehousing 50.50 6.09 21.69 2,402 21.8 3.1 3.0 Qatar Gas Transport (Nakilat) 22.30 0.04 10.12 12,488 16.3 3.5 4.9 Transportation 26,079 Qatar Exchange 701,390