

Recomendados
Mais conteúdo relacionado
Mais procurados
Mais procurados (20)
Destaque
Destaque (20)
Semelhante a QE Index Falls 1.9
Semelhante a QE Index Falls 1.9 (20)
Mais de QNB Group
Mais de QNB Group (20)
Último
Último (20)
QE Index Falls 1.9
- 1. Page 1 of 5 Market Review and Outlook QE Index and Volume The Qatar Exchange (QE) Index declined 253.20 points, or 1.91%, during the trading week, to close at 132,978.86 points. Market capitalization decreased by 1.85% to reach QR705.1 billion (bn) as compared to QR718.4bn at the end of the previous week. Of the 43 listed companies, 14 companies ended the week higher, while 28 fell and 1 remained unchanged. Qatar Cinema & Film Distribution Company (QCFS) ) was the best performing stock for the week, with a gain of 14.22% on only 9,257 shares traded. On the other hand, Masraf Al Rayan (MARK) was the worst performing stock, with a decline of 9.41% on 14.7 million (mn) shares traded. MARK and Ooredoo (ORDS) were the biggest contributors to the weekly index decline. MARK contributed 168.11 points off the index’s weekly decline of 253.20 points. However, despite the recent decline, the stock has been one of the best performing stocks in 2014 year-to- date (YTD) with a price return of 72.20% versus the QE Index which is up 25.04%. The stock has been correcting after the strong rally on the MSCI EM Index upgrade (the highest weight in MSCI EM Index within Qatari stocks). ORDS was the second biggest contributor reducing the index by 37.92 points. ORDS is also up 7.43% YTD in 2014. On the other hand within the QE Index, QNB Group (QNBK) and Gulf International Services (GISS) helped arrest the decline. QNBK contributed 41.88 points to the QE Index. The stock has had a decent run in 2014 posting a price return of 7.56%. GISS also contributed 18.10 points to the index during the week. GISS is up 92.01% YTD in 2014. Trading value during the week decreased by 44.55% to reach QR4.0bn vs. QR7.3bn in the prior week. The Banks & Financial Services sector led the trading value during the week, accounting for 42.72% of the total equity trading value. MARK was the top value traded stock during the week with total traded value of QR814.1mn. Trading volume decreased by 38.91% to reach 100.0mn shares vs. 163.7mn shares in the prior week. The number of transactions declined by 25.36% to reach 46,458 transactions versus 62,244 transactions in the prior week. The Banks & Financial Services sector also led the trading volume, accounting for 34.08%. MARK was also the top volume traded stock during the week with total traded volume of 14.7mn shares. Foreign institutions continued on buying during the week with net buying of QR64.3mn vs. net buying of QR248.6mn in the prior week. Qatari institutions remained bearish with net selling of QR71.2mn vs. net selling of QR234.0mn the week before. Foreign retail investors remained bullish for the week with net buying of QR12.5mn vs. net buying of QR19.0mn in the prior week. Qatari retail investors remained bearish with net selling of QR5.7mn vs. net selling of QR33.5mn the week before. Thus far in 2014, the QE has already witnessed net foreign portfolio investment inflow of ~$2.01bn. Market Indicators Week ended June 12, 2014 Week ended June 05, 2014 Chg. % Value Traded (QR mn) 4,043.0 7,290.7 (44.5) Exch. Market Cap. (QR mn) 705,094.8 718,366.0 (1.8) Volume (mn) 100.0 163.7 (38.9) Number of Transactions 46,458 62,244 (25.4) Companies Traded 43 43 0.0 Market Breadth 14:28 16:26 – Market Indices Close WTD% MTD% YTD% Total Return 19,354.28 (1.9) (5.2) 30.5 All Share Index 3,281.58 (1.5) (4.2) 26.8 Banks/Financial Svcs. 3,161.19 (2.1) (6.3) 29.4 Industrials 4,302.71 (0.4) (4.1) 22.9 Transportation 2,270.15 (0.7) 3.3 22.2 Real Estate 2,736.97 (2.2) (3.7) 40.1 Insurance 3,386.02 1.5 0.9 44.9 Telecoms 1,773.38 (3.8) (4.6) 22.0 Consumer 6,832.26 (1.7) 2.0 14.9 Al Rayan Islamic Index 4,340.99 (2.5) (6.4) 43.0 Market Indices Weekly Index Performance Regional Indices Close WTD% MTD% YTD% Weekly Exchange Traded Value ($ mn) Exchange Mkt. Cap. ($ mn) TTM P/E** P/B** Dividend Yield Qatar (QE)* 12,978.86 (1.9) (5.2) 25.0 1,110.56 193,689.6 16.2 2.2 3.8 Dubai 4,836.86 (5.2) (4.9) 43.5 2,524.89 95,039.0 19.4 1.9 2.2 Abu Dhabi 4,931.78 (2.4) (6.1) 15.0 761.92 137,103.4 14.5 1.8 3.4 Saudi Arabia 9,826.67 (0.3) 0.0 15.1 13,013.60 534,357.8# 19.6 2.4 2.9 Kuwait 7,244.13 (1.3) (0.6) (4.0) 402.31 13,448.9 16.5 1.1 3.8 Oman 6,907.55 (0.7) 0.7 1.1 83.15 25,063.2 12.5 1.7 3.8 Bahrain 1,459.95 (0.1) 0.0 16.9 7.49 53,918.2 11.4 1.0 4.7 Source: Bloomberg, country exchanges and Zawya (** Trailing Twelve Months; * Value traded ($ mn) do not include special trades, if any) (# Data as of June 11, 2014) 13,149.55 12,969.65 12,970.81 12,912.81 12,978.86 0 17,500,000 35,000,000 12,750 12,975 13,200 8-Jun 9-Jun 10-Jun 11-Jun 12-Jun Volume QE Index (0.1%) (0.3%) (0.7%) (1.3%) (1.9%) (2.4%) (5.2%) (8.0%) (4.0%) 0.0% Bahrain SaudiArabia Oman Kuwait Qatar(QE)* AbuDhabi Dubai
- 2. Page 2 of 5 News Economic News QCB to issue QR4bn in bonds – The Qatar Central Bank (QCB) will issue 3-year government bonds worth QR2.1bn, as well as 5-year and 7-year bonds worth QR950mn each. All the bonds will be issued on June 15, 2014. (QCB) MDPS: Qatar inflation rises 3.4% in May on rent, fuel – Qatar’s cost of living based on consumer price index (CPI), rose 3.4% YoY in May 2014 mainly on rising rents and costlier furniture, garments, transport & entertainment. The Ministry of Development Planning & Statistics (MDPS) said that the CPI was up 0.5% as compared to April 2014. The rent, fuel & energy group (weight of 32.2% in the CPI basket) recorded an increase of 7% YoY in May 2014 and was up 0.6% from April. MDPS figures showed that after eliminating the effect of rent, the overall index was up 0.5% from the previous month and 2.1% YoY. The transport & communication group (20.5% weight), witnessed a surge of 2.6% YoY in May 2014. It was up 1.6% from the April level as Woqod had increased the retail diesel prices by 50%. According to QNB Group’s projection, the country’s inflation is expected to rise to 3.4% in 2014 as the rapidly expanding population should raise domestic inflation (primarily through the rental component), offsetting lower foreign inflation (primarily from lower international food prices). (QNB Group, Gulf-Times.com) StanChart sets stable credit outlook for Qatar on LNG lead – Standard Chartered Bank (StanChart) sees a stable credit outlook for Qatar, reflecting the country’s dominant position in the global liquid natural gas (LNG) market. StanChart said buoyed by a strong hydrocarbon sector, Qatar has built up significant external and fiscal cushions. While gas-market dynamics are changing, StanChart does not foresee an immediate threat to Qatar’s strong credit metrics, particularly given its very low cost of production. After an era of LNG-led double-digit growth, Qatar is entering a moderate growth phase that is likely to be driven by the non-hydrocarbon sector as the country prepares to host the 2022 FIFA World Cup. Strong fundamentals and a lack of supply have supported Qatar’s sovereign spreads, making this a fairly defensive segment. StanChart no longer sees a strong relative-value argument in support of Qatar sovereign paper on a rating-adjusted basis. In the bank’s views, Qatari financials and quasi-sovereign bonds offer better value. (Gulf-Times.com) Kahramaa awards $4mn leak detection contract to Pure Tech – Qatar General Electricity & Water Corporation (Kahramaa) awarded a leak detection contract worth $4mn to Pure Technologies (Pure) over a three-year period commencing June 2014. Under the contract, Pure, through its Abu Dhabi-based operations will provide leak detection services on a significant portion of Kahramaa's large-diameter pipeline network, which is critical for the delivery of treated, desalinated water for commercial, industrial and residential users. The company's proprietary SmartBall technology will be utilized for pipelines between 600mm to 1600mm in diameter during the contract period. It is an innovative, free-swimming inspection technology designed to operate in a live pipeline, identifying tiny leaks, gas pockets and structural defects. (Bloomberg) Market & Corporate News GDI wins 2 land rig deals worth QR1.1bn from QP – Gulf Drilling International (GDI) – a wholly-owned subsidiary of Gulf International Services (GISS) – has bagged two contracts collectively worth QR1.1bn from Qatar Petroleum (QP) for providing land rig services. The new contracts with a term of five years each will cover services to be performed by two new custom designed land rigs (GDI-7 and GDI-8), which GDI is in the process of acquiring from a US-based builder. GDI-8 will be GDI’s largest land rig, and at 3000HP, it will have the capability of drilling deeper wells and executing extended reach wells to a much greater distance. Construction of the two new land rigs will soon commence and the rigs are expected to be placed into service during 2H2015. (Gulf-Times.com) QIBK in talks to acquire stake in ASYAB – Qatar Islamic Bank (QIBK) is in talks to acquire a stake in Turkey-based Asya Katilim Bankasi (ASYAB). Goldman Sachs Group is acting as the exclusive financial adviser to ASYAB on the transaction. In March 2014, ASYAB had announced that it had commenced talks with QIBK for a strategic partnership, while QIBK was interested in acquiring a stake in ASYAB. (Bloomberg) Commercial Bank of Qatar (CBQK) considers US Dollar bond offering – According to sources, CBQK has hired BofA Merrill Lynch, HSBC and Morgan Stanley to arrange a series of meetings with bond investors starting tomorrow. A US$ benchmark Reg S transaction may follow subject to market conditions. (Bloomberg) MCCS completes 49% stake sale in Transfield Mannai – Mannai Corporation’s (MCCS) wholly owned subsidiary, Gulf Laboratories, has completed the sale of its 49% shareholding in Transfield Mannai to Cofely Besix Facility Management Ltd. However, MCCS still holds the remaining 51% stake in Transfield Mannai. Following the completion of the requisite formalities, the company will be renamed as ‘Cofely Besix Mannai Facility Management’. (QE) Mannai HED sees growing potential for heavy transport equipment in Qatar – Mannai Heavy Equipment Division (Mannai HED) sees growing potential for heavy transport equipment in the country, including its DAF trucks line. According to Mannai HED, DAF trucks are among the most reliable and sought-after trucks in the construction, distribution and long-haul sectors. Mannai HED’s partnership with DAF allows it to deliver standard production trucks customized to suit client requests. DAF is a global leader in ‘build to order’ truck deliveries. (Gulf-Times.com) QNBK wins two Euromoney awards – QNB Group (QNBK) has been awarded "The Best Bank in the Middle East" and "The Best Bank in Qatar" Awards by eminent international finance magazine Euromoney. The awards reflect the continuing progress being made by QNBK across the MENA region and the domestic market. This also marks the 11th occasion that QNBK has won this accolade from the international magazine. (Peninsula Qatar) Ooredoo signs broadband deal with Pearl-Qatar towers – Ooredoo has signed an ongoing agreement with several of The Pearl-Qatar’s residential towers to provide super-fast broadband and Mozaic TV services to its residents. Towers across The Pearl-Qatar are currently being enabled to allow residents and businesses to connect to the fastest internet speeds in Qatar, providing customers the option to subscribe to a range of sports, entertainment and news packages offered through Ooredoo’s Mozaic TV service. (Gulf-Times.com)
- 3. Page 3 of 5 Qatar Exchange Top 5 Gainers Top 5 Decliners Source: Qatar Exchange (QE) Source: Qatar Exchange (QE) Most Active Shares by Value (QR Million) Most Active Shares by Volume (Million) Source: Qatar Exchange (QE) Source: Qatar Exchange (QE) Investor Trading Percentage to Total Value Traded Net Traded Value by Nationality (QR Million) Source: Qatar Exchange (QE) Source: Qatar Exchange (QE) 14.2% 6.1% 4.6% 4.3% 3.5% 0.0% 4.0% 8.0% 12.0% 16.0% Qatar Cinema & Film Distribution Dlala Holding Zad Holding Al Khaleej Takaful Insurance Qatar German Co. for Medical Devices -9.4% -8.2% -5.1% -4.0% -3.7% -12.0% -8.0% -4.0% 0.0% Masraf Al Rayan Ezdan Real Estate United Development Ooredoo Qatar & Oman Investment 814.1 239.0 231.5 216.3 214.9 0.0 300.0 600.0 900.0 Masraf Al Rayan Gulf International Services Vodafone Qatar Industries Qatar Barwa Real Estate 14.7 11.6 11.3 9.1 7.0 0.0 5.0 10.0 15.0 Masraf Al Rayan Vodafone Qatar Salam International Investment Ezdan Real Estate United Development 0% 20% 40% 60% 80% 100% Buy Sell 47.79% 47.93% 11.90% 13.66% 14.50% 14.19% 25.81% 24.22% Qatari Individuals Qatari Institutions Non-Qatari Individuals Non-Qatari Institutions 2,413 1,630 2,490 1,553 (77) 77 (500) - 500 1,000 1,500 2,000 2,500 3,000 Qatari Non-Qatari Net Investment Total Sold Total Bought
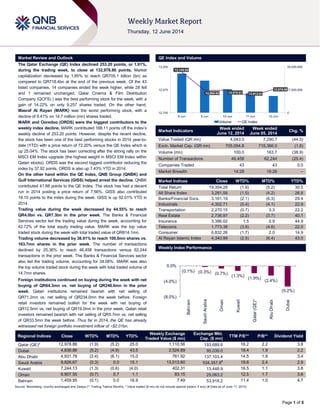
- 4. Page 4 of 5 TECHNICAL ANALYSIS OF THE QE INDEX Source: Bloomberg The QE Index drifted lower for the second straight week and shed around 253 points. The index started the week on a bearish note slipping below the 21- day moving average and the 13,200.0 level. Moreover, the index caved under sustained selling pressure on Monday and further dipped below the 13,100.0 and 13,000.0 levels as the bears dominated the bulls. However, the index staged a smart recovery from its weekly low of 12,837.85 and managed to close above the 12,900.0 level on Tuesday and Wednesday on the back of buying interest. Further, the index rebounded on Thursday as the bulls came to the rescue moving above the key level of 12,940.0 and the descending trendline, keeping its upward hopes alive. The index faces its immediate resistance of 13,020.0. We believe if the index manages to stay above the 12,900.0 level, and clears 13,020.0, it may set the stage for an advance toward 13,100.0- 13,200.0 followed by the 13,350.0 levels. On the flip side, any retreat below 12,900.0 may result in bearish implications and may drag the index further down toward the 12,770.0 level. Meanwhile, both the momentum indicators are providing mixed signals indicating the continuation of this volatility. DEFINITIONS OF KEY TERMS USED IN TECHNICAL ANALYSIS RSI (Relative Strength Index) indicator – RSI is a momentum oscillator that measures the speed and change of price movements. The RSI oscillates between 0 to 100. The index is deemed to be overbought once the RSI approaches the 70 level, indicating that a correction is likely. On the other hand, if the RSI approaches 30, it is an indication that the index may be getting oversold and therefore likely to bounce back. MACD (Moving Average Convergence Divergence) indicator – The indicator consists of the MACD line and a signal line. The divergence or the convergence of the MACD line with the signal line indicates the strength in the momentum during the uptrend or downtrend, as the case may be. When the MACD crosses the signal line from below and trades above it, it gives a positive indication. The reverse is the situation for a bearish trend. Candlestick chart – A candlestick chart is a price chart that displays the high, low, open, and close for a security. The ‘body’ of the chart is portion between the open and close price, while the high and low intraday movements form the ‘shadow’. The candlestick may represent any time frame. We use a one-day candlestick chart (every candlestick represents one trading day) in our analysis. Doji candlestick pattern – A Doji candlestick is formed when a security's open and close are practically equal. The pattern indicates indecisiveness, and based on preceding price actions and future confirmation, may indicate a bullish or bearish trend reversal. Shooting Star/Inverted Hammer candlestick patterns – These candlestick patterns have a small real body (open price and close price are near to each other), and a long upper shadow (large intraday movement on the upside). The Shooting Star is a bearish reversal pattern that forms after a rally. The Inverted Hammer looks exactly like a Shooting Star, but forms after a downtrend. Inverted Hammers represent a potential bullish trend reversal.
- 5. Contacts Saugata Sarkar Abdullah Amin, CFA Shahan Keushgerian Head of Research Senior Research Analyst Senior Research Analyst Tel: (+974) 4476 6534 Tel: (+974) 4476 6569 Tel: (+974) 4476 6509 saugata.sarkar@qnbfs.com.qa abdullah.amin@qnbfs.com.qa shahan.keushgerian@qnbfs.com.qa Sahbi Kasraoui Ahmed Al-Khoudary QNB Financial Services SPC Manager – HNWI Head of Sales Trading – Institutional Contact Center: (+974) 4476 6666 Tel: (+974) 4476 6544 Tel: (+974) 4476 6548 PO Box 24025 sahbi.alkasraoui@qnbfs.com.qa ahmed.alkhoudary@qnbfs.com.qa Doha, Qatar DISCLAIMER: This publication has been prepared by QNB Financial Services SPC (“QNBFS”) a wholly-owned subsidiary of Qatar National Bank (“QNB”). QNBFS is regulated by the Qatar Financial Markets Authority and the Qatar Exchange; QNB is regulated by the Qatar Central Bank. This publication expresses the views and opinions of QNBFS at a given time only. It is not an offer, promotion or recommendation to buy or sell securities or other investments, nor is it intended to constitute legal, tax, accounting, or financial advice. We therefore strongly advise potential investors to seek independent professional advice before making any investment decision. Although the information in this report has been obtained from sources that QNBFS believes to be reliable, we have not independently verified such information and it may not be accurate or complete. While this publication has been prepared with the utmost degree of care by our analysts, QNBFS does not make any representations warranties as to the accuracy and completeness of the information it may contain, and declines any liability in that respect. QNBFS reserves the right to amend the views and opinions expressed in this publication at any time. It may also express viewpoints or make investment decisions that differ significantly from, or even contradict, the views and opinions included in this report. COPYRIGHT: No part of this document may be reproduced without the explicit written permission of QNBFS. Page 5 of 5 Source: Bloomberg Com pany Nam e Price (June 12) % Change 5-Day % Change YTD Market Cap. QR Million TTM P/E P/B Div. Yield Qatar National Bank 185.00 2.49 7.56 129,450 13.2 2.6 3.8 Qatar Islamic Bank 98.50 (0.71) 42.75 23,275 17.0 2.1 4.1 Commercial Bank of Qatar 65.30 (2.83) 10.68 19,390 11.9 1.2 2.6 Doha Bank 60.40 (3.05) 3.78 15,606 11.0 1.5 7.5 Al Ahli Bank 51.00 (1.92) 20.55 8,425 15.6 2.3 N/A Qatar International Islamic Bank 84.40 (1.06) 36.79 12,776 16.6 2.6 4.4 Masraf Al Rayan 53.90 (9.41) 72.20 40,425 23.3 4.1 2.8 Al Khaliji Bank 22.95 (1.25) 14.81 8,262 15.6 1.5 4.4 National Leasing 33.15 0.45 9.95 1,640 26.2 1.3 4.5 Dlala Holding 53.80 6.11 143.44 1,194 N/M 4.7 N/A Qatar & Oman Investment 15.02 (3.66) 19.97 473 21.7 1.4 4.0 Islamic Holding Group 74.00 (2.76) 60.87 296 29.9 5.0 2.3 Banking and Financial Services 261,212 Zad Holding 80.30 4.56 15.54 1,050 9.8 0.7 4.4 Qatar German Co. for Medical Devices 15.00 3.45 8.30 173 N/M 1.0 N/A Salam International Investment 16.04 (3.61) 23.29 1,834 14.2 1.1 6.2 Medicare Group 84.60 0.00 61.14 2,381 24.0 3.1 2.1 Qatar Cinema & Film Distribution 47.40 14.22 18.20 271 23.5 1.9 N/A Qatar Fuel 217.50 (2.55) (0.48) 18,370 15.3 3.1 3.5 Qatar Meat and Livestock 58.60 (1.68) 13.35 1,055 19.7 4.2 3.6 Al Meera Consumer Goods 180.50 (1.04) 35.41 3,610 16.4 2.9 4.4 Consum er Goods and Services 28,744 Qatar Industrial Manufacturing 46.90 0.54 11.23 2,229 10.7 1.5 N/A Qatar National Cement 132.50 1.07 11.34 6,506 14.5 2.5 4.5 Industries Qatar 180.90 (0.88) 7.10 109,445 15.5 3.8 6.1 Qatari Investors Group 62.60 (2.64) 43.25 7,783 34.4 3.7 1.2 Qatar Electricity and Water 190.10 (0.99) 14.96 20,911 14.1 3.7 3.6 Mannai Corp. 113.00 (0.09) 25.70 5,155 10.2 2.9 4.9 Aamal 16.07 (0.86) 7.13 9,642 18.1 1.4 N/A Gulf International Services 93.70 2.97 92.01 17,413 23.9 5.8 1.7 Mesaieed Petrochemical Holding 33.10 (2.36) N/A 41,584 N/A 3.0 1.1 Industrials 220,667 Qatar Insurance 79.20 1.67 48.87 12,715 15.8 2.5 2.5 Doha Insurance 25.40 1.60 1.60 1,270 9.5 1.2 7.9 Qatar General Insurance & Reinsurance 43.90 (0.11) 9.98 3,037 1.4 0.6 2.8 Al Khaleej Takaful Insurance 44.00 4.27 56.71 977 13.2 1.5 N/A Qatar Islamic Insurance 74.90 1.22 29.36 1,124 17.7 4.1 5.0 Insurance 19,122 United Development 24.90 (5.14) 15.63 8,817 19.0 0.8 3.8 Barw a Real Estate 42.00 (0.71) 40.94 16,343 11.1 1.2 4.8 Ezdan Real Estate 21.75 (8.23) 27.94 57,692 46.3 1.9 1.4 Mazaya Qatar Real Estate Development 19.10 (1.04) 70.84 1,910 12.4 1.6 3.9 Real Estate 84,762 Qatar Telecom 147.40 (3.97) 7.43 47,215 18.1 1.9 2.7 Vodafone Qatar 20.05 (3.37) 87.21 16,950 N/M 2.9 N/A Telecom s 64,165 Qatar Navigation (Milaha) 93.80 1.96 13.01 10,742 11.2 0.9 5.3 Gulf Warehousing 53.00 (3.64) 27.71 2,521 22.9 3.3 2.8 Qatar Gas Transport (Nakilat) 23.50 (2.08) 16.05 13,160 17.1 3.6 4.7 Transportation 26,423 Qatar Exchange 705,095