

Recomendados
Recomendados
Mais conteúdo relacionado
Mais procurados
Mais procurados (20)
Destaque
Destaque (19)
Semelhante a QNB Qatar Monthly Monitor July 2013
Semelhante a QNB Qatar Monthly Monitor July 2013 (20)
Mais de QNB Group
Mais de QNB Group (20)
Último
Último (20)
QNB Qatar Monthly Monitor July 2013
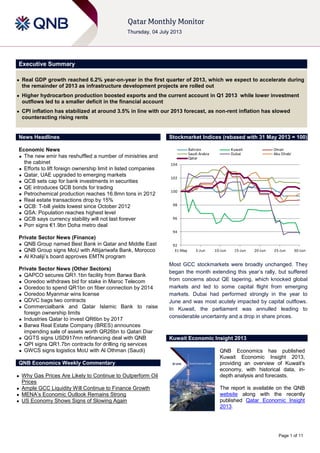
- 1. Page 1 of 11 Executive Summary Real GDP growth reached 6.2% year-on-year in the first quarter of 2013, which we expect to accelerate during the remainder of 2013 as infrastructure development projects are rolled out Higher hydrocarbon production boosted exports and the current account in Q1 2013 while lower investment outflows led to a smaller deficit in the financial account CPI inflation has stabilized at around 3.5% in line with our 2013 forecast, as non-rent inflation has slowed counteracting rising rents News Headlines Economic News The new emir has reshuffled a number of ministries and the cabinet Efforts to lift foreign ownership limit in listed companies Qatar, UAE upgraded to emerging markets QCB sets cap for bank investments in securities QE introduces QCB bonds for trading Petrochemical production reaches 16.8mn tons in 2012 Real estate transactions drop by 15% QCB: T-bill yields lowest since October 2012 QSA: Population reaches highest level QCB says currency stability will not last forever Porr signs €1.9bn Doha metro deal Private Sector News (Finance) QNB Group named Best Bank in Qatar and Middle East QNB Group signs MoU with Attijariwafa Bank, Morocco Al Khaliji’s board approves EMTN program Private Sector News (Other Sectors) QAPCO secures QR1.1bn facility from Barwa Bank Ooredoo withdraws bid for stake in Maroc Telecom Ooredoo to spend QR1bn on fiber connection by 2014 Ooredoo Myanmar wins license QDVC bags two contracts Commercialbank and Qatar Islamic Bank to raise foreign ownership limits Industries Qatar to invest QR6bn by 2017 Barwa Real Estate Company (BRES) announces impending sale of assets worth QR26bn to Qatari Diar QGTS signs USD917mn refinancing deal with QNB QPI signs QR1.7bn contracts for drilling rig services GWCS signs logistics MoU with Al Othman (Saudi) QNB Economics Weekly Commentary Why Gas Prices Are Likely to Continue to Outperform Oil Prices Ample GCC Liquidity Will Continue to Finance Growth MENA’s Economic Outlook Remains Strong US Economy Shows Signs of Slowing Again Stockmarket Indices (rebased with 31 May 2013 = 100) Most GCC stockmarkets were broadly unchanged. They began the month extending this year’s rally, but suffered from concerns about QE tapering, which knocked global markets and led to some capital flight from emerging markets. Dubai had performed strongly in the year to June and was most acutely impacted by capital outflows. In Kuwait, the parliament was annulled leading to considerable uncertainty and a drop in share prices. Kuwait Economic Insight 2013 QNB Economics has published Kuwait Economic Insight 2013, providing an overview of Kuwait’s economy, with historical data, in- depth analysis and forecasts. The report is available on the QNB website along with the recently published Qatar Economic Insight 2013. 92 94 96 98 100 102 104 31-May 5-Jun 10-Jun 15-Jun 20-Jun 25-Jun 30-Jun Bahrain Kuwait Oman Saudi Arabia Dubai Abu Dhabi Qatar
- 2. Qatar Monthly Economic Monitor 1 st July 2013 Page 2 of 11 Real GDP grows in line with QNB Economics forecasts as oil and gas production picks up Real GDP growth was in line with our 2013 forecasts at 6.2% year-on-year (YoY) in Q1 2013. Growth in the Oil & Gas sector (which accounts for 44% of real GDP) was 0.8% in the 12 months to Q1 2013, compared with a 0.1% in the twelve months to Q4 2012. This was related to maintenance downtime at LNG facilities in Q4 2012 and some fluctuation in oil production. Although the non-oil sector growth slowed slightly, it remains the most important driver of growth, expanding by 10.6% in the year to Q1 2013. We maintain our forecast for real growth for 2013 at 6.5% as we expect non-oil growth to continue to accelerate as major infrastructure projects are rolled out. We expect growth to pick up further to 6.8% in 2014 as the project pipeline intensifies. Oil and gas picked up Real GDP growth (%, YoY) Source: Qatar Statistics Authority (QSA) Manufacturing was the fastest growing sector over the last 12 months (12.5%) boosted by production from the new Pearl Gas-To-Liquids facilities. Construction picked up (6.3%) in Q1 2013 alone — a further indication that the roll out of Qatar’s infrastructure development program is gathering steam. Financial Services benefited from the strong performance across the economy with a sharp increase in Q1 2013 to 5.8% quarter-on-quarter. Trade, Restaurants and Hotels grew strongly, boosted by an influx of people required to implement major projects. Nominal GDP grew 6.1% in the 12 months to March 2013 to QR185bn (USD51bn). It was kept down by falling commodity prices. The Q1 data is in line with our full-year forecasts for nominal GDP of about USD200bn in 2013. Manufacturing & construction sectors grew fastest Real GDP growth (%, YoY) Source: QSA 13.5 7.58.4 18.4 30 25 20 15 10 5 0 Q1 13 6.2 Q4 12 6.6 Q3 12 5.2 Q2 12 5.8 Q1 12 Q4 11 Q3 11 12.3 Q2 11 Q1 11 Oil & Gas Non-Oil & Gas Total 0.8 5.9 7.9 8.5 8.6 9.3 9.4 10.5 10.5 11.7 12.5Manufacturing Oil & Gas Financial Services Electricity, Gas & Water Trade,Restaurants & Hotels Household Services Government Services Social Services Construction Agriculture & Fishing Transport& Communications
- 3. Qatar Monthly Economic Monitor 1 st July 2013 Page 3 of 11 Higher hydrocarbon production boost exports while outflows related to non-hydrocarbon sectors slow The current-account surplus rose to 38% of GDP in Q1 2013 as goods exports grew 11% reflecting the increase in oil and gas production. We expect a small moderation in the current account surplus to 35% of GDP for the full-year 2013 as outflows pick up with increased economic activity, and exports fall with lower average oil prices. The financial account deficit narrowed in Q1 2013 as outflows of investment slowed sharply from USD16bn in Q4 2012 to USD9bn in Q1 2013. We expect the financial account deficit to narrow further in 2013. Lower FDI and portfolio outflows will contribute to a smaller deficit. Current and financial account balances improve External Balances (% GDP) Source: QSA Inflation stabilizes at about 3.5% despite rising rents Inflation stabilized at about 3.5% YoY in May 2013. Rents are 32% of the CPI basket and have increased every month since June 2012, reversing the previous downward trend. However, as rental increases slow and non-rent inflation has fallen, overall inflation has levelled off. The latest data is in line with our forecast for inflation of 3.5% for 2013 as a whole. We expect a pickup in population growth to drive consumer demand and push inflation up to around 3.8% in 2014. There is an upside risk for inflation if the rollout of major infrastructure projects causes overheating. Slower non-rent inflation counteracts higher rents CPI Inflation (%, YoY) Source: QSA 38 27 38 3133 28 31 36 17 -27 -35 -16-21-20 -27 -32 -48 -41 Q1 12 Q3 11 Q3 12 Q1 13 Q2 11 Q4 11 Q2 12 Q1 11 Q4 12 Financial Current 2.3 6.5 3.5 -8 -6 -4 -2 0 2 4 6 8 10-1207-12 01-1304-12 04-13 Total Rent Non-Rent
- 4. Qatar Monthly Economic Monitor 1 st July 2013 Page 4 of 11 Economic News New Emir restructures ministries and cabinet – A new Ministry of Economy and Trade has been carved out of the Ministry of Finance with the Minister of Finance being replaced by the former CEO of QNB. Additionally, new ministries have been created, the Ministry of Development Planning and Statistics and the Ministry of Transport. Efforts to increase foreign ownership limit in Qatari listed companies – The outgoing Minister of Economy & Finance and the Chairman of the Financial Markets Development Committee, HE Yousef Hussain Kamal, said the committee is making extensive efforts to provide an attractive investment environment for foreign investors by encouraging several listed companies to increase their maximum ownership percentage allocated for non-Qataris. (QE) Qatar, UAE upgraded to emerging markets – MSCI has upgraded Qatar and the UAE to emerging-market status from their frontier market classification. The index provider has downgraded Morocco to a frontier market and lowered Greece to emerging market from developed market status. The reclassification of Qatar and the UAE will coincide with the May 2014 semi-annual index review, while the status lowering of both Greece and Morocco will coincide with the November 2013 semi-annual index review. Meanwhile, MSCI said it is monitoring Egyptian markets, with a particular concern over the recent shortage of foreign currency in the domestic foreign exchange market. (Bloomberg, Reuters) QCB sets cap for bank investments in securities – Qatar Central Bank (QCB) has set the cap for bank investments in equity and debt securities at 25% of their capital and reserves (including no more than 5% in an individual company, 10% in unlisted securities and 5% in foreign securities). Debt instruments issued by the Qatari government, the central bank, and licensed national banks are excluded from these limits. QCB sets limits on Islamic bank investments – Islamic banks have been limited to property investments at 10% of capital, reserves, and limits on investments in associates is set at 35%, including investments, financing, all risk exposure and limit on investment in single associate company at 25%. QE introduces QCB bonds for trading – The Qatar Exchange (QE) has introduced government bonds issued by the Qatar Central Bank (QCB) for trading on the exchange commencing on June 20, 2013. The trading of treasury-bills, which was launched in December 2011. At the launch, four bonds will be available for trading and it is expected that future quarterly issues will also be listed on the market. (QE) Qatar forecasts – real GDP is forecast to grow 5.3% in 2013 according to the latest estimates from Qatar’s General Secretariat for Development Planning, up from 4.8% projected in December 2012. Consumer prices are expected to increase by 3.6% in 2013 with a record fiscal surplus of 8.1% of nominal GDP in 2013. Meanwhile, the QNB Group has said Qatar’s real GDP growth is expected to reach 6.5% in 2013 and 6.8% in 2014, on the back of strong non-oil sector performance. QNB expects CPI inflation to be 3.5% in 2013 and 3.8% in 2014. (Gulf-Times.com) Petrochemical production reaches 16.8mn tons in 2012 – The makes Qatar the second largest petrochemical producer in the GCC, after Saudi Arabia. One of the key projects that came on-stream last year was Qatar Petrochemical Company’s (Qapco) new low density polyethylene (LDPE-3) plant, which increased its polyolefin production capacity to 1.15mn tons per annum. This plant has the highest polyolefin production capacity in a single location anywhere in the world. (Peninsula Qatar) Real estate transactions drop by 15% – The value of real estate transactions in Qatar dropped by 15% YoY during January-May 2013 to QR17.5bn. The total transaction value in January 2013 dropped by a huge 46.5% compared to January 2012. February also saw a drop in the transaction value compared to February 2012. The transactions picked up in all the remaining months but failed to exceed the total value posted during the corresponding period in 2012. (Peninsula) QCB: T-bill yields lowest since October 2012 – According to the data published by the Qatar Central Bank (QCB), yields in Qatar's Treasury bill auction fell to their lowest level since October 2012. (Reuters) QCB Governor: Decades of currency stability will not last forever – The Qatar Central Bank (QCB) Governor Sheikh Abdullah bin Saud al Thani said that decades of currency stability endured till now will not last forever. He said the country Qatar might one day need a more flexible currency, though it is not currently considering any change to the Qatari riyal’s peg to the US dollar. (Qatar Tribune) Porr signs €1.9bn Doha metro deal – Austrian construction firm Porr has signed €1.9bn contract to build one of Doha’s new metro lines, as part of a consortium with two Qatari partners – SBG and HBK. Porr is responsible for 50% of the overall project, representing an order volume of around €945mn for the Group. (Gulf-Times.com) Private Sector News Finance QNB Group named Best Bank in Qatar and Middle East – QNB Group has been awarded the “Best Bank in the Middle East” by The Banker magazine. In addition it was awarded the “Best Bank in Qatar” title for the third consecutive year. QNB Group signs MoU with Attijariwafa Bank of Morocco – QNB Group has signed a MoU with Attijariwafa Bank of Morocco to focus on mutual business in various areas such as capital markets, trade finance and investment flows between Qatar and Morocco. (QNB Group Press Release) KCBK’s board approves EMTN program – Al Khalij Commercial Bank’s (KCBK) board of directors has approved the new euro medium term note (EMTN) program. (QE) QAPCO secures QR1.1bn facility from Barwa Bank – The Qatar Petrochemical Company (QAPCO) has secured a QR1.1bn loan from Barwa Bank, which will support its working capital and enhance expansion activities. (Gulf-Times.com) CBQK, QIBK to raise foreign ownership limits – Commercial Bank of Qatar (CBQK) and Qatar Islamic Bank (QIBK) have asked the Qatar Exchange to increase the number of their shares available to foreign investors to 25% of their market capitalization. These changes are expected to be implemented over the next six to nine months. (Reuters) Other sectors Ooredoo withdraws bid for Vivendi stake in Maroc Telecom – Ooredoo (formerly QTEL) has withdrawn its bid for Vivendi’s 53% stake in Moroccan telecom operator, Maroc Telecom, leaving Etisalat of the UAE as the only remaining bidder. Ooredoo to spend QR1bn on nationwide fiber connection by 2014 – Ooredoo is planning to spend QR1bn to ensure that all households in Qatar are connected to a nationwide fiber optic network by the end of 2014. To start with, Ooredoo is set to launch its “Business Fibre” network in 3Q 2013,
- 5. Qatar Monthly Economic Monitor 1 st July 2013 Page 5 of 11 targeting businesses in Qatar and SMEs in particular. (Qatar Tribune, Gulf-Times.com) Ooredoo Myanmar wins license after saying it plans to invest USD15bn– Ooredoo (formerly QTEL) won one of two telecoms licenses in Myanmar. The company had said it would invest USD15bn in rolling out a telecommunications network across Myanmar. He added that Ooreedoo would roll out a 3G data network across the country, reaching 90% of the population within two years. (Bloomberg) QDVC bags two contracts; Ashghal gives road contract to Egis – Qatar Rail awarded Qatari Diar Vinci Construction (QDVC) a tender of QR7.4bn. Moreover, QDVC was awarded two projects; to build the car park and Sheraton project valued at around QR2bn. (Gulf-Times.com) Industries Qatar plans QR6bn capital expenditure by 2017 – Industries Qatar’s (IQCD) 5-year business plan forecasts accumulated capital spending and investments of around QR6bn, including for the Ras Laffan Petrochemical Complex. Industries Qatar owns 16% of that project, which is budgeted at QR18.2bn. The plant is tentatively slated to open in 2018. Moreover, IQCD is set to start its EF5 steel plant in 3Q2013, but said it is facing a 2 year delay to decommissioning its old EF1, EF2 steel plants. (Bloomberg, Peninsula Qatar) Barwa Real Estate Company (BRES) announces the impending sale of assets worth QR26bn to parent Qatari Diar – BRES announced that it is in the process of selling assets amounting to roughly QR26bn to its strategic shareholder Qatari Diar, which holds 45% of its outstanding issued shares. According to the company, the Qatari Diar initiative is mainly to secure the remaining shareholders rights and reduce overall debt costs. This sale is expected to be completed this year and among the assets to be sold are: Barwa Commercial Avenue, Barwa Al Sadd, Barwa City and certain assets of the company’s Investment portfolio. (QE) QGTS signs USD917mn refinancing deal with QNB Group – Nakilat Inc., a wholly owned subsidiary of Qatar Gas Transport Company Ltd. (Nakilat), has successfully arranged refinancing amounting to USD917 million with Qatar National Bank (QNB). Nakilat Inc. established its Program Financing structure to fund the construction of a fleet of 25 LNG vessels, each of which is subject to a 25-year time charter. These vessels serve as part of the floating pipeline carrying LNG for Qatargas and RasGas, which together produce over 77 MTA of LNG. (QE) QPI signs QR1.7bn contracts for drilling rig services – Qatar Petroleum International (QPI) has signed two contracts worth QR1.7bn with Gulf Drilling International Ltd (a JV of GISS) for using the offshore drilling rigs – Al-Doha and Al- Zubarah – (GDI) in QPI’s offshore fields. The contracts are for a five-year extension of both offshore rigs’ existing contracts, which will end in 2018. (QE) GWCS signs MoU with Saudi-based Al Othman to establish logistics village – The Gulf Warehousing Company (GWCS) has signed a MoU with Saudi-based Al Othman Holding Company to establish a limited liability company in Saudi Arabia for the construction of a logistics village similar to the Logistics Village in Qatar. This partnership will offer GWCS a 49% stake in the newly formed company, with Al Othman Holding taking the remaining 51% stake. Meanwhile, GWCS along with Al Othman Holding is currently undertaking a feasibility study for the project in order to draft the final contract for the intended company. (QE)
- 6. Qatar Monthly Economic Monitor 1 st July 2013 Page 6 of 11 National Accounts Nominal GDP (QR bn) 2009 2010 2011 2012 Q1 13 YoY% QoQ% Total 356.0 455.4 624.2 700.3 185.4 6.1% 2.5% Oil & Gas 159.5 239.7 370.2 404.7 106.8 1.5% 5.1% Non-Oil 196.5 215.7 254.0 295.6 78.6 13.2% -0.8% Agriculture and Fishing 0.4 0.5 0.6 0.6 0.2 9.1% 4.2% Industry 60.9 70.4 87.4 102.5 26.9 14.0% -4.5% Manufacturing 33.6 40.8 56.7 68.9 17.1 11.6% -12.3% Electricity, Gas and Water 1.8 2.1 2.4 2.6 0.5 14.1% -15.0% Construction 25.5 27.5 28.3 31.0 9.1 19.0% 15.3% Services 132.1 140.9 162.1 188.1 50.7 13.0% 1.3% Trade, Restaurants and Hotels 29.8 31.5 35.6 39.5 9.6 13.2% -10.3% Transport and Communications 16.2 18.1 21.0 23.4 6.3 8.5% 4.5% Financial and Business Services 58.1 60.3 65.6 71.2 19.9 8.4% 6.7% Social Services 4.1 4.5 5.0 5.7 1.5 14.1% 4.0% Government Services 32.1 37.4 46.2 60.9 16.5 17.5% 0.9% Household Services 1.8 1.9 2.0 2.3 0.7 19.3% 7.7% Imputed Bank Service Charges -10.2 -12.7 -13.4 -14.8 -3.9 1.8% 0.0% Import Duties 3.1 3.8 3.9 4.3 1.0 3.9% -4.0% Source: QSA Real GDP (% change, YoY) 2009 2010 2011 2012 Q4 12 Q1 13 QoQ% Total 12.0 16.7 13.0 6.2 6.6 6.2 1.6 Oil & Gas 4.5 28.9 15.7 1.7 0.1 0.8 2.2 Non-Oil 17.6 8.6 10.8 10.0 11.8 10.6 1.1 Agriculture and Fishing -17.0 19.7 5.4 4.5 7.2 5.9 3.0 Industry 6.1 23.4 14.0 4.6 14.3 11.9 3.5 Manufacturing 13.7 17.6 10.4 11.8 18.0 12.5 1.6 Electricity, Gas and Water -0.4 13.5 7.9 10.5 12.5 8.6 -15.2 Construction 6.9 9.5 10.5 10.6 11.5 11.7 6.3 Services 21.9 6.9 10.3 9.2 10.6 10.1 -0.2 Trade, Restaurants and Hotels 15.7 2.5 12.9 7.7 8.9 10.5 -11.0 Transport and Communications 22.7 10.2 12.4 12.1 14.2 7.9 2.5 Financial and Business Services 25.8 7.4 6.3 6.7 7.2 10.5 5.8 Social Services 21.5 1.9 3.0 7.9 9.0 9.3 2.3 Government Services 23.6 8.7 13.1 11.5 11.9 9.4 0.2 Household Services 4.3 2.2 0.8 6.0 5.6 8.5 5.2 Imputed Bank Service Charges 1.0 3.3 16.4 8.0 4.5 4.9 1.3 Import Duties -11.3 17.8 -1.1 13.7 4.1 1.0 -4.7 Source: QSA N.B. Data which is new or revised this month is shown in red.
- 7. Qatar Monthly Economic Monitor 1 st July 2013 Page 7 of 11 Balance of Payments Balance of Payments (USD bn) 2009 2010 2011 2012 Q1 13 QoQ% YoY% Current Account Balance 6.4 23.8 52.0 62.3 19.6 43.3% 24.4% Trade Balance (Goods) 25.6 53.9 87.4 102.9 28.3 11.1% 7.5% Exports 48.0 74.8 114.3 133.7 35.7 7.7% 4.5% Imports -22.5 -20.9 -26.9 -30.8 -7.4 -3.7% -5.7% Invisibles -19.2 -30.1 -35.4 -40.6 -8.7 -26.1% -18.4% Services -3.9 -5.8 -9.5 -14.0 -3.2 -20.3% 2.2% Income -9.4 -12.9 -13.3 -12.1 -2.7 -25.0% -24.8% Transfers -5.8 -11.4 -12.7 -14.5 -2.9 -32.5% -28.8% Capital & Financial Account Balance 0.6 -10.7 -62.6 -44.5 -13.9 -21% 44% Capital Account -1.8 -2.1 -3.6 -6.2 -1.0 -50% -41% Financial Account 2.4 -8.6 -59.0 -38.3 -12.9 -17% 62% Direct Investment (outwards) -3.2 -1.9 -6.0 -1.8 -0.2 -91% -112% Direct Investment (into Qatar) 8.1 4.7 -0.1 0.3 0.3 -162% -669% Portfolio investment (net) - - - 2.8 -4.5 99% -212% Source: QCB, QSA, UNCTAD; Note: Not all Balance of Payment lines are shown in the table Top 5 Export Destinations (USD bn) 2009 2010 2011 2012 Q4 12 QoQ% YoY% Japan 14.5 19.7 27.4 32.6 7.1 -19.3% -12.0% Korea 7.6 10.8 18.9 23.2 5.5 -7.5% 3.7% India 3.7 5.6 10.3 14.7 4.1 24.9% 58.9% European Economic Community (EEC) 4.0 9.1 16.9 11.8 2.6 0.1% -34.3% China 1.2 2.2 4.3 7.0 1.5 -28.5% -2.5% Top 5 Import Sources (USD bn) 2009 2010 2011 2012 Q4 12 QoQ% YoY% European Economic Community (EEC) 8.1 7.1 6.6 7.4 2.1 21.1% 31.8% United States 3.1 3.5 3.1 3.9 1.8 159.2% 85.4% United Arab Emirates 1.8 2.3 3.0 3.2 0.8 0.0% 6.3% Saudi Arabia 1.3 1.7 2.2 2.4 0.6 0.0% 6.3% United Kingdom 1.1 1.4 1.5 1.8 0.4 6.5% 67.6% Source: IMF Direction of Trade Statisics - sometimes differ from QSA Crude oil (USD / barrel) 2009 2010 2011 2012 May-13 MoM% YoY% Oil production ('000 bpd) 781.0 733.0 734.0 733.7 723.0 -0.6% -1.2% Qatar average price 62.0 77.7 108.4 111.2 101.4 -1.6% -6.8% Dukhan 62.6 78.4 109.7 111.8 102.4 -1.9% -6.4% Marine 61.6 77.2 107.5 110.6 101.0 -1.5% -7.0% Source: OPEC (Direct communications), Reuters
- 8. Qatar Monthly Economic Monitor 1 st July 2013 Page 8 of 11 Budget, Population, Money & Prices Government Budget 2008/09 2009/10 2010/11 2011/12 Q4 12 QoQ% YoY% Balance 41.3 53.7 13.2 37.6 8.2 % of GDP 10.0% 15.2% 3.0% 8.7% 0.0% Revenue 140.6 168.8 155.5 203.4 51.5 -62% -7.7% Expenditure 99.2 115.0 142.4 165.8 43.3 6.3% -14.6% Population (m people in Qatar) 2009 2010 2011 2012 Jun-13 MoM% YoY% Total 1.64 1.72 1.73 1.83 1.92 -2.4% 11.3% Male 1.27 1.30 1.30 1.37 1.44 -0.7% 10.6% Female 0.37 0.42 0.43 0.46 0.48 -7.1% 13.3% Source: QSA; Monthly data based on number of people in Qatar and annual data based on residency Inflation (% ch, 12mth average YoY) 2009 2010 2011 2012 May-13 MoM% YoY% Overall (weights shown below) -4.9 -2.4 1.9 1.9 2.8 -0.1 3.5 Food, beverages & tobacco (13.2%) 1.3 2.1 4.3 3.7 3.4 0.2 2.4 Clothing & footwear (5.8%) -4.5 -1.3 7.5 2.8 1.4 0.3 0.7 Rents, water & maintenance (32.2%) -12.0 -12.8 -4.8 -3.3 1.6 0.0 6.5 Furniture, textiles & appliances (8.2%) -2.0 4.1 2.9 4.9 4.4 -0.2 1.8 Health care (2.0%) 1.7 3.5 2.6 1.5 1.7 0.0 2.5 Transport & communication (20.5%) -4.4 2.6 6.4 2.2 2.2 0.2 1.9 Entertainment, leisure & culture (10.9%) -1.2 2.9 2.0 6.0 6.8 -0.1 7.0 Miscellaneous goods & services (7.2%) 7.3 4.7 5.6 4.8 1.9 -1.2 -1.2 Source: QSA Money Supply (QR bn) 2009 2010 2011 2012 May-13 MoM% YoY% Broad money (M2) 215.1 264.7 310.0 381.1 439.4 -0.1% 34.0% M1 53.1 68.3 81.8 90.9 106.4 2.7% 26.2% Quasi-money 162.0 196.4 228.1 290.1 333.0 -0.9% 36.8% Interest rates (%, end period) 2009 2010 2011 2012 May-13 MoM bp YoY bp QCB deposit 2.00 1.50 0.75 0.75 0.75 0.0 0.0 QCB lending 5.50 5.50 4.50 4.50 4.50 0.0 0.0 Interbank overnight 2.01 1.39 0.74 0.77 0.66 -4.2 -10.5 Demand deposit 1.99 1.34 0.62 0.65 0.64 -2.9 -5.4 Overdraft 8.75 8.19 7.42 6.63 6.70 13.5 -56.4 Credit card 20.00 19.92 10.69 9.11 8.35 -1.1 -84.8 Source: QCB
- 9. Qatar Monthly Economic Monitor 1 st July 2013 Page 9 of 11 Banking Sector Snapshot : April 2013 Review and Outlook Banking Sector Index vs. QE All Share Index Deposits dropped 2.4% MoM (+11.5% YTD) while loans increased 1.2% MoM (+5.5% YTD) in the month of May 2013. Hence, the sector loan-to-deposit ratio (LDR) climbed to 105% in May 2013 versus 102% at end–April 2013 (111% in December 2012). Furthermore, the domiciled LDR for the sector followed suit and stood at 98% versus 94% in April. Liquidity remains healthy when compared to 2Q2012 (current LDR of 105% versus the 2012 high of 124% in April 2012). We forecast loan growth in the range of 15-20% for 2013. However, we expect NIMs to remain under some pressure throughout 1H 2013 with some stabilization expected during 2H2013. The public sector witnessed a contraction in deposits in the month of May. Delving into segment details, public sector deposits dropped by 7.4% MoM (+7.7% YTD). The semi- government institutions segment gained by 5.9% MoM (+0.4% YTD). However, the government segment experienced a contraction of 22.7% MoM (-13.3% YTD). Further, the government institutions segment (represents 64% of public sector deposits) also receded by 4.6% MoM (+18.9% YTD). On the other hand, private sector deposits outpaced the public sector and inched up by 1.4% MoM (+15.9% YTD). The consumer segment grew modestly by 2.7% MoM (+15.8% YTD), while the companies & institutions segment exhibited flat performance MoM (+16.0% YTD). Overall, total deposits (including deposits outside of Qatar) slipped by 2.4% MoM (+11.5% YTD). It should be noted that most of the growth in deposits during 2012 was realized in May and July of last year. The overall loan book ticked up by 1.2% MoM (+5.5% YTD). Total domestic public sector loans grew monthly across the board by 4.7% MoM (+6.2% YTD). This growth was driven by all the public sector sub-segments. The semi-government institutions segment grew by 5.6% MoM (-9.8% YTD). Also, the government institutions segment (represents 65% of public sector deposits) climbed by 3.7% MoM (+8.7% YTD). We continue to expect growth in public sector loans to pick up in the coming months and then grow thereafter as project mobilizations pick up. It should be noted that public sector loans expanded by 26% QoQ in 2Q2012. Private sector loans slipped by 1.0% MoM (+3.2% YTD). Consumption and others (contributes 30.1% to private sector loans) and services loans contracted MoM; the former sub- segment receded by 1.2% MoM but was up 2.5% YTD, while the latter contracted by 7.8% MoM but is still up 25.3% YTD. On the other hand, real estate was flat MoM (-7.4% YTD) and general trade increased 3.7% MoM (+3.9% YTD). Specific loan-loss provisioning rested at 1.3% of average trailing 12-months loans vs. 1.4% in April, indicating improvement. Source: Bloomberg Banking Sector - Loan to Deposit (LTD) Source: Qatar Central Bank (QCB) Loan Pie (April 2013) Source: QCB 80 85 90 95 100 105 110 115 120 125 130 31-Dec-2011 10-Feb-2012 22-Mar-2012 2-May-2012 12-Jun-2012 23-Jul-2012 2-Sep-2012 13-Oct-2012 23-Nov-2012 3-Jan-2013 13-Feb-2013 26-Mar-2013 6-May-2013 16-Jun-2013 QEAll Share Index QE Banks & Financial Services Index - 150,000 300,000 450,000 600,000 50% 70% 90% 110% 130% Sep-11 Oct-11 Nov-11 Dec-11 Jan-12 Feb-12 Mar-12 Apr-12 May-12 Jun-12 Jul-12 Aug-12 Sep-12 Oct-12 Nov-12 Dec-12 Jan-13 Feb-13 Mar-13 Apr-13 May-13 QRmn LoantoDepositRatio Loans Deposits Loan to Deposit Ratio 7% 43% 50% International Public Sector PrivateSector
- 10. Qatar Monthly Economic Monitor 1 st July 2013 Page 10 of 11 Banking Sector Indicators (In QR mn) 2012 Jan-13 Feb-13 1Q-13 Apr-13 May-13 Change MoM Change YTD Total Assets 820,512 828,418 826,556 848,293 865,125 875,192 1.2% 6.7% Total Credit (Loans) 510,048 511,162 505,599 517,690 531,663 538,241 1.2% 5.5% Total Deposits 458,066 477,512 481,987 486,662 522,883 510,531 -2.4% 11.5% Loan to Deposit Ratio 111% 107% 105% 106% 102% 105% N/A N/A Credit Facilities (Geographic) Total Domestic Credit 478,305 478,652 471,794 479,776 492,512 500,233 1.6% 4.6% Total International Credit 31,743 32,510 33,805 37,914 39,151 38,007 -2.9% 19.7% Domestic Credit Facilities - Public Sector Government 51,746 55,203 48,021 49,964 52,143 55,887 7.2% 8.0% Government Institutions 139,585 134,555 135,628 137,306 146,258 151,697 3.7% 8.7% Semi-Government Institutions 27,222 26,762 26,490 20,004 23,259 24,566 5.6% -9.8% Total Domestic Public Sector Credit 218,553 216,520 210,139 207,274 221,660 232,150 4.7% 6.2% 0.653 Domestic Credit Facilities - Private Sector General Trade 33,280 34,052 33,971 33,337 33,330 34,566 3.7% 3.9% Industry 9,339 9,332 10,128 9,703 9,679 10,080 4.1% 7.9% Contractors 16,546 16,877 17,531 17,434 17,806 17,982 1.0% 8.7% Real Estate 85,562 87,615 86,732 86,245 78,984 79,223 0.3% -7.4% Consumption & Others 78,587 76,850 78,278 87,127 81,532 80,563 -1.2% 2.5% Services 36,438 37,407 35,014 38,657 49,520 45,669 -7.8% 25.3% Total Domestic Private Sector Credit 259,752 262,132 261,655 272,502 270,852 268,084 -1.0% 3.2% 0.3005 Deposit Details (Geographic) Resident Deposits 417,337 435,269 437,644 444,944 480,701 468,915 -2.5% 12.4% Non-resident Deposits 40,729 42,243 44,343 41,718 42,183 41,616 -1.3% 2.2% Deposits - Public Sector (Domestic) Government 44,557 46,773 37,503 36,666 49,977 38,640 -22.7% -13.3% Government Institutions 104,378 112,029 120,391 121,899 130,148 124,134 -4.6% 18.9% Semi Government Institutions 31,794 31,763 32,710 26,123 30,142 31,919 5.9% 0.4% Total Public Sector Deposit 180,729 190,565 190,604 184,688 210,267 194,693 -7.4% 7.7% Deposits - Private Sector (Domestic) Personal 116,257 116,831 118,006 126,938 131,054 134,658 2.7% 15.8% Companies & Institutions 120,350 127,873 129,035 133,317 139,379 139,564 0.1% 16.0% Total Private Sector Deposit 236,607 244,704 247,040 260,255 270,434 274,222 1.4% 15.9% Source: QCB
- 11. Qatar Monthly Economic Monitor 1 st July 2013 This report is produced by QNB Group’s Economics Team in collaboration with QNB Financial Services. Past issues are available online at http://tinyurl.com/QatarMonitor. For questions, or to receive it by email each month, please contact: QNB Economics QNB Group Tel: (+974) 4453 4642 economics@qnb.com.qa Saugata Sarkar Head of Research, QNBFS Tel: (+974) 4476 6534 saugata.sarkar@qnbfs.com.qa Ahmed M. Shehada Head of Trading, QNBFS Tel: (+974) 4476 6535 ahmed.shehada@qnbfs.com.qa Keith Whitney Head of Sales, QNBFS Tel: (+974) 4476 6533 keith.whitney@qnbfs.com.qa DISCLAIMER: This publication has been prepared by Qatar National Bank (“QNB”) and QNB Financial Services SPC (“QNBFS”), a wholly-owned subsidiary. QNB is regulated by the Qatar Central Bank, QNBFS is regulated by the Qatar Financial Markets Authority and the Qatar Exchange. This publication expresses the views and opinions of QNB Group and QNBFS at a given time only. It is not an offer, promotion or recommendation to buy or sell securities or other investments, nor is it intended to constitute legal, tax, accounting, or financial advice. We therefore strongly advise potential investors to seek independent professional advice before making any investment decision. Although the information in this report has been obtained from sources that are believed to be reliable, we have not independently verified all such information and it may not be accurate or complete. While this publication has been prepared with the utmost degree of care by our analysts, no warranties are provided as to the accuracy and completeness of the information it may contain, and any liability in that respect is declined. QNB/QNBFS reserve the right to amend the views and opinions expressed in this publication at any time. They may also express viewpoints or make investment decisions that differ significantly from, or even contradict, the views and opinions included in this report. COPYRIGHT: This report is distributed on a complimentary basis to valued business partners of QNB. It may not be reproduced in whole or in part without permission. Qatar Exchange Market Performance Source: Bloomberg, * Trailing Twelve Months Company Name Price (June 30) % Change 5-Day % Change Monthly Market Cap. QR Million TTM P/E P/B Div. Yield Qatar National Bank 157.40 (1.01) 0.00 110,137 13.0 2.4 3.8 Qatar Islamic Bank 68.10 (0.44) 0.00 16,092 14.1 1.5 5.5 Commercial Bank of Qatar 69.70 0.29 0.00 17,247 8.4 1.2 8.6 Doha Bank 46.90 (0.53) 0.00 12,118 8.0 1.1 8.8 Al Ahli Bank 57.00 0.00 0.00 7,243 13.9 2.3 5.3 Qatar International Islamic Bank 53.90 1.13 0.00 8,159 11.8 1.7 6.5 Masraf Al Rayan 27.60 (0.36) 0.00 20,700 13.3 2.2 3.6 Al Khaliji Bank 16.90 1.50 0.00 6,084 11.7 1.1 5.9 National Leasing 37.10 (0.67) 0.00 1,836 8.9 1.4 5.4 Dlala Holding 26.75 (0.74) 0.00 594 23.1 2.5 N/A Qatar & Oman Investment 13.69 1.33 0.00 431 21.9 1.4 3.7 Islamic Holding Group 43.10 0.00 0.00 172 27.7 4.1 2.6 Banking and Financial Services 200,813 Zad Holding 59.60 0.00 0.00 780 7.4 0.6 6.7 Qatar German Co. for Medical Devices 16.07 1.13 0.00 186 N/M 1.0 N/A Salam International Investment 13.00 0.00 0.00 1,486 21.8 0.9 5.4 Medicare Group 42.30 0.00 0.00 1,190 25.8 1.5 4.3 Qatar Cinema & Film Distribution 55.00 0.00 0.00 314 27.5 2.4 3.6 Qatar Fuel 253.00 0.40 0.00 16,437 14.3 3.1 4.0 Qatar Meat and Livestock 63.40 (0.16) 0.00 1,141 15.1 4.0 6.3 Al Meera Consumer Goods 136.60 0.89 0.00 2,732 17.7 2.3 5.9 Consumer Goods and Services 24,266 Qatar Industrial Manufacturing 54.00 5.88 0.00 2,138 10.9 1.7 5.6 Qatar National Cement 104.00 5.05 0.00 5,106 12.0 2.3 5.8 Industries Qatar 157.60 (0.57) 0.00 95,348 10.5 3.4 4.9 Qatari Investors Group 26.85 (0.56) 0.00 3,338 19.5 1.7 2.8 Qatar Electricity and Water 158.90 1.15 0.00 15,890 11.8 3.3 4.6 Mannai Corp. 88.00 0.00 0.00 4,014 8.5 1.9 5.4 Aamal 14.41 (0.07) 0.00 8,646 14.1 1.3 N/A Gulf International Services 41.10 (1.32) 0.00 6,110 12.0 2.4 3.6 Industrials 140,592 Qatar Insurance 61.00 0.00 0.00 7,834 9.0 1.2 3.3 Doha Insurance 25.55 (1.73) 0.00 658 10.9 1.4 3.6 Qatar General Insurance & Reinsurance 46.60 (2.31) 0.00 2,686 14.7 1.0 1.9 Al Khaleej Takaful Insurance 44.50 0.00 0.00 760 10.2 1.4 1.9 Qatar Islamic Insurance 62.20 0.00 0.00 933 15.8 3.9 5.6 Insurance 12,871 United Development 23.00 (0.43) 0.00 7,756 9.7 0.8 4.3 Barw a Real Estate 26.55 (0.93) 0.00 10,331 12.6 0.8 5.6 Ezdan Real Estate 17.49 0.00 0.00 46,392 N/M 1.7 0.7 Mazaya Qatar Real Estate Development 11.32 (0.18) 0.00 1,132 20.7 1.0 5.3 Real Estate 65,612 Qatar Telecom 120.80 0.25 0.00 38,695 12.2 1.6 4.1 Vodafone Qatar 9.10 0.44 0.00 7,693 N/M 1.2 N/A Telecoms 46,388 Qatar Navigation (Milaha) 72.00 0.14 0.00 8,246 9.2 0.8 5.2 Gulf Warehousing 41.15 (1.44) 0.00 1,957 22.4 2.7 N/A Qatar Gas Transport (Nakilat) 18.30 0.05 0.00 10,248 13.2 6.0 5.5 Transportation 20,451 Qatar Exchange 510,993