Richmond Fed District Survey Results, October 2013
•
1 gostou•717 visualizações

October 2013 updated release of economic survey results for Federal Reserve Bank of Richmond (Fifth District)

Recomendados
Recomendados
Mais conteúdo relacionado
Mais de PublicFinanceTV
Mais de PublicFinanceTV (20)
Último
Último (20)
Richmond Fed District Survey Results, October 2013
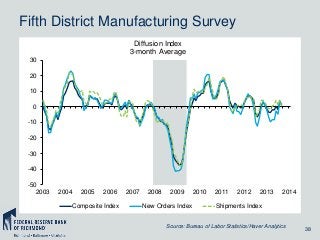
- 1. Fifth District Manufacturing Survey Diffusion Index 3-month Average 30 20 10 0 -10 -20 -30 -40 -50 2003 2004 2005 2006 Composite Index 2007 2008 2009 New Orders Index 2010 2011 2012 2013 2014 Shipments Index Source: Bureau of Labor Statistics/Haver Analytics 38
- 2. Fifth District Manufacturing Survey Diffusion Index 3-month Average 20 10 0 -10 -20 -30 -40 -50 2003 2004 2005 2006 2007 2008 Composite Index 2009 2010 2011 Employment Index 2012 2013 Source: The Federal Reserve Bank of Richmond 2014 39
- 3. Fifth District Service Sector Survey Diffusion Index 3-month Average 30 20 10 0 -10 -20 -30 -40 2003 2004 2005 2006 2007 2008 2009 2010 2011 2012 2013 2014 Service Sector Revenues Index Source: The Federal Reserve Bank of Richmond 40
- 4. Fifth District Service Sector Survey—Retail Diffusion Index 3-month Average 30 20 10 0 -10 -20 -30 -40 2003 2004 2005 2006 2007 2008 Retail Revenues Index 2009 2010 2011 2012 2013 2014 Retail Employment Index Source: The Federal Reserve Bank of Richmond 41
- 5. Fifth District Service Sector Survey— Non-Retail Diffusion Index 3-month Average 30 20 10 0 -10 -20 -30 -40 2003 2004 2005 2006 2007 2008 Non-retail Revenues Index 2009 2010 2011 2012 2013 2014 Non-retail Employment Index Source: The Federal Reserve Bank of Richmond 42
- 6. Survey Comparison Richmond Manufacturing Survey and ISM Manufacturing Survey 40 70 30 65 20 60 10 55 0 50 -10 45 -20 40 -30 35 -40 30 -50 25 -60 2003 2004 2005 2006 2007 2008 2009 Richmond Manufacturing Survey (Left Axis) 2010 2011 2012 2013 20 2014 ISM Manufacturing (Right Axis) Source: Federal Reserve Bank of Richmond/Institute of Supply Management 43
- 7. Survey Comparison Richmond Service Sector Survey and ISM Nonmanufacturing Survey 40 65 30 60 20 55 10 0 50 -10 45 -20 40 -30 -40 2003 2004 2005 2006 2007 2008 2009 Richmond Service Sector Survey (Left Axis) 2010 2011 2012 2013 35 2014 ISM Nonmanufacturing (Right Axis) Source: Federal Reserve Bank of Richmond/Institute of Supply Management 44