

Recomendados
Mais conteúdo relacionado
Destaque
Destaque (20)
Final
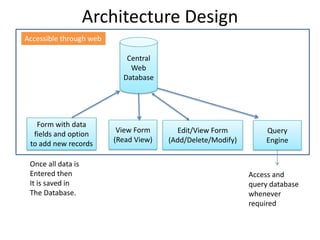
- 1. Architecture Design Accessible through web Central Web Database Form with data fields and option View Form Edit/View Form Query to add new records (Read View) (Add/Delete/Modify) Engine Once all data is Entered then Access and It is saved in query database The Database. whenever required
- 2. Step 1: Date Range Start Date (22- End Date (22-11- View Type Filter: 11-2011) 2011) (Data/Chart) Wrong embroidery / beeds/ printing mrjh gqbZ /VwVh / VsMh&esMh Slip/ broken/ uneven top stitch xyr ,sEcjkSbMjh/ chMzl/ QSfczd QkWYV Total Inspected Pieces fcuk dVss / [kqys /kkxs dqy bUliSfDVM ihl Puckering / Pinching Mending / Touching Total Defective Pcs Percentage Defective eSfUMax / Vfpax dPpk vksojykSd xyr ihl dk izfr'kr Ikdfjax / fifUpax Uncut/ Loose Thread TokbUV vkmV cSysUl vkmV yscy vVSpesUV Label Attachment Color variation dyj oSfj,'ku Total passed pcs Raw overlock dqy xfYr;kWa Balance Out dqy xyr ihl Fabric Fault dfPp flykb Total Defects Raw Stitch dqy ikl ihl ikVZ PksUt Part Change fizfUVUx Joint Out Mh ,p ;w jksfiax Roping LVsUl flykbZ Quantity Stains Others D.H.U. Order vU; Style Number 1 2 3 4 5 6 7 8 9 10 11 12 13 14 15 16 #DIV/0! FRESA DRESS 2 41 2329 87 6 377 77 1300 40 109 774 352 1351 6736 10329 5863 4466 65.21 56.76 NICY DRESS 2 1 816 63 5 1429 559 37 277 26 414 3592 9736 3111 6625 36.89 31.95 MIMOBROSKIRT 20 2452 13 73 1345 2803 866 26 1126 146 188 9032 13921 6962 6959 64.88 50.01 NICY SHIRT 680 16 3 11 546 44 10 58 5 218 1581 3991 1352 2639 39.61 33.88 FELICITY 1 42 245 3 339 7 Default data for previous day 28 4 669 1264 585 679 52.93 46.28 NICY DRESS 2 1 816 63 5 1429 559 37 277 26 414 3592 9736 3111 6625 36.89 31.95 BLANCA SHORT 12 20 17 7 10 66 128 59 69 51.56 46.09 MARIMICHEMGA #DIV/0! MARLEY DRESS 5 160 410 281 4 69 3 80 1012 1811 849 962 55.88 46.88 FAZIL JKT 5 20 11 1 15 52 76 28 48 68.42 36.84 BAJA MESH BAG 2 69 2 19 5 97 751 97 654 12.92 12.92 SOLID TULAM STRIPE #DIV/0! MARLEY TOP 7 23 229 232 70 561 740 359 381 75.81 48.51 21125710 1 2 101 15 172 4 21 1 7 324 613 241 372 52.85 39.31 MISCHA #DIV/0! 21125712 #DIV/0! FLAVICOMBFI 13 17 20 1 29 80 181 62 119 44.20 34.25 FRESA DRESS 2 41 2329 87 6 377 77 1300 40 109 774 352 1351 6736 10329 5863 4466 65.21 56.76 JASTIN STRIPE #DIV/0! Total 15 155 9983 346 12 858 2258 9881 2143 3502 911 4066 34130 63606 28542 35064 53.66 44.87 D.H.U. 0.02 0.24 15.70 0.54 0.02 1.35 3.55 15.53 3.37 5.51 1.43 6.39 Add new Edit Interactive Charts Generate Report data
- 3. Description of Step 1 In this view we see the default data for the previous date. This view is a read only view, if we want to edit data in it then we have to click on the edit button & make changes as per our need. Once editing is done then we have to click on update so as to update the data. If we want to delete any data from the database then we have to click on delete button. If we want to add new data then we have to click on add new data. Then it will open a new view where have to specify the date then we have to enter the data. Interactive charts includes various charts like pie chart , bar graphs, column, bubble etc. in order to analyze data easily
- 4. While making interactive charts we have to specify the respective columns on x-axis and y- axis and also we have to specify the scale in which we want to see our chart. We can Generate Report by applying appropriate filters like if we want to generate a report between 21 march 2011 to 21 June 2011 then we write queries to fetch the whole data between the above dates in order to generate a report. Note: My task is to analyze the historical data which is stored in the web database, In order to analyze it we have to generate reports. For that we have to write queries to fetch data from web database online. In order to analyze the data more effectively we need to generate reports. From our centralized database we can fetch values and generate reports for any time period we decide on.
- 5. Interactive Charts/Graphs After entering the values we can see the graph / chart based on entered data so as to analyze it properly. View Type Back (Data/Chart) Bar graph showing stylewise D.H.U. D.H.U. and Percentage Defective Percentage Defective 80.00 75.81 68.42 D.H.U. and Pe rce ntage De fective 70.00 65.21 64.88 65.21 60.00 56.76 55.88 56.76 52.93 51.56 52.85 50.01 48.51 50.00 46.28 46.09 46.88 44.20 39.61 39.31 40.00 36.89 36.89 36.84 33.88 34.25 31.95 31.95 30.00 20.00 12.92 12.92 10.00 0.000.00 0.000.00 0.000.00 0.000.00 0.000.00 0.000.00 0.00 FLAVICOMBFI MARLEY TOP FRESA DRESS BAJA MESH JASTIN STRIPE FRESA DRESS 21125710 21125712 BLANCA FAZIL JKT MARIMICHEMG TULAM STRIPE MISCHA NICY DRESS NICY DRESS MARLEY MIMOBROSKIR FELICITY NICY SHIRT Controlled Document: www.rajeshbheda.com © Copyright Rajesh Bheda Consulting 2011 BAG SOLID SHORT DRESS Style Number A T
- 6. Interactive Charts: Add all parameters Add all parameters Formula Type Chart (Median Type , Performanc (Column, Bar, e , Error Bar, Rate Pie, Stock) Start Date End Date of change etc.) (22-11-2011) (22-11-2011) Preview of the chart Create chart
- 7. Description of Interactive Charts In interactive charts firstly we specify all our parameters to which we want to make the analyses. After specifying all the parameters we click on type of chart , in the list we see various chart types like column , bar , pie , stock etc. and select which we want to make. Then we select the formula type like media , rate of change , error bar etc. Then we select the date between which we want to see the chart. After making all this we can see the preview of the chart , if its okay then we click on create chart button.
- 8. R44 Total D.H.U. EVALA FAMKE STARLING MONSOON FARLEK TOP AMORPANTFI AMORBLOUFI Style Number LIBBY BLOUSE ROSANA SKIRT STARLING CAMI Step 2: FEATHER DRESS Controlled Document: Order Quantity Save data Fabric Fault 1 QSfczd QkWYV Color variation 2 dyj oSfj,'ku Slip/ broken/ uneven top stitch 3 mrjh gqbZ /VwVh / VsMh&esMh Enter date flykbZ Roping 4 jksfiax Puckering / Pinching 5 Ikdfjax / fifUpax Joint Out 6 TokbUV vkmV Raw Stitch 7 dfPp flykb Balance Out 8 cSysUl vkmV Raw overlock 9 dPpk vksojykSd Wrong embroidery / beeds/ printing 10 xyr ,sEcjkSbMjh/ chMzl/ fizfUVUx Back Stains 11 LVsUl Label Attachment 12 www.rajeshbheda.com yscy vVSpesUV Uncut/ Loose Thread 13 fcuk dVss / [kqys /kkxs Mending / Touching 14 eSfUMax / Vfpax Part Change 15 ikVZ PksUt Others 16 vU; Total Defects dqy xfYr;kWa Total Inspected Pieces dqy bUliSfDVM ihl Total Defective Pcs dqy xyr ihl Total passed pcs dqy ikl ihl D.H.U. ! Mh ,p ;w #VALUE Cancel Percentage Defective xyr ihl dk izfr'kr #DIV/0! #DIV/0! #DIV/0! #DIV/0! #DIV/0! #DIV/0! #DIV/0! #DIV/0! #DIV/0! #DIV/0! #DIV/0! #DIV/0! #DIV/0! #DIV/0! #DIV/0! #DIV/0! #DIV/0! #DIV/0! #DIV/0! #DIV/0! © Copyright Rajesh Bheda Consulting 2011
- 9. Description of Step 2 The above form appears when we click on the add new data button in the Step 1. First we enter data on specified date and on saving it will stored in web database in the above specified date. The form should be similar to that of the excel view. Above is the screen shot of the form with data fields. I need the interface like this and i just want to protect the formulas used in it so that no one can view and change the formulas which are there in it. The user just need to enter its data and automatically it will display the required results using those formulas. On clicking the back button we go back to the default read only view as shown in Step 1.
- 10. Calculations to be displayed Yellow Colored Cells = Where we have to enter the data Grey Colored Cells = Where automatically data will comes using the formulas. We cant edit or change the grey colored cells. Below are the formulas used : 1. DHU= Total Defects/Total Inspected Pieces*100 2. Percentage Defective = Total Defected Pieces/Total Inspected Pieces*100 3. Total Passed Pieces= Total Inspected Pieces – Total Defected Pieces
- 11. Centralized Web Database: I want to save the data in a database that is online preferably if such feature is available in SharePoint online then please suggest or else suggest me with alternatives.