Mais conteúdo relacionado
Semelhante a DITMoHedgeStrategyMonthly-May12-Issue103 (20)
DITMoHedgeStrategyMonthly-May12-Issue103
- 1. Hedge Strategy
Monthly
May 2012, Issue #10r
Hedge Strategies and Indexes
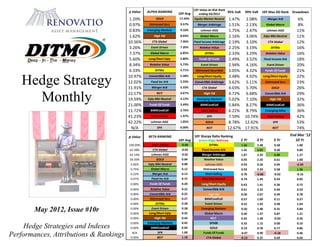
Performances, Attributions & Rankings
10Y Sharpe Ratio Ranking
Green=High; Red=Low 1 Yr 3 Yr 5 Yr
End Mar ’12
10 Yr
DITMo 1.56 2.48 0.58 1.00
Fixed Income Arb 1.42 3.03 0.50 0.89
Merger Arbitrage 1.07 2.29 0.90 1.27
Relative Value 0.95 2.35 0.61 1.00
Lehman AGG 0.93 0.34 0.04 -0.20
Distressed Secs 0.93 2.39 0.58 1.36
Short Selling 0.78 -0.86 -0.02 -0.16
Eqty Mkt Neutral 0.74 1.49 0.24 0.85
Long/Short Equity 0.63 1.41 0.36 0.72
Convertible Arb 0.61 2.33 0.44 0.59
High Yld 0.58 2.07 0.49 0.78
BXMCovdCall 0.57 1.09 0.11 0.27
Event Driven 0.52 1.93 0.48 1.04
Emerging Markets 0.50 1.48 0.31 0.84
Global Macro 0.44 1.27 0.87 1.21
REIT 0.42 1.28 -0.03 0.26
SP500 0.33 1.15 0.00 0.10
GOLD 0.19 0.78 0.77 0.86
Funds Of Funds -0.07 0.90 -0.18 0.46
CTA Global -0.12 0.25 0.69 0.66
10Y Value-At-Risk Rank
ending 03/2012
95% VaR 99% VaR 10Y Max DD Rank Drawdown
Equity Market Neutral 1.47% 2.08% Merger Arb 6%
Merger Arbitrage 1.51% 2.13% Global Macro 8%
Lehman AGG 1.75% 2.47% Lehman AGG 11%
Global Macro 2.16% 3.06% Eqty Mkt Neutral 11%
Fixed Income Arbitrage 2.19% 3.10% CTA Global 12%
Relative Value 2.25% 3.19% DITMo 16%
DITMo 2.33% 3.29% Relative Value 16%
Funds Of Funds 2.49% 3.52% Fixed Income Arb 18%
Event Driven 2.94% 4.16% Event Driven 20%
Distressed Securities 3.05% 4.32% Funds Of Funds 21%
Long/Short Equity 3.48% 4.92% Long/Short Equity 22%
Convertible Arbitrage 3.62% 5.11% Distressed Secs 23%
CTA Global 4.03% 5.70% GOLD 26%
High Yld 4.72% 6.68% Convertible Arb 29%
Emerging Markets 5.02% 7.10% High Yld 32%
BXMCovdCall 5.84% 8.27% BXMCovdCall 36%
Short Selling 6.22% 8.79% Emerging Mkts 36%
SPX 7.59% 10.74% Short Selling 42%
GOLD 8.78% 12.42% SPX 53%
REIT 12.67% 17.91% REIT 74%
ALPHA RANKING 10Y Avg
GOLD 17.59%
Distressed Secs 9.57%
Emerging Markets 9.10%
High Yld 8.03%
CTA Global 7.36%
Event Driven 7.26%
Global Macro 6.85%
Long/Short Eqty 5.80%
Relative Value 5.73%
DITMo 5.71%
Convertible Arb 5.38%
Fixed Inc Arb 5.33%
Merger Arb 5.33%
REIT 4.67%
Eqty Mkt Neutral 4.12%
Funds Of Funds 3.49%
BXMCovdCall 2.76%
Short Selling 1.97%
Lehman AGG 1.05%
SPX 0.00%
BETA RANKING
10Y Avg
Short Selling -0.68
CTA Global -0.02
Lehman AGG -0.02
GOLD 0.04
Eqty Mkt Neutral 0.08
Global Macro 0.12
Merger Arb 0.13
Fixed Inc Arb 0.15
Funds Of Funds 0.20
Relative Value 0.22
Convertible Arb 0.25
Distressed Secs 0.27
DITMo 0.28
Event Driven 0.28
Long/Short Eqty 0.35
High Yld 0.43
Emerging Markets 0.45
BXMCovdCall 0.69
SPX 1.00
REIT 1.18
p Value
1.20%
0.97%
0.83%
1.62%
10.56%
3.26%
7.37%
5.60%
8.34%
6.33%
10.97%
12.02%
11.91%
22.17%
19.59%
21.00%
11.72%
41.23%
42.22%
N/A
p Value
100.00%
62.38%
62.14%
30.50%
5.66%
0.75%
0.22%
0.07%
0.00%
0.00%
0.00%
0.00%
0.00%
0.00%
0.00%
0.00%
0.00%
0.00%
N/A
0.00%
- 2. Prepared by: Pj de Marigny, DITMo Strategies Page 2 ©2012 RENOVATIO ASSET MANAGEMENT, LLC
Contents
VaR, Max Drawdown, Sharpe, Alpha/Beta Rankings…Cover Page
20 Index Risk/Return Summary (10,5,3,1 Year)...page 2
Disclosure, Sources & Methodology……………………..page 3
Manager Commentary………………….page 4
Attributions for 20 Indexes ………………….pages 5-6
Alpha, Beta, Correlation Annual and Significance Tests (10 Year)…page 7
Returns Bar Charts (10,5,3,1 Year)…...pages 8-9
Return vs Std. Deviation Bar Charts (10,5,3,1 Year)………pages 10-11
Universe Batting Average and Risk-Adjusted UBA…page 12
Correlations (10,5,3,1 Year)………pages 13-14
Scattergram (10Y Monthly Risk/Return)...page 15
Risk & Return Probabilities (10,5,3,1 Year)…..pages 16-19
VAMI Line Charts…………………………………….page 20
Return Ranking Color Matrices (04/02—03/12)...page 21
Hedge Strategy Definitions.............pages 22-23
End Mar ‘12
Annualized
Mo Std Dev
Convertible
Arbitrage
CTA Global
Dis-
tressed
Securities
Emerging
Markets
Equity Mar-
ket Neutral
Event Driven
Fixed Income
Arbitrage
Global Macro
Long/Short
Equity
Merger
Arbitrage
Relative
Value
Short
Selling
Funds Of
Funds
DITMo SP500
Lehman
AGG
BXMCovdCa
ll
High Yld REIT GOLD
10Yr Return 6.07% 7.17% 10.75% 10.51% 4.42% 8.31% 5.87% 7.38% 6.92% 5.87% 6.54% -1.14% 4.08% 6.73% 2.07% 0.93% 4.40% 9.34% 5.01% 18.61%
10Yr StdDev 7.62% 8.49% 6.43% 10.58% 3.10% 6.20% 4.61% 4.55% 7.33% 3.18% 4.75% 13.10% 5.24% 4.90% 15.99% 3.68% 12.31% 9.95% 26.68% 18.49%
5Yr Return 5.79% 6.88% 6.34% 5.08% 2.65% 5.18% 4.82% 6.09% 4.61% 4.83% 5.39% 0.40% 0.36% 5.12% -0.18% 1.85% 2.21% 7.53% -5.26% 20.24%
5Yr StdDev 10.15% 7.61% 8.19% 13.13% 4.10% 7.55% 6.34% 4.95% 8.70% 3.38% 6.11% 14.72% 6.45% 5.98% 19.10% 3.65% 14.88% 13.06% 34.59% 21.58%
3Yr Return 17.92% 3.34% 18.91% 17.97% 5.34% 14.43% 13.06% 7.43% 12.96% 7.05%
12.32
%
-11.05% 5.82% 11.07% 20.86% 2.67% 14.95% 22.70% 38.75% 21.98%
3Yr StdDev 6.45% 7.20% 6.66% 10.42% 2.36% 6.22% 3.52% 4.37% 7.64% 2.24% 4.28% 14.34% 4.47% 3.58% 16.23% 2.80% 11.93% 9.35% 27.26% 20.70%
1Yr Return 4.56% 0.71% 8.84% 7.09% 4.10% 5.44% 4.79% 3.64% 7.21% 4.80% 5.73% 13.86% 1.28% 7.91% 6.23% 4.15% 9.38% 6.75% 9.54% 16.48%
1Yr StdDev 4.68% 6.84% 7.57% 11.40% 3.14% 7.35% 2.10% 4.42% 8.94% 2.79% 4.13% 15.98% 5.10% 3.84% 16.82% 2.55% 14.33% 8.91% 23.77% 27.27%
- 3. Prepared by: Pj de Marigny, DITMo Strategies Page 3 ©2012 RENOVATIO ASSET MANAGEMENT, LLC
DISCLOSURE
“Deep-In-The-Money” Hedge Strategy Monthly report is intended for educational and discussion purposes only. Renovatio Asset Management is
structured as a registered investment advisor limited liability company located in Newport Beach, California offering investment management services.
Renovatio is not a wealth advisory or financial planner, neither is this material intended to offer financial advice or recommend any investment.
The material herein is offered without charge, fees, or expectation of receiving any remuneration, to financial professionals, students, industry
associations, and other interested parties. This material is offered without guarantee of accuracy in methodology or calculation and is not meant to imply
recommendation of any strategy reflected in this report. Source of thirteen Hedge Categories data provider is Edhec Risk Institute. Data provider for SPX
(SP500), BXM (CBOE SPX at-the-money Covered Call Index), WFBIX (proxy for Lehman/Barclay Aggregate Bond Index) and CSHY (Credit Suisse
High Yield Index) is Bloomberg, LP. “REIT” is Dow Jones U.S. Select REIT (benchmarking Wilshire REIT Index) used instead of NAREIT to account
for liquidity convenience. GOLD is the GOLDS Commodity Index. DITMo Model Index is a customized “Deep-In-The-Money” Buy/Write Model index
created by Pj de Marigny to establish a BENCHMARK for aggressive income objective Buy/Write portfolios that guides the design of DITMo portfolio.
Methodologies and calculations were developed by Pj de Marigny, DITMo Strategies, portfolio manager at Renovatio A.M., Newport Beach, California.
Pj’s 15 years of experience includes eight years at major brokerage wirehouses where he was a portfolio manager and the top producing consultant of the
S. Nevada combined branches of Smith Barney. He branded “DITMo” in March 2005 working as Treasurer for a former Private Wealth client. Pj is
Director of GARP (Global Assn of Risk Professionals, Publisher of Risk Professional Magazine), S. California Chapter.
Pj holds an M.S. in Banking & Financial Services Management (Boston University), an M.B.A. with QI Concentration (Colorado State University), a B.A.
in Biblical Studies (Ambassador College, Pasadena CA), and a B.S. in Accounting (St. Francis College, NYC). Pj is a member of the Wharton CPD
Circle and a Columnist for HedgeCo (W. Palm Beach, FL), a Hedge Fund Data/Services Provider. PJ does not advertise his professional certifications.
Please eMail pj@RenovatioAM.com for report enhancement suggestions, errata, general questions and comments.
DITMo®
is a Deep-In-The-Money, Short-expiry, Buy-Write Model Index that is reflective of a risk averse version of a covered call strategy. The
methodology for calculation is meant to capture changing sensitivity to the underlying long equity value and is calculated as follows:
DITMo MODEL METHODOLOGY:
This attribution is drawn solely from the sample model portfolio. Return attributions reflected here involved stress-testing the sample portfolio using Algorithms, then using those results in the formulation
of a return series based solely on the results of SP500 performance to capture up and down participation that differs within various return ranges typical of a covered call strategy payoff. The portfolio
includes 70 to 100 SP500 equity “Buy/Writes” typically written at a strike price below the market price of the underlying equity with intention to have the underlying equity called away thereby creating a
cash flow composed of exercised options, option premium, dividends and interest. There is no guarantee that the portfolio will exhibit similar attributes to this model or that the portfolio holdings will be
similar to the portfolio holdings reflected here. This is intended for one-on-one discussion purposes only. The model was constructed using equity ask price and short call bid price that would represent the
minimal acceptable trade net of execution and management fees.
The strategy is both a bottom-up and top-down approach contrived to target less than a one-third market beta (market risk) and an after-fee 8-10% return that are solely dependent on market performance.
Risks of strategy underperformance includes, but is not limited to a scenario of SP500 excessive performance within a month that will result in a muted upside capture of that performance. Similarly,
downside excessive loss of the SP500 in a given month is muted only within limited bounds cushioning only a moderate drawdown of the market in any given month. The strategy should be considered by
those willing to tradeoff upside participation for a limited amount of loss mitigation in any given month.
The model return series and resulting attributes were constructed according to the following methodology (per month):
SPX DITMo(Y)
<-10% +3.26% + .69(SPX)
=/-5% to =/–10% -.62% + .11(SPX)
-5% to 5% +.68% + .25(SPX)
=>5% +1.67% + .02(SPX)
- 4. Prepared by: Pj de Marigny, DITMo Strategies Page 4 ©2012 RENOVATIO ASSET MANAGEMENT, LLC
Portfolio Manager Commentary
The May 2012 commentary focuses on reasons to expect a controlled U.S. equity market drawdown to the EOY. “Commentary” has 4 topics: Present Issues; Market
Scenario; Strategy Considerations; and Concept of the Month. Additionally, the recent HedgeCo “DITMo” Manager Interview is added after the end page of this report.
Present Issues
The EU overhang vis-à-vis Greece (et. al) is center stage. Risk practitioners point to the United States as a greater financial risk than Europe in that the steps taken over-
seas are proper to avert financial meltdown. The Euro constituents will almost assuredly have to pare down to about ten from seventeen and will have to stand against
opponents of austerity. If they do, European GDP growth will rival China’s and surpass it in terms of Real GDP growth. When there is no repercussion to fiscal unre-
straint and no perceived benefit of austerity (a better word would be “frugality”), panderers are elected. For the United States, there are those who believe that $17.5T in
national debt is the point where balance between fiscal and monetary policy is no longer attainable. Last Issue, Iran threat somewhat quelled after meeting in Turkey
aligning Germany with Gulf States, Turkey and the U.S. to decouple Lebanon, Gaza strip and Syria from Iran ensuring EU oil to offset Putin’s gas/oil state confiscation.
Market Scenario
The soon-coming restructured Eurozone will squeeze out Emerging Markets. Jim Grant (Rate Observer) continues to believe that the Fed’s policies manipulating mone-
tary policy to avert shocks is feeding the monster shock to come. This feeds GOLD bugs, but there is a greater possibility of a FORCED MONETARY CONVERSION
first in the EU, then, the United States will follow when the U.S. faces that monetary-fiscal policy balance is no longer possible.
Strategy Considerations
It seems that every strategist and fund allocator is highlighting fixed income step-up products—usually involving mortgage securities. Some play the default spread,
some play duration. There is an expectation that QE3 of some form will re-emerge in the face of decaying economic conditions. The Fed will continue to twist the
curve, in that case, offsetting growth of their balance sheet with duration. Fixed income products laying off duration risk and others that are short extension risk, long
default risk are playing defense and hoping for a fumble to score.
Concept of the Month
Real Growth is the “Economic Value Added,” as it were, of a country. The difference between Real Growth (1 + GDP) / (1 + inflation) and (1 +∆ HG) / (1 + ∆WTIC)
[Copper/Crude] represents pricing distortion in interest rates. Market multiples are in part a function of interest rates that are essentially additions to a capital charge.
Each industry has its discrete set of multiples used in comparables analysis. In the same way, each hedge class has a set of metrics that more aptly define its efficacy.
Not every strategy is conducive to the same selection criteria. There are long convergence, short VOL, arbitrage, event-driven, basis / credit / duration spread and other
hedge strategies that each have metrics that are more conducive to its philosophy and style. Long/short is expected to have lower higher moments but higher correlation.
There are some strategies that require higher moment risks and some that are beta neutral. The idea is, most of risk management has to do with understanding the appro-
priate risk metrics to analyze specific strategies and classifications.
Errata:
Attributions Average Return for 1,3,5,10Y periods, CAGR, Lehman 2003 Return Matrix (reflected SP500 mistakenly), GOLD UBA 3year, Downside Deviation and other metrics printed one month lagged,
- 5. Prepared by: Pj de Marigny, DITMo Strategies Page 5 ©2012 RENOVATIO ASSET MANAGEMENT, LLC
DITMo® Report Date
7-May-
2012
30Yr Tres Bond
10Yr Avg
end 03/12 4.54%
10Yr Tres Note
10Yr Avg
end 03/12 3.85%
T-Bill (Riskless)
10Yr Avg
end 03/12 1.74%
Sortino MAR thresh-
old% (month)
10Avg30yr
TBond 0.38%
ALL DATA: Period
Ending Feb2012 DITMo® SPX
Observations 120 120 RED=Lowest Green=Highest
Performance (10Y/
monthly unless stat-
ed)
DITMo SPX
Convertible
Arbitrage
CTA Global
Distressed
Securities
Emerging
Markets
Equity Mar-
ket Neutral
Event
Driven
Fixed In-
come Arbi-
trage
Global
Macro
Long/
Short
Equity
Merger
Arbitrage
Rela-
tive
Value
Short
Selling
Funds
Of
Funds
Lehman
AGG
BXMCovd
Call
High
Yld
REIT GOLD
Annualized AVG
19.71% 46.20% 20.76% -2.68% 24.68% 24.12% 7.56% 20.64% 11.84% 10.52% 24.32% 9.20% 17.16% -52.96% 11.52% -1.49% 19.66% 19.85% 38.78% 28.39%
1Y AVG RETURN 7.71% 7.34% 4.57% 0.92% 8.76% 7.46% 4.07% 5.56% 4.71% 3.67% 7.35% 4.73% 5.66% 14.21% 1.39% 4.11% 9.93% 6.91% 11.71% 7.09%
3Y AVG RETURN
10.61% 20.36% 16.80% 3.54% 17.66% 17.16% 5.24% 13.75% 12.39% 7.28% 12.53% 6.85% 11.76% -10.65% 5.76% 2.67% 14.70% 21.05% 36.54% 18.22%
5Y AVG RETURN 5.19% 1.66% 6.17% 6.96% 6.50% 5.83% 2.70% 5.35% 4.92% 6.04% 4.89% 4.78% 5.45% 1.46% 0.56% 1.90% 3.31% 8.15% 0.82% 18.54%
10Y AVG RETURN 6.66% 3.35% 6.21% 7.30% 10.46% 10.60% 4.38% 8.21% 5.83% 7.24% 6.98% 5.77% 6.46% -0.30% 4.15% 0.99% 5.08% 9.47% 8.63% 17.72%
1Y CAGR 7.91% 6.23% 4.56% 0.71% 8.84% 7.09% 4.10% 5.44% 4.79% 3.64% 7.21% 4.80% 5.73% 13.86% 1.28% 4.15% 9.38% 6.75% 9.54% 16.48%
3Y CAGR
11.07% 20.86% 17.92% 3.34% 18.91% 17.97% 5.34% 14.43% 13.06% 7.43% 12.96% 7.05% 12.32% -11.05% 5.82% 2.67% 14.95% 22.70% 38.75% 21.98%
5Y CAGR
5.12% -0.18% 5.79% 6.88% 6.34% 5.08% 2.65% 5.18% 4.82% 6.09% 4.61% 4.83% 5.39% 0.40% 0.36% 1.85% 2.21% 7.53% -5.26% 20.24%
10Y CAGR 6.73% 2.07% 6.07% 7.17% 10.75% 10.51% 4.42% 8.31% 5.87% 7.38% 6.92% 5.87% 6.54% -1.14% 4.08% 1.01% 4.40% 9.34% 5.01% 18.61%
2012 (YTD end Mar)
5.01% 12.00% 5.27% -0.69% 6.28% 6.07% 1.90% 5.24% 2.99% 2.64% 6.18% 2.32% 4.35% -12.74% 2.90% -0.38% 4.99% 5.03% 9.84% 6.69%
2011 6.28% 0.00% 3.15% 0.87% 6.13% 1.97% 4.16% 3.13% 4.89% 1.09% 3.13% 4.34% 3.80% 23.29% -0.81% 3.93% 5.72% 5.47% 5.52% 10.06%
2010
8.66% 12.78% 12.28% 9.78% 14.09% 11.18% 5.37% 11.54% 9.98% 8.47% 9.76% 6.45% 9.97% -16.62% 5.21% 2.73% 5.86% 14.42% 23.32% 29.52%
2009
8.39% 23.45% 46.78% -1.91% 30.40% 37.87% 5.07% 25.74% 24.49% 10.39% 20.01% 9.97% 21.16% -20.53% 10.67% 0.81% 25.91% 54.22% 21.03% 24.36%
2008
-8.93% -38.49% -26.50% 15.61% -21.29% -33.65% -8.36% -18.49% -17.40% -3.22% -18.92% -2.35% -14.91% 31.52% -19.72% 0.82% -28.65% -26.17% -42.54% 5.77%
2007
9.50% 3.53% 3.86% 9.91% 7.18% 20.79% 8.34% 9.62% 6.01% 12.93% 10.56% 9.09% 9.43% 7.40% 10.07% 1.56% 6.59% 2.65% -20.97% 30.98%
2006 12.01% 13.62% 12.33% 5.87% 15.26% 18.84% 7.47% 15.47% 7.43% 7.50% 11.76% 13.71% 11.85% -8.28% 11.24% -0.52% 13.33% 11.91% 30.52% 23.15%
2005 9.33% 3.00% -1.92% -0.33% 9.23% 17.18% 6.53% 7.31% 4.64% 9.49% 11.33% 4.95% 5.24% 7.28% 6.81% -2.92% 4.25% 2.26% 8.38% 17.92%
2004 10.87% 8.99% 1.10% 5.17% 17.89% 14.30% 4.71% 12.43% 6.26% 4.60% 8.62% 4.83% 5.71% -4.66% 7.08% -0.90% 8.30% 11.95% 26.45% 5.54%
2003
13.45% 26.38% 10.80% 11.64% 27.34% 31.27% 6.29% 20.48% 8.35% 17.25% 19.31% 8.34% 12.15% -23.87% 11.45% -1.18% 19.37% 27.94% 27.75% 19.37%
UPDATE: 2012 YTD
Annualized
21.59% 57.33% 22.81% -2.75% 27.61% 26.56% 7.82% 22.65% 12.50% 10.97% 27.11% 9.59% 18.55% -42.03% 12.12% -1.51% 21.52% 21.67% 45.56% 29.58%
10Yr Mo Avg Return 0.55% 0.28% 0.52% 0.61% 0.87% 0.88% 0.36% 0.68% 0.49% 0.60% 0.58% 0.48% 0.54% -0.03% 0.35% 0.08% 0.42% 0.79% 0.72% 1.48%
10 Yr Average
Monthly Gain
1.08% 3.14% 1.40% 2.26% 1.64% 2.40% 0.68% 1.50% 0.86% 1.36% 1.79% 0.83% 1.08% 3.22% 1.14% 0.76% 2.21% 1.95% 4.93% 5.01%
10 Yr Average
Monthly Loss
-1.55% -4.01% -1.71% -1.71% -1.54% -2.66% -0.77% -1.57% -1.29% -0.80% -1.75% -0.91% -1.16% -2.87% -1.30% -0.87% -3.15% -2.41% -6.06% -3.64%
10 Yr Batting Average 579 495 421 332 742 732 321 663 426 453 553 395 495 300 368 189 500 579 611 747
VAMI (120 Months) $1,918 $1,227 $1,803 $1,998 $2,775 $2,716 $1,539 $2,222 $1,769 $2,037 $1,952 $1,768 $1,882 $890 $1,491 $1,096 $1,536 $2,441 $1,630 $5,511
Attributions for 20 Indexes
- 6. Prepared by: Pj de Marigny, DITMo Strategies Page 6 ©2012 RENOVATIO ASSET MANAGEMENT, LLC
Risk Analysis
DITMo SPX
Convertible
Arbitrage
CTA Global
Distressed
Securities
Emerging
Markets
Equity
Market
Neutral
Event
Driven
Fixed
Income
Arbitrage
Global
Macro
Long/
Short
Equity
Merger
Arbitrage
Relative
Value
Short
Selling
Funds
Of
Funds
Lehman
AGG
BXMCov
dCall
High
Yld
REIT GOLD
(Monthly 120 Variance
Method) VaR 95% 2.33% 7.59% 3.62% 4.03% 3.05% 5.02% 1.47% 2.94% 2.19% 2.16% 3.48% 1.51% 2.25% 6.22% 2.49% 1.75% 5.84% 4.72% 12.67% 8.78%
(Monthly 120 Variance
Method) VaR 99% 3.29% 10.74% 5.11% 5.70% 4.32% 7.10% 2.08% 4.16% 3.10% 3.06% 4.92% 2.13% 3.19% 8.79% 3.52% 2.47% 8.27% 6.68% 17.91% 12.42%
10Y Annualized StdDev 4.90% 15.99% 7.62% 8.49% 6.43% 10.58% 3.10% 6.20% 4.61% 4.55% 7.33% 3.18% 4.75% 13.10% 5.24% 3.68% 12.31% 9.95% 26.68% 18.49%
(Discrete Variance) Downside
Deviation 4.09% 12.38% 6.08% 5.41% 4.41% 7.54% 2.69% 4.50% 3.85% 2.75% 5.29% 2.32% 3.68% 9.66% 4.30% 3.29% 9.78% 7.41% 20.23% 11.46%
(Discrete Method) Sortino 1.39 1.08 0.99 -0.14 1.62 0.92 0.81 1.33 0.89 1.10 1.33 1.14 1.35 -1.58 0.77 -0.13 0.58 0.77 0.55 0.72
Kurtosis (Monthly 10Y) 14.35 1.38 13.85 -0.47 4.13 4.01 20.01 2.82 21.03 -0.14 1.06 1.65 9.10 -0.03 4.21 1.89 3.52 10.15 5.50 0.46
Skew (Monthly 10Y) -3.03 -0.67 -2.42 0.08 -1.33 -1.16 -3.37 -1.24 -3.41 0.04 -0.75 -0.88 -2.02 0.30 -1.49 -0.46 -1.08 -1.69 -0.76 -0.25
(10Y) Max Drawdown 16% 53% 29% 12% 23% 36% 11% 20% 18% 8% 22% 6% 16% 42% 21% 11% 36% 32% 74% 26%
Risk/Return Ratios
DITMo SPX
Convertible
Arbitrage
CTA Global
Distressed
Securities
Emerging
Markets
Equity
Market
Neutral
Event
Driven
Fixed
Income
Arbitrage
Global
Macro
Long/
Short
Equity
Merger
Arbitrage
Relative
Value
Short
Selling
Funds
Of
Funds
Lehman
AGG
BXMCov
dCall
High
Yld
REIT GOLD
(3Y) Calmar 0.67 0.39 0.57 0.30 0.77 0.48 0.47 0.68 0.69 0.92 0.57 1.22 0.74 -0.25 0.28 0.25 0.41 0.66 0.50 0.71
(10Y) (30Y Avg TBond MAR)
OMEGA
4.00 1.50 2.53 1.40 3.14 2.33 3.62 2.75 4.71 1.86 1.93 4.00 3.14 0.88 2.08 1.40 2.00 2.75 1.61 1.45
1Y Sharpe Ratio 1.56 0.33 0.61 -0.12 0.93 0.50 0.74 0.52 1.42 0.44 0.63 1.07 0.95 0.78 -0.07 0.93 0.57 0.58 0.42 0.19
3Y Sharpe Ratio 2.48 1.15 2.33 0.25 2.39 1.48 1.49 1.93 3.03 1.27 1.41 2.29 2.35 -0.86 0.90 0.34 1.09 2.07 1.28 0.78
5Y Sharpe Ratio 0.58 0.00 0.44 0.69 0.58 0.31 0.24 0.48 0.50 0.87 0.36 0.90 0.61 -0.02 -0.18 0.04 0.11 0.49 -0.03 0.77
10Y Sharpe Ratio 1.00 0.10 0.59 0.66 1.36 0.84 0.85 1.04 0.89 1.21 0.72 1.27 1.00 -0.16 0.46 -0.20 0.27 0.78 0.26 0.86
Benchmark Analysis
SPX
DITMo SPX
Convertible
Arbitrage
CTA Global
Distressed
Securities
Emerging
Markets
Equity
Market
Neutral
Event
Driven
Fixed
Income
Arbitrage
Global
Macro
Long/
Short
Equity
Merger
Arbitrage
Relative
Value
Short
Selling
Funds
Of
Funds
Lehman
AGG
BXMCov
dCall
High
Yld
REIT GOLD
SPX UPCapture 42% 100% 37% 25% 52% 68% 19% 50% 27% 31% 53% 30% 37% -71% 30% -1% 73% 61% 136% 52%
SPX DownCapture 15% 100% 11% -9% 6% 25% 0% 15% 1% -1% 26% 5% 9% -82% 14% -6% 60% 23% 115% -37%
10Y SP500 Tracking Error 12% 0% 14% 18% 13% 12% 15% 12% 14% 15% 11% 14% 13% 28% 14% 17% 7% 12% 19% 24%
10Y DITMo Information Ratio -0.28 N/A -0.21 -0.22 -0.56 -0.62 -0.07 -0.40 -0.18 -0.26 -0.32 -0.17 -0.24 0.13 -0.06 -0.20 0.00 0.20 -0.09 -0.25
10 Yr Universe Batting
Average
579 495 421 332 742 732 321 663 426 453 553 395 495 300 368 189 500 579 611 747
( Annualized Avg) Active
Premium v SPX
-3.58% N/A -3.03% -4.37% -7.15% -7.28% -1.29% -5.05% -2.82% -4.07% -3.73% -2.71% -3.36% 2.75% -0.97% 2.04% -1.92% -6.18% -5.42% -14.82%
(10Y, Risk Free=Avg 3mo
TBill) Treynor
0.17 0.02 0.18 -3.01 0.33 0.20 0.35 0.23 0.28 0.48 0.15 0.31 0.22 0.03 0.12 0.45 0.05 0.18 0.06 4.06
Other Metrics/
Significance Tests
DITMo SPX
Convertible
Arbitrage
CTA Global
Distressed
Securities
Emerging
Markets
Equity
Market
Neutral
Event
Driven
Fixed
Income
Arbitrage
Global
Macro
Long/
Short
Equity
Merger
Arbitrage
Relative
Value
Short
Selling
Funds
Of
Funds
Lehman
AGG
BXMCov
dCall
High
Yld
REIT GOLD
(Barra Annualizing) Jensen
Alpha
5.71% 0.00% 5.38% 7.36% 9.57% 9.10% 4.12% 7.26% 5.33% 6.85% 5.80% 5.33% 5.73% 1.97% 3.49% 1.05% 2.76% 8.03% 4.67% 17.59%
(RAP) M2 Alpha 16.04% 1.61% 9.39% 10.48% 21.69% 13.40% 13.62% 16.69% 14.20% 19.34% 11.44% 20.31% 15.92% -2.49% 7.36% -3.23% 4.34% 12.43% 4.13% 13.74%
(Slope) SPX Beta 0.28 1.00 0.25 -0.02 0.27 0.45 0.08 0.28 0.15 0.12 0.35 0.13 0.22 -0.68 0.20 -0.02 0.69 0.43 1.18 0.04
10Y M2 17.78% 3.35% 11.13% 12.22% 23.43% 15.14% 15.35% 18.42% 15.93% 21.07% 13.18% 22.05% 17.66% -0.75% 9.10% -1.49% 6.08% 14.16% 5.87% 15.55%
Correlation r 91.85% 100.00% 52.22% -3.49% 66.42% 67.88% 39.43% 72.81% 51.46% 40.69% 76.97% 65.81% 73.21% -82.96% 59.64% -7.16% 90.16% 68.85% 70.86% 3.40%
(Pearson Product Moment) R-
squared
84.36% 100.00% 27.27% 0.12% 44.12% 46.07% 15.55% 53.01% 26.48% 16.56% 59.24% 43.31% 53.60% 68.83% 35.57% 0.51% 81.28% 47.41% 50.21% 0.12%
Skew -3.03 -0.67 -2.42 0.08 -1.33 -1.16 -3.37 -1.24 -3.41 0.04 -0.75 -0.88 -2.02 0.30 -1.49 -0.46 -1.08 -1.69 -0.76 -0.25
Downside Skew -3.37 -0.92 -2.13 -2.57 -3.34 -1.70 -2.63 -1.49 -1.69 -0.93 -2.73 -0.81 -2.16 -2.67 -1.36 -1.95 -1.56 -3.20 -2.21 -1.93
Kurtosis 14.35 1.22 13.85 -0.47 4.13 4.01 20.01 2.82 21.03 -0.14 1.06 1.65 9.10 -0.03 4.21 1.89 3.58 10.23 5.54 0.46
Downside Kurtosis 11.61 0.57 4.89 8.45 12.74 2.89 7.29 2.97 3.13 0.34 8.08 0.01 5.48 8.40 2.14 4.74 2.88 12.02 5.24 4.77
Alpha t-score 1.54 N/A 1.23 1.26 2.37 2.43 0.86 1.86 1.18 1.46 1.60 1.19 1.39 0.22 0.81 0.20 1.20 2.16 0.77 2.29
Beta t-score 7.59 N/A 5.71 -0.32 6.61 11.99 1.60 7.24 3.28 2.47 9.74 2.91 5.27 -7.66 4.53 -0.31 30.10 11.54 19.46 0.51
Correlation t-score 25.23 N/A 6.65 -0.38 9.65 10.04 4.66 11.54 6.52 4.84 13.10 9.49 11.67 -16.14 8.07 -0.78 22.64 10.31 10.91 0.37
- 7. Prepared by: Pj de Marigny, DITMo Strategies Page 7 ©2012 RENOVATIO ASSET MANAGEMENT, LLC
Alpha
DITMo SPX
Convertible
Arb
CTA Global
Distressed
Secs
Emerging
Markets
Equity Market
Neutral
Event
Driven
Fixed
Income
Arbi-
Global
Macro
Long/
Short
Equity
Merger
Arbitrage
Relative
Value
Short
Selling
Funds
Of
Funds
Lehman
AGG
BXMCovd
Call
High
Yld
REIT GOLD
TTM end Mar12 6.1% N/A 3.6% 0.7% 7.2% 6.3% 3.4% 4.0% 4.2% 3.2% 5.6% 3.9% 4.8% 16.9% 0.7% 4.5% 4.3% 3.5% 2.5% 7.7%
TTM end Mar11 5.8% N/A 10.2% 8.7% 8.5% 3.3% 3.3% 6.4% 8.9% 5.7% 3.6% 4.6% 6.6% -5.6% 1.8% 2.7% -2.3% 9.9% 14.3% 27.9%
TTM end Mar10 8.4% N/A 19.9% -10.0% 25.5% 13.4% 5.4% 16.7% 20.0% 1.4% 5.6% 8.7% 11.9% -1.3% 4.8% 3.2% 5.2% 24.8% -8.7% 6.1%
TTM end Mar09 4.8% N/A 1.4% -2.7% -8.8% -8.8% -4.6% -3.1% 0.2% -0.6% -1.1% 7.8% 0.0% -8.8% -8.3% 4.8% 0.0% 2.9% 8.8% 7.7%
TTM end Mar08 7.8% N/A -2.1% 20.1% 1.6% 12.9% 6.2% 2.6% 0.8% 13.7% 5.0% 4.5% 5.1% 13.6% 4.8% 2.0% 5.8% -0.5% -17.5% 33.4%
TTM end Mar07 8.2% N/A 10.2% -3.2% 12.6% 6.1% 6.6% 13.0% 8.1% 2.3% 3.4% 13.0% 8.4% 1.7% 6.1% 1.3% 4.1% 10.0% 6.3% 12.6%
TTM end Mar06 8.2% N/A 3.3% 0.6% 9.6% 15.9% 6.0% 6.9% 4.6% 8.5% 10.5% 5.5% 6.9% 7.9% 6.8% -1.9% 3.0% 3.8% 21.5% 29.8%
TTM end Mar05 8.2% N/A -4.3% -9.3% 12.7% 7.2% 3.8% 7.5% 5.7% 0.6% 3.0% 2.8% 2.8% 12.4% 3.1% -4.1% 4.8% 6.4% -1.8% -3.3%
TTM end Mar04 8.8% N/A 4.6% 5.5% 18.4% 25.1% 6.1% 13.8% 5.5% 13.1% 13.1% 6.5% 8.2% -10.7% 9.9% 1.1% 1.0% 13.1% 37.6% 27.4%
TTM end Mar03 4.1% N/A 13.6% 9.2% 10.1% 5.5% 4.7% 4.5% 6.6% 5.0% 0.3% 0.8% 5.4% 5.8% 2.5% 2.8% 10.7% 13.8% -6.4% 8.0%
10Y Alpha Average 7.0% N/A 6.0% 1.9% 9.7% 8.7% 4.1% 7.2% 6.5% 5.3% 4.9% 5.8% 6.0% 3.2% 3.2% 1.6% 3.7% 8.8% 5.6% 15.7%
Beta
DITMo SPX
Convertible
Arb
CTA Global
Distressed
Secs
Emerging
Markets
Eqty Mkt
Neutral
Event
Driven
Fixed Inc
Arb
Global
Macro
Long/
Short
Eqty
Merger
Arb
Relative
Value
Short
Selling
Funds
Of
Funds
Lehman
AGG
BXMCovd
Call
High
Yld
REIT GOLD
TTM end Mar12 0.21 N/A 0.13 0.03 0.22 0.16 0.09 0.21 0.08 0.06 0.24 0.11 0.12 (0.37) 0.09 (0.05) 0.77 0.46 1.25 (0.08)
TTM end Mar11 0.22 N/A 0.20 0.20 0.28 0.37 0.12 0.29 0.08 0.16 0.40 0.11 0.20 (0.71) 0.23 (0.08) 0.59 0.27 0.80 (0.14)
TTM end Mar10 0.17 N/A 0.34 0.29 0.18 0.55 0.01 0.23 0.08 0.25 0.40 0.03 0.22 (0.70) 0.17 (0.01) 0.56 0.46 2.19 0.38
TTM end Mar09 0.36 N/A 0.38 (0.16) 0.24 0.50 0.06 0.25 0.27 0.08 0.30 0.15 0.25 (0.62) 0.19 0.09 0.84 0.58 1.62 0.03
TTM end Mar08 0.27 N/A 0.18 0.07 0.32 0.51 0.13 0.37 0.15 0.17 0.45 0.29 0.23 (0.89) 0.32 (0.12) 0.53 0.41 0.91 (0.12)
TTM end Mar07 0.25 N/A (0.02) 0.50 0.09 0.75 0.04 0.14 (0.05) 0.27 0.50 (0.02) 0.15 (0.82) 0.31 0.03 0.56 0.13 1.12 0.16
TTM end Mar06 0.25 N/A 0.27 0.69 0.23 0.58 0.12 0.48 0.03 0.34 0.62 0.38 0.26 (1.22) 0.40 (0.12) 0.53 0.28 1.08 0.26
TTM end Mar05 0.25 N/A 0.10 0.76 0.36 0.52 0.13 0.43 0.02 0.34 0.57 0.26 0.19 (1.39) 0.33 0.02 0.40 0.25 1.78 0.94
TTM end Mar04 0.18 N/A 0.09 0.30 0.20 0.28 0.03 0.21 0.08 0.14 0.29 0.09 0.16 (0.69) 0.11 (0.03) 0.69 0.27 (0.06) (0.10)
TTM end Mar03 0.28 N/A 0.06 (0.42) 0.07 0.23 (0.00) 0.16 (0.03) (0.04) 0.24 0.08 0.13 (0.68) 0.05 (0.10) 0.78 0.22 0.11 (0.15)
10Y Beta Average 0.25 N/A 0.17 0.23 0.22 0.44 0.07 0.28 0.07 0.18 0.40 0.15 0.19 (0.81) 0.22 (0.04) 0.62 0.34 1.08 0.12
Alpha t-score 1.54 N/A 1.23 1.26 2.37 2.43 0.86 1.86 1.18 1.46 1.60 1.19 1.39 0.22 0.81 0.20 1.20 2.16 0.77 2.29
Beta t-score 7.59 N/A 5.71 (0.32) 6.61 11.99 1.60 7.24 3.28 2.47 9.74 2.91 5.27 (7.66) 4.53 (0.31) 30.10 11.54 19.46 0.51
Correlation t-score 25.23 N/A 6.65 (0.38) 9.65 10.04 4.66 11.54 6.52 4.84 13.10 9.49 11.67 (16.14) 8.07 (0.78) 22.64 10.31 10.91 0.37
Correlation r 92% N/A 52% -3% 66% 68% 39% 73% 51% 41% 77% 66% 73% -83% 60% -7% 90% 69% 71% 3%
Alpha p-Score 6.33% N/A 10.97% 10.56% 0.97% 0.83% 19.59% 3.26% 12.02% 7.37% 5.60% 11.91% 8.34% 41.23% 21.00% 42.22% 11.72% 1.62% 22.17% 1.20%
Beta p-Score 0.00% N/A 0.00% 62.38% 0.00% 0.00% 5.66% 0.00% 0.07% 0.75% 0.00% 0.22% 0.00%
100.00
% 0.00% 62.14% 0.00% 0.00% 0.00% 30.50%
- 8. Prepared by: Pj de Marigny, DITMo Strategies Page 8 ©2012 RENOVATIO ASSET MANAGEMENT, LLC
ConvertibleArbitrage,4.56%
CTAGlobal,0.71%
DistressedSecurities,8.84%
EmergingMarkets,7.09%
EquityMarketNeutral,4.10%
EventDriven,5.44%
FixedIncomeArbitrage,4.79%
GlobalMacro,3.64%
Long/ShortEquity,7.21%
MergerArbitrage,4.80%
RelativeValue,5.73%
ShortSelling,13.86%
FundsOfFunds,1.28%
DITMo,7.91%
SP500,6.23%
LehmanAGG,4.15%
BXMCovdCall,9.38%
HighYld,6.75%
REIT,9.54%
GOLD,16.48%
0.00%
2.00%
4.00%
6.00%
8.00%
10.00%
12.00%
14.00%
16.00%
18.00%
1 Year: ending 03/12
ConvertibleArbitrage,17.92%
CTAGlobal,3.34%
DistressedSecurities,18.91%
EmergingMarkets,17.97%
EquityMarketNeutral,5.34%
EventDriven,14.43%
FixedIncomeArbitrage,13.06%
GlobalMacro,7.43%
Long/ShortEquity,12.96%
MergerArbitrage,7.05%
RelativeValue,12.32%
ShortSelling,-11.05%
FundsOfFunds,5.82%
DITMo,11.07%
SP500,20.86%
LehmanAGG,2.67%
BXMCovdCall,14.95%
HighYld,22.70%
REIT,38.75%
GOLD,21.98%
-20.00%
-10.00%
0.00%
10.00%
20.00%
30.00%
40.00%
50.00%
3 Years: 04/09-03/12
- 9. Prepared by: Pj de Marigny, DITMo Strategies Page 9 ©2012 RENOVATIO ASSET MANAGEMENT, LLC
ConvertibleArbitrage,5.79%
CTAGlobal,6.88%
DistressedSecurities,6.34%
EmergingMarkets,5.08%
EquityMarketNeutral,2.65%
EventDriven,5.18%
FixedIncomeArbitrage,4.82%
GlobalMacro,6.09%
Long/ShortEquity,4.61%
MergerArbitrage,4.83%
RelativeValue,5.39%
ShortSelling,0.40%
FundsOfFunds,0.36%
DITMo,5.12%
SP500,-0.18%
LehmanAGG,1.85%
BXMCovdCall,2.21%
HighYld,7.53%
REIT,-5.26%
GOLD,20.24%
-10.00%
-5.00%
0.00%
5.00%
10.00%
15.00%
20.00%
25.00%
5 Years: 04/07 - 03/12
ConvertibleArbitrage,6.07%
CTAGlobal,7.17%
DistressedSecurities,10.75%
EmergingMarkets,10.51%
EquityMarketNeutral,4.42%
EventDriven,8.31%
FixedIncomeArbitrage,5.87%
GlobalMacro,7.38%
Long/ShortEquity,6.92%
MergerArbitrage,5.87%
RelativeValue,6.54%
ShortSelling,-1.14%
FundsOfFunds,4.08%
DITMo,6.73%
SP500,2.07%
LehmanAGG,0.93%
BXMCovdCall,4.40%
HighYld,9.34%
REIT,5.01%
GOLD,18.61%
-5.00%
0.00%
5.00%
10.00%
15.00%
20.00%
10 Years: 04/02 - 03/12
- 10. Prepared by: Pj de Marigny, DITMo Strategies Page 10 ©2012 RENOVATIO ASSET MANAGEMENT, LLC
-10.00%
-5.00%
0.00%
5.00%
10.00%
15.00%
20.00%
25.00%
30.00%
35.00%
40.00%
10Yr Return
10Yr StdDev
5Yr Return
5Yr StdDev
10 and 5 Year Annual Returns v. Std. Deviations
(end Mar 2012)
20 Hedge Strategies and Indexes
Hedge Strategies Data Source: Edhec Risk Institute
-20.00%
-10.00%
0.00%
10.00%
20.00%
30.00%
40.00%
50.00%
3Yr Return
3Yr StdDev
1Yr Return
1Yr StdDev
3 and 1 Year Annual Returns v. Std. Deviations
(end Mar 2012)
20 Hedge Strategies and Indexes
Hedge Strategies Data Source: Edhec Risk Institute
- 11. Prepared by: Pj de Marigny, DITMo Strategies Page 11 ©2012 RENOVATIO ASSET MANAGEMENT, LLC
0.00%
5.00%
10.00%
15.00%
20.00%
25.00%
30.00%
35.00%
40.00%
10Yr StdDev
5Yr StdDev
3Yr StdDev
1Yr StdDev
10, 5. 3. 1 Year Annualized Standard Deviation
(ending Mar 2012)
20 Hedge Strategies and Indexes
Hedge Strategies Data Source: Edhec Risk Institute
-20.00%
-10.00%
0.00%
10.00%
20.00%
30.00%
40.00%
50.00%
10Yr Return
5Yr Return
3Yr Return
1Yr Return
10, 5, 3, 1Yr Annual Returns (end Mar 2012)
20 Hedge Strategies and Indexes
Hedge Strategies Data Source: Edhec Risk Institute
- 12. Prepared by: Pj de Marigny, DITMo Strategies Page 12 ©2012 RENOVATIO ASSET MANAGEMENT, LLC
Universe Batting Average (UBA)
BXM
CovdCall
Convertible
Arbitrage
CTA
Global
Distressed
Securities
DITMo
Emerging
Markets
Equity Market
Neutral
Event
Driven
Fixed Income
Arb
Funds Of
Funds
Global
Macro
GOLD
High
Yld
Lehman
AGG
Long/Short
Equity
Merger
Arb
REIT
Relative
Value
Short
Selling
SP500
10 Year (2003-03/12) 489 416 326 737 579 726 316 658 421 363 447 832 521 189 553 395 611 495 300 495
5 Year (2008-03/12) 547 589 326 737 526 516 337 568 558 232 358 874 684 242 589 421 474 568 284 516
3 Year (2010-03/12) 491 596 211 842 596 526 281 544 526 140 246 947 719 105 561 263 789 561 175 789
YTD end 03/12 474 684 53 842 526 737 158 632 368 316 263 895 579 158 842 263 947 632 0 1000
Risk-Adjusted
Universe Batting Average
BXM
CovdCall
Convertible
Arbitrage
CTA Global
Distressed
Securities
DITMo
Emerging
Markets
Equity Mar-
ket Neutral
Event
Driven
Fixed In-
come Arb
Funds Of
Funds
Global
Macro
GOLD High Yld
Lehman
AGG
Long/Short
Equity
Merger
Arb
REIT
Relative
Value
Short
Selling
SP500
10 Year (2003-03/12) 175 332 276 1232 795 722 450 882 536 283 725 837 489 48 522 730 115 681 -26 64
5 Year (2008-03/12) 81 336 295 571 451 200 218 390 424 13 440 820 395 122 312 601 -72 502 8 -5
3 Year (2010-03/12) 616 1656 98 2392 1846 907 636 1262 1954 183 417 1006 1746 100 952 830 1122 1618 -135 1014
YTD end 03/2012 310 667 5 983 1085 459 206 468 840 79 217 541 438 257 680 452 380 876 0 370
0
100
200
300
400
500
600
700
800
900
1000 10 Year (2003-03/12)
5 Year (2008-03/12)
3 Year (2010-03/12)
YTD end 03/12
Universe Batting Average
10 Years: 04/03—03/12
-700
-200
300
800
1300
1800
2300 10 Year (2003-03/12)
5 Year (2008-03/12)
3 Year (2010-03/12)
YTD end 03/2012
Risk-Adjusted UBA
Ten Years: 04/03—03/12
- 13. Prepared by: Pj de Marigny, DITMo Strategies Page 13 ©2012 RENOVATIO ASSET MANAGEMENT, LLC
HEDGE FUND STRATEGIES 10-YEAR CORRELATION MATRIX (Monthly 10Y ending 03/12)
Convert CTA Distressed Emerging EqtyMkt Event Fixed Inc Global L/S Merger Relative Short Funds Of DITMo SP500 WFBIX BXM CSHY DWRTF GOLDS
Arbitrage Global Securities Markets Neutral Driven Arbitrage Macro Equity Arbitrage Value Selling Funds CovdCall Index Lehman AGG CovdCall High Yld REIT GOLD
ConvertibleArbitrage 1.00 0.05 0.78 0.74 0.49 0.78 0.88 0.51 0.69 0.63 0.89 (0.48) 0.75 0.54 0.52 0.16 0.53 0.81 0.43 0.20
CTAGlobal 0.05 1.00 0.09 0.17 0.24 0.12 0.03 0.65 0.19 0.13 0.09 (0.02) 0.31 (0.07) (0.03) 0.15 (0.10) (0.07) 0.01 0.38
DistressedSecurities 0.78 0.09 1.00 0.84 0.67 0.95 0.80 0.59 0.85 0.70 0.91 (0.59) 0.87 0.67 0.66 (0.07) 0.63 0.78 0.52 0.10
EmergingMarkets 0.74 0.17 0.84 1.00 0.63 0.89 0.73 0.76 0.92 0.73 0.91 (0.58) 0.92 0.67 0.68 0.08 0.64 0.69 0.46 0.25
Equity MktNeutral 0.49 0.24 0.67 0.63 1.00 0.68 0.52 0.56 0.65 0.51 0.64 (0.30) 0.72 0.36 0.39 (0.21) 0.45 0.46 0.30 0.00
EventDriven 0.78 0.12 0.95 0.89 0.68 1.00 0.73 0.66 0.94 0.84 0.95 (0.67) 0.92 0.70 0.73 (0.07) 0.68 0.76 0.50 0.13
Fixed IncArbitrage 0.88 0.03 0.80 0.73 0.52 0.73 1.00 0.49 0.62 0.55 0.84 (0.44) 0.73 0.60 0.51 0.18 0.50 0.78 0.46 0.22
GlobalMacro 0.51 0.65 0.59 0.76 0.56 0.66 0.49 1.00 0.74 0.59 0.66 (0.38) 0.81 0.37 0.41 0.16 0.33 0.40 0.26 0.50
Long/ShortEquity 0.69 0.19 0.85 0.92 0.65 0.94 0.62 0.74 1.00 0.82 0.91 (0.70) 0.92 0.71 0.77 (0.07) 0.70 0.66 0.49 0.18
MergerArbitrage 0.63 0.13 0.70 0.73 0.51 0.84 0.55 0.59 0.82 1.00 0.80 (0.64) 0.79 0.63 0.66 0.03 0.63 0.62 0.45 0.16
RelativeValue 0.89 0.09 0.91 0.91 0.64 0.95 0.84 0.66 0.91 0.80 1.00 (0.66) 0.91 0.74 0.73 0.03 0.70 0.81 0.53 0.20
ShortSelling (0.48) (0.02) (0.59) (0.58) (0.30) (0.67) (0.44) (0.38) (0.70) (0.64) (0.66) 1.00 (0.55) (0.78) (0.83) 0.13 (0.70) (0.62) (0.60) (0.07)
Funds OfFunds 0.75 0.31 0.87 0.92 0.72 0.92 0.73 0.81 0.92 0.79 0.91 (0.55) 1.00 0.61 0.60 (0.00) 0.55 0.63 0.36 0.26
DITMoCovdCall 0.54 (0.07) 0.67 0.67 0.36 0.70 0.60 0.37 0.71 0.63 0.74 (0.78) 0.61 1.00 0.92 (0.01) 0.86 0.70 0.71 0.15
SP500Index 0.52 (0.03) 0.66 0.68 0.39 0.73 0.51 0.41 0.77 0.66 0.73 (0.83) 0.60 0.92 1.00 (0.07) 0.90 0.69 0.71 0.08
WFBIX
Lehman
AGG
0.16 0.15 (0.07) 0.08 (0.21) (0.07) 0.18 0.16 (0.07) 0.03 0.03 0.13 (0.00) (0.01) (0.07) 1.00 (0.08) 0.15 0.12 0.31
BXMCovdCall 0.53 (0.10) 0.63 0.64 0.45 0.68 0.50 0.33 0.70 0.63 0.70 (0.70) 0.55 0.86 0.90 (0.08) 1.00 0.70 0.66 0.05
CSHYHigh Yld 0.81 (0.07) 0.78 0.69 0.46 0.76 0.78 0.40 0.66 0.62 0.81 (0.62) 0.63 0.70 0.69 0.15 0.70 1.00 0.68 0.13
DWRTFREIT 0.43 0.01 0.52 0.46 0.30 0.50 0.46 0.26 0.49 0.45 0.53 (0.60) 0.36 0.71 0.71 0.12 0.66 0.68 1.00 0.13
GOLDSGOLD 0.20 0.38 0.10 0.25 0.00 0.13 0.22 0.50 0.18 0.16 0.20 (0.07) 0.26 0.15 0.08 0.31 0.05 0.13 0.13 1.00
HEDGE FUND STRATEGIES 5-YEAR CORRELATION MATRIX (Monthly 5Y ending 03/12)
Convert CTA Distressed Emerging Eqty Mkt Event Fixed Inc Global L/S Merger Relative Short Funds Of DITMo SP500 WFBIX BXM CSHY DWRTF GOLDS
Arb Global Securities Markets Neutral Driven Arbitrage Macro Equity Arbitrage Value Selling Funds CovdCall Index Lehman AGG CovdCall High Yld REIT GOLD
ConvertibleArbitrage 1.00 (0.01) 0.84 0.83 0.51 0.86 0.93 0.58 0.79 0.75 0.94 (0.58) 0.82 0.65 0.62 0.22 0.61 0.86 0.49 0.19
CTAGlobal (0.01) 1.00 0.06 0.18 0.23 0.13 (0.07) 0.69 0.24 0.13 0.09 0.01 0.33 (0.04) 0.01 0.01 (0.04) (0.10) (0.09) 0.39
DistressedSecurities 0.84 0.06 1.00 0.88 0.68 0.97 0.85 0.62 0.90 0.75 0.94 (0.63) 0.88 0.72 0.73 (0.05) 0.69 0.79 0.56 0.04
EmergingMarkets 0.83 0.18 0.88 1.00 0.63 0.92 0.81 0.79 0.94 0.77 0.94 (0.57) 0.93 0.68 0.70 0.11 0.66 0.72 0.49 0.18
Equity MktNeutral 0.51 0.23 0.68 0.63 1.00 0.70 0.53 0.56 0.68 0.52 0.64 (0.31) 0.71 0.38 0.44 (0.34) 0.52 0.49 0.30 (0.11)
EventDriven 0.86 0.13 0.97 0.92 0.70 1.00 0.83 0.71 0.96 0.85 0.96 (0.65) 0.93 0.71 0.75 (0.03) 0.71 0.78 0.53 0.06
Fixed IncArbitrage 0.93 (0.07) 0.85 0.81 0.53 0.83 1.00 0.54 0.73 0.70 0.91 (0.58) 0.80 0.71 0.64 0.18 0.62 0.84 0.52 0.22
GlobalMacro 0.58 0.69 0.62 0.79 0.56 0.71 0.54 1.00 0.79 0.62 0.70 (0.42) 0.84 0.44 0.49 0.12 0.41 0.44 0.26 0.43
Long/ShortEquity 0.79 0.24 0.90 0.94 0.68 0.96 0.73 0.79 1.00 0.85 0.93 (0.64) 0.94 0.70 0.77 (0.01) 0.71 0.70 0.51 0.09
MergerArbitrage 0.75 0.13 0.75 0.77 0.52 0.85 0.70 0.62 0.85 1.00 0.83 (0.64) 0.81 0.69 0.73 0.09 0.71 0.71 0.50 0.04
RelativeValue 0.94 0.09 0.94 0.94 0.64 0.96 0.91 0.70 0.93 0.83 1.00 (0.67) 0.93 0.76 0.75 0.09 0.72 0.84 0.56 0.14
ShortSelling (0.58) 0.01 (0.63) (0.57) (0.31) (0.65) (0.58) (0.42) (0.64) (0.64) (0.67) 1.00 (0.55) (0.76) (0.80) 0.05 (0.67) (0.67) (0.67) (0.05)
Funds OfFunds 0.82 0.33 0.88 0.93 0.71 0.93 0.80 0.84 0.94 0.81 0.93 (0.55) 1.00 0.64 0.64 0.01 0.60 0.65 0.36 0.19
DITMoCovdCall 0.65 (0.04) 0.72 0.68 0.38 0.71 0.71 0.44 0.70 0.69 0.76 (0.76) 0.64 1.00 0.91 0.17 0.87 0.77 0.79 0.20
SP500Index 0.62 0.01 0.73 0.70 0.44 0.75 0.64 0.49 0.77 0.73 0.75 (0.80) 0.64 0.91 1.00 0.05 0.90 0.75 0.81 0.09
WFBIX
Lehman
AGG
0.22 0.01 (0.05) 0.11 (0.34) (0.03) 0.18 0.12 (0.01) 0.09 0.09 0.05 0.01 0.17 0.05 1.00 0.04 0.15 0.14 0.43
BXMCovdCall 0.61 (0.04) 0.69 0.66 0.52 0.71 0.62 0.41 0.71 0.71 0.72 (0.67) 0.60 0.87 0.90 0.04 1.00 0.76 0.77 0.03
CSHYHigh Yld 0.86 (0.10) 0.79 0.72 0.49 0.78 0.84 0.44 0.70 0.71 0.84 (0.67) 0.65 0.77 0.75 0.15 0.76 1.00 0.75 0.15
DWRTFREIT 0.49 (0.09) 0.56 0.49 0.30 0.53 0.52 0.26 0.51 0.50 0.56 (0.67) 0.36 0.79 0.81 0.14 0.77 0.75 1.00 0.09
GOLDSGOLD 0.19 0.39 0.04 0.18 (0.11) 0.06 0.22 0.43 0.09 0.04 0.14 (0.05) 0.19 0.20 0.09 0.43 0.03 0.15 0.09 1.00
- 14. Prepared by: Pj de Marigny, DITMo Strategies Page 14 ©2012 RENOVATIO ASSET MANAGEMENT, LLC
HEDGE FUND STRATEGIES 3-YEAR CORRELATION MATRIX (Monthly 3Y ending 03/12)
Converti CTA Distressed Emerging
Equity
Mkt
Event Fixed Inc Global
Long/
Short
Merger Relative Short Funds Of DITMo SP500 WFBIX BXM CSHY DWRTF GOLDS
Arbitrage Global Securities Markets Neutral Driven Arbitrage Macro Equity Arbitrage Value Selling Funds CovdCall Index Lehman AGG CovdCall High Yld REIT GOLD
ConvertibleArbitrage 1.00 0.21 0.84 0.83 0.51 0.85 0.90 0.62 0.77 0.68 0.93 (0.55) 0.78 0.61 0.63 (0.05) 0.52 0.82 0.56 (0.07)
CTA Global 0.21 1.00 0.25 0.36 0.33 0.33 0.15 0.81 0.41 0.35 0.30 (0.22) 0.57 0.33 0.33 0.11 0.27 0.13 0.15 0.49
Distressed Securities 0.84 0.25 1.00 0.87 0.77 0.98 0.78 0.65 0.91 0.81 0.94 (0.51) 0.89 0.66 0.66 (0.25) 0.58 0.73 0.50 (0.12)
Emerging Markets 0.83 0.36 0.87 1.00 0.71 0.90 0.71 0.79 0.92 0.71 0.92 (0.41) 0.90 0.51 0.58 (0.11) 0.48 0.67 0.44 0.03
Equity Mkt Neutral 0.51 0.33 0.77 0.71 1.00 0.82 0.43 0.59 0.85 0.78 0.72 (0.35) 0.83 0.58 0.57 (0.33) 0.57 0.37 0.23 (0.10)
Event Driven 0.85 0.33 0.98 0.90 0.82 1.00 0.75 0.72 0.96 0.85 0.96 (0.54) 0.93 0.70 0.71 (0.25) 0.64 0.71 0.53 (0.07)
Fixed Inc Arbitrage 0.90 0.15 0.78 0.71 0.43 0.75 1.00 0.55 0.61 0.59 0.81 (0.46) 0.67 0.53 0.50 0.05 0.40 0.77 0.43 0.02
Global Macro 0.62 0.81 0.65 0.79 0.59 0.72 0.55 1.00 0.77 0.56 0.72 (0.47) 0.86 0.53 0.56 0.02 0.43 0.48 0.36 0.42
Long/Short Equity 0.77 0.41 0.91 0.92 0.85 0.96 0.61 0.77 1.00 0.82 0.93 (0.52) 0.95 0.69 0.74 (0.29) 0.65 0.63 0.51 (0.03)
Merger Arbitrage 0.68 0.35 0.81 0.71 0.78 0.85 0.59 0.56 0.82 1.00 0.80 (0.44) 0.80 0.67 0.69 (0.24) 0.71 0.63 0.45 (0.20)
Relative Value 0.93 0.30 0.94 0.92 0.72 0.96 0.81 0.72 0.93 0.80 1.00 (0.60) 0.90 0.70 0.72 (0.20) 0.62 0.78 0.58 (0.07)
Short Selling (0.55) (0.22) (0.51) (0.41) (0.35) (0.54) (0.46) (0.47) (0.52) (0.44) (0.60) 1.00 (0.50) (0.77) (0.70) 0.30 (0.48) (0.57) (0.59) (0.02)
Funds Of Funds 0.78 0.57 0.89 0.90 0.83 0.93 0.67 0.86 0.95 0.80 0.90 (0.50) 1.00 0.63 0.63 (0.18) 0.55 0.56 0.38 0.05
DITMo CovdCall 0.61 0.33 0.66 0.51 0.58 0.70 0.53 0.53 0.69 0.67 0.70 (0.77) 0.63 1.00 0.95 (0.34) 0.85 0.69 0.72 0.11
SP500 Index 0.63 0.33 0.66 0.58 0.57 0.71 0.50 0.56 0.74 0.69 0.72 (0.70) 0.63 0.95 1.00 (0.30) 0.88 0.75 0.79 0.12
WFBIX LehmanAGG (0.05) 0.11 (0.25) (0.11) (0.33) (0.25) 0.05 0.02 (0.29) (0.24) (0.20) 0.30 (0.18) (0.34) (0.30) 1.00 (0.27) (0.05) (0.12) 0.31
BXM CovdCall 0.52 0.27 0.58 0.48 0.57 0.64 0.40 0.43 0.65 0.71 0.62 (0.48) 0.55 0.85 0.88 (0.27) 1.00 0.65 0.65 0.02
CSHY High Yld 0.82 0.13 0.73 0.67 0.37 0.71 0.77 0.48 0.63 0.63 0.78 (0.57) 0.56 0.69 0.75 (0.05) 0.65 1.00 0.77 (0.02)
DWRTF REIT 0.56 0.15 0.50 0.44 0.23 0.53 0.43 0.36 0.51 0.45 0.58 (0.59) 0.38 0.72 0.79 (0.12) 0.65 0.77 1.00 0.04
GOLDS GOLD (0.07) 0.49 (0.12) 0.03 (0.10) (0.07) 0.02 0.42 (0.03) (0.20) (0.07) (0.02) 0.05 0.11 0.12 0.31 0.02 (0.02) 0.04 1.00
HEDGE FUND STRATEGIES 1-YEAR CORRELATION MATRIX (Monthly 1Y ending 03/12)
Converti CTA Distressed Emerging
Equity
Mkt
Event Fixed Inc Global L/S Merger Relative Short Funds Of DITMo SP500 WFBIX BXM CSHY DWRTF GOLDS
Arbitrage Global Securities Markets Neutral Driven Arbitrage Macro Equity Arbitrage Value Selling Funds CovdCall Index Lehman AGG CovdCall High Yld REIT GOLD
Convertible Arbitrage 1.00 0.17 0.94 0.86 0.82 0.92 0.88 0.64 0.92 0.83 0.97 (0.40) 0.89 0.47 0.47 (0.18) 0.42 0.53 0.27 (0.24)
CTA Global 0.17 1.00 0.19 0.36 0.33 0.24 0.26 0.83 0.27 0.23 0.23 (0.14) 0.47 0.09 0.08 0.37 0.06 0.19 0.10 0.37
Distressed Securities 0.94 0.19 1.00 0.89 0.95 0.99 0.84 0.63 0.98 0.90 0.98 (0.23) 0.92 0.45 0.49 (0.20) 0.53 0.57 0.34 (0.27)
Emerging Markets 0.86 0.36 0.89 1.00 0.87 0.90 0.68 0.76 0.95 0.76 0.89 (0.05) 0.94 0.15 0.23 (0.05) 0.23 0.34 0.07 (0.13)
Equity Mkt Neutral 0.82 0.33 0.95 0.87 1.00 0.96 0.75 0.66 0.96 0.93 0.92 (0.11) 0.91 0.43 0.50 (0.26) 0.58 0.52 0.33 (0.21)
Event Driven 0.92 0.24 0.99 0.90 0.96 1.00 0.81 0.66 0.99 0.91 0.98 (0.21) 0.94 0.44 0.49 (0.21) 0.54 0.53 0.32 (0.20)
Fixed Inc Arbitrage 0.88 0.26 0.84 0.68 0.75 0.81 1.00 0.66 0.79 0.79 0.87 (0.63) 0.80 0.70 0.61 (0.11) 0.53 0.69 0.49 (0.11)
Global Macro 0.64 0.83 0.63 0.76 0.66 0.66 0.66 1.00 0.69 0.55 0.68 (0.32) 0.83 0.25 0.24 0.25 0.15 0.36 0.18 0.27
Long/Short Equity 0.92 0.27 0.98 0.95 0.96 0.99 0.79 0.69 1.00 0.90 0.97 (0.14) 0.95 0.38 0.45 (0.20) 0.48 0.50 0.27 (0.19)
Merger Arbitrage 0.83 0.23 0.90 0.76 0.93 0.91 0.79 0.55 0.90 1.00 0.89 (0.21) 0.80 0.60 0.67 (0.33) 0.73 0.65 0.45 (0.24)
Relative Value 0.97 0.23 0.98 0.89 0.92 0.98 0.87 0.68 0.97 0.89 1.00 (0.35) 0.94 0.48 0.48 (0.22) 0.49 0.53 0.28 (0.23)
Short Selling (0.40) (0.14) (0.23) (0.05) (0.11) (0.21) (0.63) (0.32) (0.14) (0.21) (0.35) 1.00 (0.23) (0.67) (0.39) 0.12 (0.20) (0.37) (0.29) (0.15)
Funds Of Funds 0.89 0.47 0.92 0.94 0.91 0.94 0.80 0.83 0.95 0.80 0.94 (0.23) 1.00 0.29 0.30 (0.08) 0.32 0.39 0.15 (0.16)
DITMo CovdCall 0.47 0.09 0.45 0.15 0.43 0.44 0.70 0.25 0.38 0.60 0.48 (0.67) 0.29 1.00 0.93 (0.38) 0.82 0.83 0.82 0.17
SP500 Index 0.47 0.08 0.49 0.23 0.50 0.49 0.61 0.24 0.45 0.67 0.48 (0.39) 0.30 0.93 1.00 (0.36) 0.90 0.88 0.89 0.23
WFBIX LehmanAGG (0.18) 0.37 (0.20) (0.05) (0.26) (0.21) (0.11) 0.25 (0.20) (0.33) (0.22) 0.12 (0.08) (0.38) (0.36) 1.00 (0.35) (0.06) (0.03) 0.33
BXM CovdCall 0.42 0.06 0.53 0.23 0.58 0.54 0.53 0.15 0.48 0.73 0.49 (0.20) 0.32 0.82 0.90 (0.35) 1.00 0.86 0.81 (0.03)
CSHY High Yld 0.53 0.19 0.57 0.34 0.52 0.53 0.69 0.36 0.50 0.65 0.53 (0.37) 0.39 0.83 0.88 (0.06) 0.86 1.00 0.88 0.12
DWRTF REIT 0.27 0.10 0.34 0.07 0.33 0.32 0.49 0.18 0.27 0.45 0.28 (0.29) 0.15 0.82 0.89 (0.03) 0.81 0.88 1.00 0.35
GOLDS GOLD (0.24) 0.37 (0.27) (0.13) (0.21) (0.20) (0.11) 0.27 (0.19) (0.24) (0.23) (0.15) (0.16) 0.17 0.23 0.33 (0.03) 0.12 0.35 1.00
- 15. Prepared by: Pj de Marigny, DITMo Strategies Page 15 ©2012 RENOVATIO ASSET MANAGEMENT, LLC
-5.00%
0.00%
5.00%
10.00%
15.00%
20.00%
0.00% 5.00% 10.00% 15.00% 20.00% 25.00% 30.00%
Convertible Arbitrage
CTA Global
Distressed Securities
Emerging Markets
Equity Market Neutral
Event Driven
Fixed Income Arbitrage
Global Macro
Long/Short Equity
Merger Arbitrage
Relative Value
Short Selling
Funds Of Funds
DITMo
SP500
Lehman AGG
BXMCovdCall
High Yld
REIT
GOLD
Hedge Strategies / Indexes (10Years: 04/02 — 03/12)
Average Annualized Standard Deviation (10Y ending Mar 2012)
AverageAnnualizedReturn(10YendingMar2012)
- 16. Prepared by: Pj de Marigny, DITMo Strategies Page 16 ©2012 RENOVATIO ASSET MANAGEMENT, LLC
Annualized RETURN PROBABILITY CHART (Discrete Monthly 10Y ending 03/12)
Mo. Return Convert CTA Distressed Emerging Equity Mkt Event Fixed Inc Global L/S Merger Relative Short Funds Of DITMo SP500 WFBIX BXM CSHY DWRFT GOLDS
= or > Arbitrage Global Securities Markets Neutral Driven Arbitrage Macro Equity Arbitrage Value Selling Funds CovdCall Index Leh AGG CovdCall High Yield REIT GOLD
14% 0% 1% 9% 22% 0% 1% 0% 0% 0% 0% 0% 0% 0% 0% 3% 0% 2% 12% 29% 84%
13% 1% 3% 18% 31% 0% 2% 0% 0% 1% 0% 0% 0% 0% 0% 4% 0% 3% 19% 33% 87%
12% 2% 6% 32% 41% 0% 5% 0% 0% 3% 0% 0% 0% 0% 0% 6% 0% 5% 27% 37% 90%
11% 4% 12% 50% 51% 0% 12% 0% 1% 7% 0% 0% 0% 0% 1% 8% 0% 8% 37% 41% 92%
10% 8% 20% 67% 62% 0% 24% 1% 5% 13% 0% 2% 1% 0% 3% 11% 0% 12% 49% 46% 94%
9% 16% 31% 81% 72% 0% 41% 3% 16% 24% 0% 7% 2% 0% 10% 15% 0% 18% 60% 50% 96%
8% 27% 44% 91% 81% 0% 60% 10% 37% 37% 3% 20% 3% 2% 25% 19% 0% 25% 71% 54% 97%
7% 41% 58% 96% 87% 1% 77% 26% 62% 53% 16% 41% 4% 6% 47% 25% 0% 33% 80% 59% 98%
6% 56% 71% 99% 92% 7% 89% 50% 83% 69% 47% 66% 7% 15% 70% 31% 0% 42% 88% 63% 99%
5% 71% 82% 100% 96% 30% 95% 74% 95% 82% 81% 85% 10% 33% 87% 38% 0% 52% 93% 67% 99%
4% 83% 90% 100% 98% 68% 99% 90% 99% 91% 97% 95% 15% 55% 96% 45% 1% 62% 96% 71% 99%
3% 91% 95% 100% 99% 93% 100% 98% 100% 96% 100% 99% 22% 76% 99% 53% 5% 71% 98% 75% 100%
2% 96% 98% 100% 100% 99% 100% 100% 100% 98% 100% 100% 29% 90% 100% 61% 20% 79% 99% 78% 100%
1% 98% 99% 100% 100% 100% 100% 100% 100% 100% 100% 100% 38% 97% 100% 68% 50% 85% 100% 82% 100%
0% 100% 100% 100% 100% 100% 100% 100% 100% 100% 100% 100% 47% 99% 100% 75% 80% 90% 100% 85% 100%
-1% 100% 100% 100% 100% 100% 100% 100% 100% 100% 100% 100% 57% 100% 100% 81% 96% 94% 100% 87% 100%
-2% 100% 100% 100% 100% 100% 100% 100% 100% 100% 100% 100% 66% 100% 100% 86% 100% 97% 100% 90% 100%
-3% 100% 100% 100% 100% 100% 100% 100% 100% 100% 100% 100% 75% 100% 100% 90% 100% 98% 100% 92% 100%
-4% 100% 100% 100% 100% 100% 100% 100% 100% 100% 100% 100% 82% 100% 100% 93% 100% 99% 100% 93% 100%
-5% 100% 100% 100% 100% 100% 100% 100% 100% 100% 100% 100% 88% 100% 100% 95% 100% 100% 100% 95% 100%
-6% 100% 100% 100% 100% 100% 100% 100% 100% 100% 100% 100% 92% 100% 100% 97% 100% 100% 100% 96% 100%
-7% 100% 100% 100% 100% 100% 100% 100% 100% 100% 100% 100% 95% 100% 100% 98% 100% 100% 100% 97% 100%
-8% 100% 100% 100% 100% 100% 100% 100% 100% 100% 100% 100% 97% 100% 100% 99% 100% 100% 100% 98% 100%
-9% 100% 100% 100% 100% 100% 100% 100% 100% 100% 100% 100% 99% 100% 100% 99% 100% 100% 100% 98% 100%
-10% 100% 100% 100% 100% 100% 100% 100% 100% 100% 100% 100% 99% 100% 100% 100% 100% 100% 100% 99% 100%
© 2012 RENOVATIO ASSET MANAGEMENT Highlight is the Annualized Return at > or = 95% Confidence Data Source: Edhec Risk Institute; SPX/BXM/WFBIX/CSHY/DWRFT/GOLDS Comdty Index Data by Bloomberg, LP; DITMo provided by Renovatio Asset Mgt
Annualized RISK PROBABILITY CHART (Discrete χ2 Monthly 10Y ending 03/12)
Std Dev. Convert CTA Distressed Emerging Equity Mkt Event Fixed Inc Global Long/Short Merger Relative Short Funds Of DITMo SP500 WFBIX BXM CSHY DWRFT GOLDS
is less than: Arbitrage Global Securities Markets Neutral Driven Arbitrage Macro Equity Arbitrage Value Selling Funds CovdCall Index LehAGG CovdCall High Yield REIT GOLD
26% 100% 100% 100% 100% 100% 100% 100% 100% 100% 100% 100% 99% 100% 100% 96% 100% 99% 100% 40% 89%
25% 100% 100% 100% 100% 100% 100% 100% 100% 100% 100% 100% 99% 100% 100% 94% 100% 99% 100% 33% 86%
24% 100% 100% 100% 100% 100% 100% 100% 100% 100% 100% 100% 98% 100% 100% 93% 100% 99% 100% 26% 82%
23% 100% 100% 100% 100% 100% 100% 100% 100% 100% 100% 100% 98% 100% 100% 90% 100% 98% 100% 20% 77%
22% 100% 100% 100% 99% 100% 100% 100% 100% 100% 100% 100% 97% 100% 100% 87% 100% 98% 100% 14% 72%
21% 100% 100% 100% 99% 100% 100% 100% 100% 100% 100% 100% 95% 100% 100% 83% 100% 97% 99% 10% 65%
20% 100% 100% 100% 99% 100% 100% 100% 100% 100% 100% 100% 93% 100% 100% 78% 100% 96% 99% 6% 58%
19% 100% 100% 100% 98% 100% 100% 100% 100% 100% 100% 100% 91% 100% 100% 72% 100% 94% 99% 3% 49%
18% 100% 99% 100% 97% 100% 100% 100% 100% 100% 100% 100% 87% 100% 100% 64% 100% 91% 98% 2% 39%
17% 100% 99% 100% 95% 100% 100% 100% 100% 100% 100% 100% 82% 100% 100% 55% 100% 87% 97% 1% 30%
16% 99% 99% 100% 93% 100% 100% 100% 100% 100% 100% 100% 75% 100% 100% 44% 100% 82% 95% 0% 20%
15% 99% 98% 100% 89% 100% 100% 100% 100% 99% 100% 100% 67% 100% 100% 33% 100% 75% 93% 0% 13%
14% 98% 96% 100% 84% 100% 100% 100% 100% 99% 100% 100% 56% 100% 100% 22% 100% 66% 89% 0% 7%
13% 97% 93% 99% 76% 100% 99% 100% 100% 98% 100% 100% 43% 100% 100% 13% 100% 54% 83% 0% 3%
12% 95% 89% 98% 65% 100% 99% 100% 100% 96% 100% 100% 29% 100% 100% 6% 100% 40% 74% 0% 1%
11% 90% 82% 97% 51% 100% 98% 100% 100% 93% 100% 100% 17% 99% 100% 2% 100% 25% 61% 0% 0%
10% 83% 71% 94% 34% 100% 95% 100% 100% 87% 100% 99% 7% 99% 99% 0% 100% 13% 45% 0% 0%
9% 71% 54% 88% 18% 100% 91% 99% 99% 76% 100% 99% 2% 97% 98% 0% 100% 4% 27% 0% 0%
8% 53% 34% 78% 6% 100% 81% 97% 98% 59% 100% 97% 0% 93% 96% 0% 100% 1% 12% 0% 0%
7% 30% 14% 59% 1% 100% 64% 93% 94% 36% 100% 92% 0% 85% 90% 0% 99% 0% 3% 0% 0%
6% 10% 3% 32% 0% 99% 38% 82% 84% 14% 99% 79% 0% 67% 76% 0% 96% 0% 0% 0% 0%
5% 1% 0% 9% 0% 95% 12% 58% 60% 2% 95% 53% 0% 36% 47% 0% 86% 0% 0% 0% 0%
4% 0% 0% 0% 0% 81% 1% 21% 23% 0% 79% 17% 0% 7% 13% 0% 58% 0% 0% 0% 0%
3% 0% 0% 0% 0% 38% 0% 1% 1% 0% 34% 1% 0% 0% 0% 0% 13% 0% 0% 0% 0%
2.5% 0% 0% 0% 0% 12% 0% 0% 0% 0% 10% 0% 0% 0% 0% 0% 2% 0% 0% 0% 0%
© 2012 RENOVATIO ASSET MANAGEMENT Highlight is 95% Confidence using 10 df annualizing monthly data Data Source: Edhec Risk Institute; SPX/BXM/WFBIX/CSHY/DWRFT/GOLDS Comdty Index Data by Bloomberg, LP; DITMo provided by Renovatio Asset Mgt
- 17. Prepared by: Pj de Marigny, DITMo Strategies Page 17 ©2012 RENOVATIO ASSET MANAGEMENT, LLC
Annualized RETURN PROBABILITY CHART (Discrete Monthly 5Y ending 03/12)
Mo. Return Convert CTA Distressed Emerging Equity Mkt Event Fixed Inc Global L/S Merger Relative Short Funds Of DITMo SP500 WFBIX BXM CSHY DWRFT GOLDS
= or > Arbitrage Global Securities Markets Neutral Driven Arbitrage Macro Equity Arbitrage Value Selling Funds CovdCall Index Leh AGG CovdCall High Yield REIT GOLD
14% 6% 3% 3% 11% 0% 1% 0% 0% 2% 0% 0% 4% 0% 0% 9% 0% 7% 20% 21% 79%
13% 9% 6% 6% 14% 0% 2% 0% 0% 3% 0% 1% 5% 0% 0% 11% 0% 9% 24% 23% 81%
12% 13% 10% 9% 17% 0% 4% 1% 1% 5% 0% 1% 7% 0% 1% 13% 0% 11% 29% 25% 84%
11% 17% 15% 14% 21% 0% 6% 2% 2% 8% 0% 3% 9% 0% 2% 15% 0% 14% 35% 27% 86%
10% 23% 22% 20% 26% 0% 11% 5% 6% 11% 0% 7% 11% 0% 5% 18% 0% 17% 40% 29% 88%
9% 29% 31% 28% 32% 0% 16% 9% 12% 17% 1% 12% 14% 0% 10% 21% 0% 21% 47% 31% 90%
8% 37% 41% 37% 37% 0% 24% 16% 22% 23% 3% 20% 17% 1% 17% 24% 0% 25% 53% 33% 91%
7% 45% 52% 47% 44% 1% 34% 25% 37% 31% 9% 31% 21% 2% 27% 27% 0% 30% 59% 35% 93%
6% 53% 63% 57% 50% 4% 44% 37% 54% 40% 24% 44% 25% 3% 40% 31% 1% 35% 65% 37% 94%
5% 61% 73% 67% 56% 12% 55% 50% 70% 50% 47% 58% 30% 7% 54% 35% 3% 41% 71% 40% 95%
4% 69% 81% 76% 63% 25% 66% 64% 83% 60% 71% 71% 35% 12% 68% 40% 11% 46% 77% 42% 96%
3% 76% 88% 83% 69% 44% 76% 76% 92% 69% 89% 82% 41% 20% 80% 44% 26% 52% 81% 45% 97%
2% 82% 93% 89% 74% 65% 84% 85% 97% 77% 97% 90% 47% 31% 88% 49% 48% 58% 85% 47% 97%
1% 87% 96% 93% 80% 82% 90% 92% 99% 84% 99% 95% 53% 44% 94% 53% 71% 64% 89% 50% 98%
0% 91% 98% 96% 84% 93% 94% 96% 100% 90% 100% 98% 59% 58% 97% 58% 88% 69% 92% 52% 98%
-1% 94% 99% 98% 88% 98% 97% 98% 100% 94% 100% 99% 65% 71% 99% 62% 96% 74% 94% 55% 99%
-2% 96% 100% 99% 91% 100% 99% 99% 100% 96% 100% 100% 70% 81% 100% 67% 99% 79% 96% 57% 99%
-3% 98% 100% 100% 93% 100% 99% 100% 100% 98% 100% 100% 75% 89% 100% 71% 100% 83% 97% 60% 99%
-4% 99% 100% 100% 95% 100% 100% 100% 100% 99% 100% 100% 80% 95% 100% 75% 100% 87% 98% 62% 100%
-5% 99% 100% 100% 97% 100% 100% 100% 100% 99% 100% 100% 84% 98% 100% 79% 100% 90% 99% 65% 100%
-6% 100% 100% 100% 98% 100% 100% 100% 100% 100% 100% 100% 88% 99% 100% 82% 100% 92% 99% 67% 100%
-7% 100% 100% 100% 99% 100% 100% 100% 100% 100% 100% 100% 91% 100% 100% 85% 100% 94% 100% 70% 100%
-8% 100% 100% 100% 99% 100% 100% 100% 100% 100% 100% 100% 93% 100% 100% 88% 100% 96% 100% 72% 100%
-9% 100% 100% 100% 100% 100% 100% 100% 100% 100% 100% 100% 95% 100% 100% 90% 100% 97% 100% 75% 100%
-10% 100% 100% 100% 100% 100% 100% 100% 100% 100% 100% 100% 97% 100% 100% 92% 100% 98% 100% 77% 100%
© 2012 RENOVATIO ASSET MANAGEMENT Highlight is the Annualized Return at > or = 95% Confidence Data Source: Edhec Risk Institute; SPX/BXM/WFBIX/CSHY/DWRFT/GOLDS Comdty Index Data by Bloomberg, LP; DITMo provided by Renovatio Asset Mgt
Annualized RISK PROBABILITY CHART (Discrete χ2 Monthly 5Y ending 03/12)
Std Dev. Convert CTA Distressed Emerging Equity Mkt Event Fixed Inc Global Long/Short Merger Relative Short Funds Of DITMo SP500 WFBIX BXM CSHY DWRFT GOLDS
is less than: Arbitrage Global Securities Markets Neutral Driven Arbitrage Macro Equity Arbitrage Value Selling Funds CovdCall Index LehAGG CovdCall High Yield REIT GOLD
26% 100% 100% 100% 99% 100% 100% 100% 100% 100% 100% 100% 98% 100% 100% 86% 100% 97% 99% 6% 74%
25% 100% 100% 100% 99% 100% 100% 100% 100% 100% 100% 100% 97% 100% 100% 83% 100% 97% 99% 4% 68%
24% 100% 100% 100% 98% 100% 100% 100% 100% 100% 100% 100% 96% 100% 100% 79% 100% 95% 98% 2% 62%
23% 100% 100% 100% 97% 100% 100% 100% 100% 100% 100% 100% 94% 100% 100% 74% 100% 94% 98% 1% 55%
22% 100% 100% 100% 96% 100% 100% 100% 100% 100% 100% 100% 92% 100% 100% 67% 100% 92% 97% 1% 47%
21% 99% 100% 100% 95% 100% 100% 100% 100% 100% 100% 100% 90% 100% 100% 60% 100% 89% 95% 0% 39%
20% 99% 100% 100% 93% 100% 100% 100% 100% 100% 100% 100% 86% 100% 100% 52% 100% 85% 93% 0% 31%
19% 98% 100% 100% 91% 100% 100% 100% 100% 100% 100% 100% 82% 100% 100% 43% 100% 80% 91% 0% 23%
18% 98% 100% 100% 87% 100% 100% 100% 100% 99% 100% 100% 75% 100% 100% 34% 100% 74% 87% 0% 16%
17% 96% 100% 99% 82% 100% 100% 100% 100% 99% 100% 100% 68% 100% 100% 25% 100% 66% 82% 0% 10%
16% 95% 99% 99% 75% 100% 99% 100% 100% 98% 100% 100% 58% 100% 100% 16% 100% 57% 76% 0% 5%
15% 92% 99% 98% 66% 100% 99% 100% 100% 97% 100% 100% 47% 100% 100% 9% 100% 46% 67% 0% 2%
14% 87% 98% 97% 55% 100% 98% 100% 100% 95% 100% 100% 35% 100% 100% 5% 100% 34% 56% 0% 1%
13% 81% 97% 95% 42% 100% 97% 99% 100% 92% 100% 99% 23% 99% 100% 2% 100% 22% 43% 0% 0%
12% 71% 95% 91% 29% 100% 95% 99% 100% 87% 100% 99% 13% 98% 99% 0% 100% 12% 30% 0% 0%
11% 58% 91% 85% 16% 100% 91% 97% 100% 79% 100% 98% 6% 97% 98% 0% 100% 5% 17% 0% 0%
10% 41% 83% 75% 7% 100% 84% 95% 99% 67% 100% 96% 2% 94% 96% 0% 100% 1% 7% 0% 0%
9% 24% 71% 60% 2% 100% 72% 89% 98% 50% 100% 92% 0% 88% 93% 0% 100% 0% 2% 0% 0%
8% 10% 53% 40% 0% 99% 54% 79% 95% 30% 100% 83% 0% 77% 85% 0% 100% 0% 0% 0% 0%
7% 2% 30% 19% 0% 97% 31% 61% 89% 12% 99% 67% 0% 58% 70% 0% 99% 0% 0% 0% 0%
6% 0% 10% 5% 0% 91% 10% 35% 74% 2% 98% 41% 0% 32% 45% 0% 96% 0% 0% 0% 0%
5% 0% 1% 0% 0% 75% 1% 10% 46% 0% 92% 14% 0% 8% 16% 0% 87% 0% 0% 0% 0%
4% 0% 0% 0% 0% 40% 0% 1% 12% 0% 71% 1% 0% 0% 1% 0% 60% 0% 0% 0% 0%
3% 0% 0% 0% 0% 5% 0% 0% 0% 0% 24% 0% 0% 0% 0% 0% 14% 0% 0% 0% 0%
2.5% 0% 0% 0% 0% 0% 0% 0% 0% 0% 5% 0% 0% 0% 0% 0% 2% 0% 0% 0% 0%
© 2012 RENOVATIO ASSET MANAGEMENT Highlight is 95% Confidence using 10 df annualizing monthly data Data Source: Edhec Risk Institute; SPX/BXM/WFBIX/CSHY/DWRFT/GOLDS Comdty Index Data by Bloomberg, LP; DITMo provided by Renovatio Asset Mgt
- 18. Prepared by: Pj de Marigny, DITMo Strategies Page 18 ©2012 RENOVATIO ASSET MANAGEMENT, LLC
Annualized RETURN PROBABILITY CHART (Discrete Monthly 3Y ending 03/12)
Mo. Return Convertible CTA Distressed Emerging EquityMkt Event Fixed Inc Global L/Short Merger Relative Short Funds Of DITMo SP500 WFBIX BXM CSHY DWRFT GOLDS
= or > Arbitrage Global Securities Markets Neutral Driven Arbitrage Macro Equity Arbitrage Value Selling Funds CovdCall Index Lehman Agg CovdCall HiYield REIT GOLD
14% 83% 1% 88% 75% 0% 56% 35% 1% 44% 0% 28% 0% 0% 11% 78% 0% 59% 93% 93% 77%
13% 89% 2% 92% 79% 0% 66% 52% 2% 52% 0% 42% 0% 1% 21% 81% 0% 64% 95% 94% 79%
12% 93% 3% 95% 83% 0% 74% 69% 5% 60% 0% 56% 0% 1% 35% 83% 0% 68% 96% 94% 82%
11% 95% 5% 97% 87% 0% 82% 83% 10% 68% 0% 70% 1% 3% 52% 85% 0% 73% 97% 95% 83%
10% 97% 7% 98% 90% 0% 88% 92% 18% 75% 2% 81% 1% 7% 69% 88% 0% 77% 98% 96% 85%
9% 99% 11% 99% 92% 1% 92% 97% 29% 81% 8% 90% 1% 13% 83% 89% 0% 81% 99% 96% 87%
8% 99% 16% 100% 94% 3% 95% 99% 43% 86% 25% 95% 1% 22% 92% 91% 0% 84% 99% 97% 89%
7% 100% 22% 100% 96% 13% 97% 100% 58% 90% 52% 98% 2% 35% 97% 93% 1% 87% 100% 97% 90%
6% 100% 29% 100% 97% 33% 99% 100% 72% 94% 78% 99% 2% 49% 99% 94% 2% 90% 100% 97% 91%
5% 100% 37% 100% 98% 60% 99% 100% 83% 96% 94% 100% 3% 63% 100% 95% 9% 92% 100% 98% 93%
4% 100% 46% 100% 99% 83% 100% 100% 91% 97% 99% 100% 4% 76% 100% 96% 22% 94% 100% 98% 94%
3% 100% 56% 100% 99% 95% 100% 100% 96% 98% 100% 100% 5% 86% 100% 97% 43% 96% 100% 98% 95%
2% 100% 65% 100% 99% 99% 100% 100% 98% 99% 100% 100% 6% 93% 100% 98% 67% 97% 100% 99% 95%
1% 100% 73% 100% 100% 100% 100% 100% 99% 100% 100% 100% 8% 97% 100% 98% 85% 98% 100% 99% 96%
0% 100% 80% 100% 100% 100% 100% 100% 100% 100% 100% 100% 10% 99% 100% 99% 95% 98% 100% 99% 97%
-1% 100% 86% 100% 100% 100% 100% 100% 100% 100% 100% 100% 12% 100% 100% 99% 99% 99% 100% 99% 97%
-2% 100% 91% 100% 100% 100% 100% 100% 100% 100% 100% 100% 15% 100% 100% 99% 100% 99% 100% 99% 98%
-3% 100% 94% 100% 100% 100% 100% 100% 100% 100% 100% 100% 18% 100% 100% 99% 100% 100% 100% 99% 98%
-4% 100% 97% 100% 100% 100% 100% 100% 100% 100% 100% 100% 21% 100% 100% 100% 100% 100% 100% 100% 99%
-5% 100% 98% 100% 100% 100% 100% 100% 100% 100% 100% 100% 25% 100% 100% 100% 100% 100% 100% 100% 99%
-6% 100% 99% 100% 100% 100% 100% 100% 100% 100% 100% 100% 29% 100% 100% 100% 100% 100% 100% 100% 99%
-7% 100% 100% 100% 100% 100% 100% 100% 100% 100% 100% 100% 34% 100% 100% 100% 100% 100% 100% 100% 99%
-8% 100% 100% 100% 100% 100% 100% 100% 100% 100% 100% 100% 39% 100% 100% 100% 100% 100% 100% 100% 99%
-9% 100% 100% 100% 100% 100% 100% 100% 100% 100% 100% 100% 44% 100% 100% 100% 100% 100% 100% 100% 100%
-10% 100% 100% 100% 100% 100% 100% 100% 100% 100% 100% 100% 49% 100% 100% 100% 100% 100% 100% 100% 100%
© 2012 RENOVATIO ASSET MANAGEMENT Highlight is the Annualized Return at > or = 95% Confidence Data Source: Edhec Risk Institute; SPX/BXM/WFBIX/CSHY/DWRFT/GOLDS Comdty Index Data by Bloomberg, LP; DITMo provided by Renovatio Asset Mgt
Annualized RISK PROBABILITY CHART (Discrete χ2 Monthly 3Y ending 03/12)
Std Dev. Convertible CTA Distressed Emerging EquityMkt Event Fixed Inc Global L/Short Merger Relative Short Funds Of DITMo SP500 WFBIX BXM CSHY DWRFT GOLDS
is less than: Arbitrage Global Securities Markets Neutral Driven Arbitrage Macro Equity Arbitrage Value Selling Funds CovdCall Index Lehman Agg CovdCall HiYield REIT GOLD
26% 100% 100% 100% 100% 100% 100% 100% 100% 100% 100% 100% 98% 100% 100% 95% 100% 100% 100% 36% 79%
25% 100% 100% 100% 100% 100% 100% 100% 100% 100% 100% 100% 97% 100% 100% 94% 100% 99% 100% 29% 74%
24% 100% 100% 100% 100% 100% 100% 100% 100% 100% 100% 100% 96% 100% 100% 92% 100% 99% 100% 23% 68%
23% 100% 100% 100% 100% 100% 100% 100% 100% 100% 100% 100% 95% 100% 100% 89% 100% 99% 100% 17% 62%
22% 100% 100% 100% 99% 100% 100% 100% 100% 100% 100% 100% 94% 100% 100% 86% 100% 98% 100% 12% 55%
21% 100% 100% 100% 99% 100% 100% 100% 100% 100% 100% 100% 91% 100% 100% 82% 100% 98% 100% 8% 47%
20% 100% 100% 100% 99% 100% 100% 100% 100% 100% 100% 100% 88% 100% 100% 76% 100% 97% 99% 5% 38%
19% 100% 100% 100% 98% 100% 100% 100% 100% 100% 100% 100% 84% 100% 100% 70% 100% 95% 99% 2% 29%
18% 100% 100% 100% 97% 100% 100% 100% 100% 100% 100% 100% 79% 100% 100% 62% 100% 93% 99% 1% 21%
17% 100% 100% 100% 96% 100% 100% 100% 100% 100% 100% 100% 71% 100% 100% 52% 100% 90% 98% 0% 14%
16% 100% 100% 100% 94% 100% 100% 100% 100% 99% 100% 100% 63% 100% 100% 42% 100% 85% 97% 0% 8%
15% 100% 99% 100% 90% 100% 100% 100% 100% 99% 100% 100% 52% 100% 100% 30% 100% 79% 95% 0% 4%
14% 100% 99% 99% 85% 100% 100% 100% 100% 98% 100% 100% 40% 100% 100% 20% 100% 70% 92% 0% 2%
13% 99% 98% 99% 78% 100% 99% 100% 100% 97% 100% 100% 27% 100% 100% 11% 100% 59% 88% 0% 0%
12% 98% 96% 98% 67% 100% 99% 100% 100% 94% 100% 100% 16% 100% 100% 5% 100% 45% 81% 0% 0%
11% 97% 93% 96% 53% 100% 98% 100% 100% 90% 100% 100% 7% 100% 100% 2% 100% 30% 70% 0% 0%
10% 94% 88% 93% 37% 100% 95% 100% 100% 83% 100% 100% 2% 100% 100% 0% 100% 16% 56% 0% 0%
9% 88% 78% 86% 20% 100% 91% 100% 99% 71% 100% 99% 0% 99% 100% 0% 100% 6% 37% 0% 0%
8% 77% 62% 73% 7% 100% 81% 100% 98% 52% 100% 98% 0% 98% 100% 0% 100% 1% 19% 0% 0%
7% 58% 39% 53% 1% 100% 64% 99% 95% 29% 100% 96% 0% 94% 99% 0% 100% 0% 6% 0% 0%
6% 31% 16% 26% 0% 100% 38% 97% 87% 9% 100% 89% 0% 85% 97% 0% 99% 0% 1% 0% 0%
5% 8% 2% 6% 0% 99% 12% 89% 66% 1% 100% 70% 0% 63% 88% 0% 98% 0% 0% 0% 0%
4% 0% 0% 0% 0% 97% 1% 65% 29% 0% 98% 33% 0% 25% 63% 0% 90% 0% 0% 0% 0%
3% 0% 0% 0% 0% 80% 0% 18% 2% 0% 85% 3% 0% 1% 16% 0% 56% 0% 0% 0% 0%
2.5% 0% 0% 0% 0% 54% 0% 3% 0% 0% 63% 0% 0% 0% 3% 0% 25% 0% 0% 0% 0%
© 2012 RENOVATIO ASSET MANAGEMENT Highlight is 95% Confidence using 10 df annualizing monthly data Data Source: Edhec Risk Institute; SPX/BXM/WFBIX/CSHY/DWRFT/GOLDS Comdty Index Data by Bloomberg, LP; DITMo provided by Renovatio Asset Mgt
- 19. Prepared by: Pj de Marigny, DITMo Strategies Page 19 ©2012 RENOVATIO ASSET MANAGEMENT, LLC
Annualized RETURN PROBABILITY CHART (Discrete Monthly 1Y ending 03/12)
Mo. Return Convertible CTA Distressed Emerging EquityMkt Event Fixed Inc Global L/Short Merger Relative Short Funds Of DITMo SP500 WFBIX BXM CSHY DWRFT GOLDS
= or > Arbitrage Global Securities Markets Neutral Driven Arbitrage Macro Equity Arbitrage Value Selling Funds CovdCall Index Lehman Agg CovdCall HiYield REIT GOLD
14% 3% 4% 28% 31% 0% 15% 0% 2% 26% 0% 3% 53% 1% 8% 36% 0% 41% 24% 48% 58%
13% 5% 5% 32% 34% 0% 18% 0% 3% 29% 0% 5% 55% 2% 12% 38% 0% 43% 27% 49% 59%
12% 7% 6% 36% 37% 1% 21% 0% 4% 33% 1% 8% 57% 3% 17% 40% 0% 46% 31% 51% 61%
11% 10% 8% 41% 40% 2% 25% 0% 6% 36% 2% 12% 59% 4% 24% 43% 1% 48% 34% 52% 62%
10% 14% 10% 46% 43% 4% 29% 1% 9% 40% 4% 17% 61% 5% 31% 45% 2% 51% 38% 54% 63%
9% 19% 13% 51% 46% 7% 34% 3% 13% 44% 8% 23% 64% 8% 40% 47% 4% 54% 42% 55% 64%
8% 25% 16% 55% 49% 12% 38% 8% 18% 48% 14% 31% 66% 11% 50% 49% 8% 56% 46% 57% 66%
7% 32% 20% 60% 52% 19% 43% 16% 24% 53% 23% 39% 68% 15% 59% 51% 15% 59% 51% 58% 67%
6% 39% 24% 65% 56% 29% 48% 30% 31% 57% 35% 48% 70% 19% 69% 54% 25% 61% 55% 60% 68%
5% 47% 28% 70% 59% 40% 54% 47% 39% 61% 48% 57% 72% 25% 77% 56% 38% 64% 59% 61% 69%
4% 55% 33% 74% 62% 52% 59% 65% 48% 65% 61% 66% 74% 31% 84% 58% 53% 66% 63% 63% 71%
3% 63% 38% 78% 65% 64% 64% 80% 56% 69% 74% 74% 76% 38% 89% 60% 67% 69% 67% 64% 72%
2% 71% 44% 81% 68% 75% 69% 90% 65% 73% 84% 81% 78% 45% 93% 62% 80% 71% 71% 66% 73%
1% 78% 50% 85% 71% 84% 73% 96% 73% 76% 91% 87% 80% 53% 96% 65% 89% 73% 75% 67% 74%
0% 84% 55% 88% 74% 90% 78% 99% 80% 79% 95% 91% 81% 61% 98% 67% 95% 76% 78% 69% 75%
-1% 88% 61% 90% 77% 95% 81% 100% 86% 83% 98% 95% 83% 68% 99% 69% 98% 78% 81% 70% 77%
-2% 92% 67% 92% 80% 97% 85% 100% 90% 85% 99% 97% 85% 75% 99% 71% 99% 80% 84% 72% 78%
-3% 95% 72% 94% 82% 99% 88% 100% 94% 88% 100% 98% 86% 81% 100% 73% 100% 82% 87% 73% 79%
-4% 97% 77% 96% 84% 100% 90% 100% 96% 90% 100% 99% 87% 86% 100% 75% 100% 84% 89% 75% 80%
-5% 98% 81% 97% 87% 100% 93% 100% 98% 92% 100% 100% 89% 90% 100% 77% 100% 85% 91% 76% 81%
-6% 99% 85% 98% 88% 100% 94% 100% 99% 93% 100% 100% 90% 93% 100% 79% 100% 87% 93% 77% 82%
-7% 99% 88% 98% 90% 100% 96% 100% 99% 95% 100% 100% 91% 95% 100% 81% 100% 88% 94% 79% 83%
-8% 100% 91% 99% 92% 100% 97% 100% 100% 96% 100% 100% 92% 97% 100% 82% 100% 90% 96% 80% 84%
-9% 100% 93% 99% 93% 100% 98% 100% 100% 97% 100% 100% 93% 98% 100% 84% 100% 91% 97% 81% 85%
-10% 100% 95% 99% 94% 100% 99% 100% 100% 98% 100% 100% 94% 99% 100% 86% 100% 92% 97% 82% 86%
© 2012 RENOVATIO ASSET MANAGEMENT Highlight is the Annualized Return at > or = 95% Confidence Data Source: Edhec Risk Institute; SPX/BXM/WFBIX/CSHY/DWRFT/GOLDS Comdty Index Data by Bloomberg, LP; DITMo provided by Renovatio Asset Mgt
Annualized RISK PROBABILITY CHART (Discrete χ2 Monthly 1Y ending 03/12)
Std Dev. Convertible CTA Distressed Emerging EquityMkt Event Fixed Inc Global L/Short Merger Relative Short Funds Of DITMo SP500 WFBIX BXM CSHY DWRFT GOLDS
is less than: Arbitrage Global Securities Markets Neutral Driven Arbitrage Macro Equity Arbitrage Value Selling Funds CovdCall Index Lehman Agg CovdCall HiYield REIT GOLD
26% 100% 100% 100% 100% 100% 100% 100% 100% 100% 100% 100% 96% 100% 100% 94% 100% 98% 100% 59% 36%
25% 100% 100% 100% 100% 100% 100% 100% 100% 100% 100% 100% 94% 100% 100% 92% 100% 97% 100% 53% 29%
24% 100% 100% 100% 99% 100% 100% 100% 100% 100% 100% 100% 93% 100% 100% 90% 100% 96% 100% 46% 23%
23% 100% 100% 100% 99% 100% 100% 100% 100% 100% 100% 100% 90% 100% 100% 87% 100% 95% 100% 38% 17%
22% 100% 100% 100% 99% 100% 100% 100% 100% 100% 100% 100% 87% 100% 100% 83% 100% 94% 100% 31% 12%
21% 100% 100% 100% 98% 100% 100% 100% 100% 100% 100% 100% 83% 100% 100% 78% 100% 91% 100% 23% 8%
20% 100% 100% 100% 97% 100% 100% 100% 100% 100% 100% 100% 78% 100% 100% 72% 100% 88% 100% 17% 5%
19% 100% 100% 100% 96% 100% 100% 100% 100% 99% 100% 100% 72% 100% 100% 64% 100% 84% 99% 11% 2%
18% 100% 100% 100% 95% 100% 100% 100% 100% 99% 100% 100% 64% 100% 100% 56% 100% 79% 99% 7% 1%
17% 100% 100% 100% 92% 100% 100% 100% 100% 99% 100% 100% 55% 100% 100% 46% 100% 72% 99% 3% 0%
16% 100% 100% 99% 89% 100% 100% 100% 100% 98% 100% 100% 44% 100% 100% 35% 100% 63% 98% 1% 0%
15% 100% 100% 99% 83% 100% 99% 100% 100% 97% 100% 100% 33% 100% 100% 25% 100% 52% 97% 1% 0%
14% 100% 99% 98% 76% 100% 99% 100% 100% 94% 100% 100% 22% 100% 100% 15% 100% 40% 95% 0% 0%
13% 100% 99% 97% 66% 100% 98% 100% 100% 91% 100% 100% 13% 100% 100% 8% 100% 28% 91% 0% 0%
12% 100% 97% 95% 53% 100% 96% 100% 100% 85% 100% 100% 6% 100% 100% 3% 100% 16% 85% 0% 0%
11% 100% 95% 91% 38% 100% 92% 100% 100% 76% 100% 100% 2% 100% 100% 1% 100% 7% 77% 0% 0%
10% 99% 91% 84% 22% 100% 86% 100% 100% 63% 100% 100% 0% 99% 100% 0% 100% 2% 63% 0% 0%
9% 99% 83% 72% 10% 100% 76% 100% 99% 45% 100% 100% 0% 98% 100% 0% 100% 0% 46% 0% 0%
8% 97% 70% 54% 3% 100% 59% 100% 98% 25% 100% 99% 0% 94% 99% 0% 100% 0% 26% 0% 0%
7% 92% 48% 31% 0% 100% 36% 100% 95% 9% 100% 97% 0% 87% 98% 0% 100% 0% 9% 0% 0%
6% 81% 22% 10% 0% 99% 13% 100% 86% 1% 99% 91% 0% 70% 94% 0% 100% 0% 1% 0% 0%
5% 56% 4% 1% 0% 95% 2% 100% 65% 0% 98% 74% 0% 40% 82% 0% 99% 0% 0% 0% 0%
4% 19% 0% 0% 0% 80% 0% 99% 27% 0% 90% 39% 0% 9% 51% 0% 94% 0% 0% 0% 0%
3% 1% 0% 0% 0% 36% 0% 90% 2% 0% 56% 4% 0% 0% 9% 0% 70% 0% 0% 0% 0%
2.5% 0% 0% 0% 0% 11% 0% 72% 0% 0% 25% 0% 0% 0% 1% 0% 41% 0% 0% 0% 0%
© 2012 RENOVATIO ASSET MANAGEMENT Highlight is the Annualized Return at > or = 95% Confidence Data Source: Edhec Risk Institute; SPX/BXM/WFBIX/CSHY/DWRFT/GOLDS Comdty Index Data by Bloomberg, LP; DITMo provided by Renovatio Asset Mgt
- 20. Prepared by: Pj de Marigny, DITMo Strategies Page 20 ©2012 RENOVATIO ASSET MANAGEMENT, LLC
$1,919
$1,228
$1,492
$2,442
$1,631
$-
$500
$1,000
$1,500
$2,000
$2,500
$3,000
30/04/2002
31/07/2002
31/10/2002
31/01/2003
30/04/2003
31/07/2003
31/10/2003
31/01/2004
30/04/2004
31/07/2004
31/10/2004
31/01/2005
30/04/2005
31/07/2005
31/10/2005
31/01/2006
30/04/2006
31/07/2006
31/10/2006
31/01/2007
30/04/2007
31/07/2007
31/10/2007
31/01/2008
30/04/2008
31/07/2008
31/10/2008
31/01/2009
30/04/2009
31/07/2009
31/10/2009
31/01/2010
30/04/2010
31/07/2010
31/10/2010
31/01/2011
30/04/2011
31/07/2011
31/10/2011
31/01/2012
DITMo
SPX
Funds Of Funds
High Yld
REIT
SPX, FoHF, HYB, REIT, DITMo®
(SP500, Fund of Hedge Funds, High Yield Bonds, Real Estate Investment Trust)
$1,919
$1,883
$900
$1,000
$1,100
$1,200
$1,300
$1,400
$1,500
$1,600
$1,700
$1,800
$1,900
$2,000
30/04/2002
31/07/2002
31/10/2002
31/01/2003
30/04/2003
31/07/2003
31/10/2003
31/01/2004
30/04/2004
31/07/2004
31/10/2004
31/01/2005
30/04/2005
31/07/2005
31/10/2005
31/01/2006
30/04/2006
31/07/2006
31/10/2006
31/01/2007
30/04/2007
31/07/2007
31/10/2007
31/01/2008
30/04/2008
31/07/2008
31/10/2008
31/01/2009
30/04/2009
31/07/2009
31/10/2009
31/01/2010
30/04/2010
31/07/2010
31/10/2010
31/01/2011
30/04/2011
31/07/2011
31/10/2011
31/01/2012
DITMo
Relative Value
Relative Value vs DITMo®
DITMo®
is a short-expiry, “Deep” ITM Buy/Write
income strategy with an aggressive income objective
10Y VAMI ending 03/12
10Y VAMI ending 03/12
- 21. Prepared by: Pj de Marigny, DITMo Strategies Page 21 ©2012 RENOVATIO ASSET MANAGEMENT, LLC
2002 2003 2004 2005 2006 2007 2008 2009 2010 2011 Ytd end 03/12
Short Selling Emerging Markets REIT GOLD REIT GOLD Short Selling High Yld GOLD Short Selling SP500
GOLD High Yld Distressed Securities Emerging Markets GOLD Emerging Markets CTA Global Convertible Arbitrage REIT GOLD REIT
CTA Global REIT Emerging Markets Long/Short Equity Emerging Markets Global Macro GOLD Emerging Markets High Yld DITMo GOLD
Convertible Arbitrage Distressed Securities Event Driven Global Macro Event Driven Long/Short Equity Lehman AGG Distressed Securities Distressed Securities Distressed Securities Distressed Securities
Fixed Income Arbitrage SP500 High Yld DITMo Distressed Securities Funds Of Funds Merger Arbitrage BXMCovdCall SP500 BXMCovdCall Long/Short Equity
Distressed Securities Event Driven DITMo Distressed Securities Merger Arbitrage CTA Global Global Macro Event Driven Convertible Arbitrage REIT Emerging Markets
Emerging Markets BXMCovdCall SP500 REIT SP500 Event Driven Equity Mkt Neutral Fixed Income Arbitrage Event Driven High Yld Convertible Arbitrage
Global Macro GOLD Long/Short Equity Event Driven BXMCovdCall DITMo DITMo GOLD Emerging Markets Fixed Income Arb Event Driven
Equity Market Neutral Long/Short Equity BXMCovdCall Short Selling Convertible Arbitrage Relative Value Relative Value SP500 Fixed Income Arb Merger Arbitrage High Yld
Lehman AGG Global Macro Funds Of Funds Funds Of Funds DITMo Merger Arbitrage Fixed Income Arb Relative Value Relative Value Equity Mkt Neutral DITMo
High Yld DITMo Fixed Income Arbitrage Equity Mkt Neutral High Yld Equity Mkt Neutral Event Driven REIT CTA Global Lehman AGG BXMCovdCall
Relative Value Relative Value Relative Value Relative Value Relative Value Short Selling Long/Short Equity Long/Short Equity Long/Short Equity Relative Value Relative Value
Funds Of Funds CTA Global GOLD Merger Arbitrage Long/Short Equity Distressed Securities Funds Of Funds Funds Of Funds DITMo Convertible Arbitrage Fixed Income Arbitrage
Merger Arbitrage Funds Of Funds CTA Global Fixed Income Arb Funds Of Funds BXMCovdCall Distressed Securities Global Macro Global Macro Event Driven Funds Of Funds
Event Driven Convertible Arbitrage Merger Arbitrage BXMCovdCall Global Macro Fixed Income Arb High Yld Merger Arbitrage Merger Arbitrage Long/Short Equity Global Macro
DITMo Fixed Income Arbitrage Equity Market Neutral SP500 Equity Mkt Neutral Convertible Arbitrage Convertible Arbitrage DITMo BXMCovdCall Emerging Markets Merger Arbitrage
REIT Merger Arbitrage Global Macro High Yld Fixed Income Arb SP500 BXMCovdCall Equity Market Neutral Equity Mkt Neutral Global Macro Equity Market Neutral
Long/Short Equity Equity Market Neutral Convertible Arbitrage CTA Global CTA Global High Yld Emerging Markets Lehman AGG Funds Of Funds CTA Global Lehman AGG
BXMCovdCall Lehman AGG Lehman AGG Convertible Arbitrage Lehman AGG Lehman AGG SP500 CTA Global Lehman AGG SP500 CTA Global
SP500 Short Selling Short Selling Lehman AGG Short Selling REIT REIT Short Selling Short Selling Funds Of Funds Short Selling
Date 2003 2004 2005 2006 2007 2008 2009 2010 2011
YTD end
Mar2012
SP500 26.38% 8.99% 3.00% 13.62% 3.53% -38.49% 23.45% 12.78% 0.00% 12.00%
REIT 27.75% 26.45% 8.38% 30.52% -20.97% -42.54% 21.03% 23.32% 5.52% 9.84%
GOLD 19.37% 5.54% 17.92% 23.15% 30.98% 5.77% 24.36% 29.52% 10.06% 6.69%
Distressed Securities 27.34% 17.89% 9.23% 15.26% 7.18% -21.29% 30.40% 14.09% 6.13% 6.28%
Long/Short Equity 19.31% 8.62% 11.33% 11.76% 10.56% -18.92% 20.01% 9.76% 3.13% 6.18%
Emerging Markets 31.27% 14.30% 17.18% 18.84% 20.79% -33.65% 37.87% 11.18% 1.97% 6.07%
Convertible Arb 10.80% 1.10% -1.92% 12.33% 3.86% -26.50% 46.78% 12.28% 3.15% 5.27%
Event Driven 20.48% 12.43% 7.31% 15.47% 9.62% -18.49% 25.74% 11.54% 3.13% 5.24%
High Yld 27.94% 11.95% 2.26% 11.91% 2.65% -26.17% 54.22% 14.42% 5.47% 5.03%
DITMo 13.45% 10.87% 9.33% 12.01% 9.50% -8.93% 8.39% 8.66% 6.28% 5.01%
BXMCovdCall 19.37% 8.30% 4.25% 13.33% 6.59% -28.65% 25.91% 5.86% 5.72% 4.99%
Relative Value 12.15% 5.71% 5.24% 11.85% 9.43% -14.91% 21.16% 9.97% 3.80% 4.35%
Fixed Income Arb 8.35% 6.26% 4.64% 7.43% 6.01% -17.40% 24.49% 9.98% 4.89% 2.99%
Funds Of Funds 11.45% 7.08% 6.81% 11.24% 10.07% -19.72% 10.67% 5.21% -0.81% 2.90%
Global Macro 17.25% 4.60% 9.49% 7.50% 12.93% -3.22% 10.39% 8.47% 1.09% 2.64%
Merger Arbitrage 8.34% 4.83% 4.95% 13.71% 9.09% -2.35% 9.97% 6.45% 4.34% 2.32%
Equity Mkt Neutral 6.29% 4.71% 6.53% 7.47% 8.34% -8.36% 5.07% 5.37% 4.16% 1.90%
Lehman AGG -1.18% -0.90% -2.92% -0.52% 1.56% 0.82% 0.81% 2.73% 3.93% -0.38%
CTA Global 11.64% 5.17% -0.33% 5.87% 9.91% 15.61% -1.91% 9.78% 0.87% -0.69%
Short Selling -23.87% -4.66% 7.28% -8.28% 7.40% 31.52% -20.53% -16.62% 23.29% -12.74%
- 22. Prepared by: Pj de Marigny, DITMo Strategies Page 22 ©2012 RENOVATIO ASSET MANAGEMENT, LLC
Hedge Strategy Classification Definitions
1 -Convertible Arbitrage
Convertible Arbitrage funds attempt to exploit anomalies in prices of corporate securities that are convertible into common stock (convertible bonds, warrants and convertible preferred stock). Convertible bonds tend to be under-
priced because of market segmentation (i.e. investors discount securities that are likely to change types). Managers typically buy (or sometimes sell) these securities and then hedge part or all of the associated risks by shorting the
stock. If the issuer does well, the convertible bond behaves like a stock; if the issuer does poorly, the convertible bond behaves like distressed debt. Delta neutrality is often targeted. Over-hedging is appropriate when there is con-
cern about default as the excess short position may partially hedge against a reduction in credit quality. As a matter of fact, an ever growing number of Convertible Arbitrage managers turn to arbitrage credit risk rather than implicit
volatility. Convertible Arbitrage is a Relative Value strategy. Hence Convertible Arbitrage funds may be used as “Risk Reducers” in portfolios.
2 -CTA Global
Commodity Trading Advisers, commonly referred as to CTA Global funds or Managed Futures, invest in listed financial and commodity markets as well as in currency markets all over the world. Most of CTA Global funds play on
market momentum (i.e. trend followers) or follow discretionary strategies. The others either use quantitative, fundamental or technical analysis. The great majority of these funds are specialized “boutiques” relying on proprietary
trading techniques. Most of CTA Global funds use leverage either explicitly or implicitly (through the use of derivatives) to increase the impact of market moves on their portfolios. CTA Global funds’ performances tend to offer a
relatively good protection against market downturns. As a consequence, CTA Global funds may be used as “Risk Reducers” in portfolios.
3 -Distressed Securities
Distressed Securities funds attempt to benefit from the securities of undervalued companies which are subject to financial distress (i.e. restructuring, liquidation, bankruptcy, etc.).
A typical strategy consists of buying the distressed company’s securities (from the senior secured debt to the ordinary shares) at a discount price, holding them through the whole restructuring process, and selling them after they
have appreciated again. The performances of these funds depends on their ability to assess the probability of success of the different restructuring options, which in turn allows them to identify the securities that may be interesting
in the case of an arbitrage strategy and the eventual amount of the investment to be made. Distressed Securities strategies are generally characterized by a relatively high return and a significant correlation with major bond and/or
stock indexes. Consequently, Distressed Securities strategies may be used as “Return Enhancers” in portfolios.
4-Emerging Markets
Emerging Markets funds invest in equity or debt of emerging (less mature i.e. less efficient and less liquid) markets, which tend to have higher inflation and volatile growth.
Some Emerging Markets funds allocate all their capital to individual regions while others diversify their investments and shift their weightings among these regions according to their market views. Short selling is not permitted in
many emerging markets, and, therefore, effective hedging is often not available, although Brady debt can be partially hedged via U.S. Treasury futures and currency markets. Emerging Markets strategies are generally character-
ized by a relatively high return and a significant correlation with major bond and/or stock indexes. Hence, Emerging Markets strategies may be used as “Return Enhancers” in portfolios.
5 -Equity Market Neutral
Equity Market Neutral funds take long and short positions in such a way that the impact of the overall market is minimized. Market neutral can imply dollar neutral, beta neutral or both. A dollar neutral strategy has zero net invest-
ment (i.e., equal dollar amounts in long and short positions). A beta neutral strategy targets a zero total portfolio beta (i.e., the beta of the long side equals the beta of the short side). While dollar neutrality has the virtue of simplici-
ty, beta neutrality better defines a strategy that is uncorrelated with the market return. Many practitioners of market-neutral long/short equity trading balance their longs and shorts in the same sector or industry. By being sector
neutral, they avoid the risk of market swings affecting some industries or sectors differently than others. Equity Market Neutral is a Relative Value strategy. Hence Equity Market Neutral funds may be used as “Risk Reducers” in
6-Event Driven
Event Driven funds tend to take advantage of pricing anomalies resulting from corporate transactions and special situations. Event Driven funds’ success depends on their ability to assess the probability of failure / success of
such corporate events. This strategy includes:
Ø Deal Arbitrage (long/short equity securities of companies involved in corporate transactions)
Ø Bankruptcy/Distressed (long undervalued securities of companies that are usually in financial distress)
Ø Multi-strategy (deals with both deal arbitrage and bankruptcy)
Event Driven strategies are generally characterized by a relatively high return and a significant correlation with major stock and / or bond indexes. Consequently, Event Driven strategies may be used as “Return Enhancers” in
portfolios.
7-Fixed Income Arbitrage
Fixed Income Arbitrage funds try to exploit pricing anomalies within Fixed Income Markets. They generally attempt to hedge out most interest rate risk by taking offsetting positions in similar securities (government bonds, corpo-
rate bonds, asset-backed securities, etc.). There are two major categories of fixed income arbitrage strategies: relative value and market neutral.
> Relative value: This strategy seeks to construct a portfolio which takes advantage of the pricing anomalies detected while maintaining a diversified risk profile. Neutrality with regard to the duration is not systematically targeted.
The main objective is to maximize the portfolio’s return
while controlling the risk.
> Market neutral: This strategy involves taking advantage of pricing anomalies between two or more sectors in the fixed income market, or between different securities in the same sector. The long and short positions are generally
rebalanced in such a way as to maintain neutrality with regard to the market risk or the duration.
Fixed Income Arbitrage is a Relative Value strategy. Hence Fixed Income Arbitrage funds may be used as “Risk Reducers” in portfolios.
- 23. Prepared by: Pj de Marigny, DITMo Strategies Page 23 ©2012 RENOVATIO ASSET MANAGEMENT, LLC
9-Long/Short Equity
Long/Short Equity funds invest in both long and short equity portfolios. They do not seek a permanently neutral position in terms of market risk (beta or dollar - neutral), even though that may occur temporarily, when the manager has no "feel" for the market.
Long/Short Equity funds may switch from a long net position to a short net position, carry out arbitrage between cyclical stocks and growth stocks, or large capitalization firms and more modest-sized firms, etc. The investments generally concern regional
stocks, or, more often, very specific sectors. Since Long / Short Equity funds generate a large part of their profits thanks to their long bias, Long/Short Equity may be regarded as a Directional strategy. Long / Short Equity funds may use leverage to enhance
returns. As a result, Long / Short Equity funds are generally characterized by a relatively high return and a significant correlation with major stock indexes. Consequently, Long/Short Equity funds may be used as “Return Enhancers” in portfolios.
10-Merger Arbitrage
Merger Arbitrage funds (which may also be referred as to Risk Arbitrage or Deal Arbitrage funds) invest in companies involved in a Merger or Acquisition process. They typically go long the targeted company and sell short the stock of the acquiring company.
This strategy aims to capture the price spread (i.e. Merger Spread) between the current market price of the targeted company and the price offered by the acquiring firm. The performances of Merger Arbitrage funds greatly depend on their ability to assess
the probability of success / failure of the corporate transactions. The exposure of Merger Arbitrage funds to market risk greatly depends on the transactions arrangement. Merger Arbitrage strategies are generally characterized by a relatively high return and a
significant correlation with major stock indexes. Consequently, Merger Arbitrage strategies may be used as “Return Enhancers” in portfolios.
11-Relative Value
The objective of Relative Value funds is to take advantage of the relative price differentials between related instruments (stocks, bonds…). This strategy usually includes Fixed Income Arbitrage / Equity Market Neutral / Convertible Arbitrage sub-indexes (see
their respective sections for more details on the strategies). Relative Value strategies are generally characterized by low return and a correlation with major bond and stock indexes that is close to 0. Consequently, Relative Value strategies may be used as
“Risk Reducers” in portfolios.
12-Short Selling
Short Selling funds sell securities short in anticipation of being able to buy them back in the future at a lower price. The manager estimates that the securities, or the market, are overvalued or anticipates earnings disappointments, often due to accounting
irregularities, new competition, change of management, etc. Short Selling funds are often used as a hedge to offset long-only portfolios and by those who feel that the market is approaching a bearish cycle. Short Selling funds are by nature strongly exposed
to extreme risks since their short positions present infinite loss potential. As a result, short selling is strictly regulated and should be regarded with caution. Short Selling is a Directional strategy generally characterized by relatively volatile returns and a signifi-
cant correlation with major stock indexes Due to their short bias Short Selling funds may be used as “Risk Diversifiers” in portfolios.
13-Fund of Funds
Funds of Funds are portfolios of Hedge Funds offering the investor exposure to a wide range of alternative investment styles and strategies. Funds of Funds generally allocate capital to 15-30 hedge funds to achieve efficient risk diversification. Nevertheless
a smaller number of funds may be used to concentrate capital on a particular strategy. Such funds of hedge funds aim to post high returns and are less concerned by manager and event risks. Conversely, a larger number of funds may be used to control for
extreme risks.
Most Funds of Funds invest in portfolios diversified by manager and strategy which enable them to produce consistent absolute returns with low levels of risk. As a result, Funds of Funds are often used as portable alpha strategies or as substitutes for cash in
portfolios. Funds of Funds have very compelling characteristics since they provide hedge fund investors with access to experienced management, enhanced liquidity and less risk of default. They may also provide hedge funds investors with access to closed
funds. The double fee structure is the main flip side of investing in funds of funds.
(Source: EDHEC-RISK Asset Management Research / www.edhec-research.com)
8-Global Macro
Global Macro funds aim to profit from changes in global economies, typically brought about by shifts in government policy that impact interest rates, in turn affecting currency, stock, and bond markets. They participate in all
major markets – equities, bonds, currencies and commodities – though not always at the same time. Global Macro funds use leverage and derivatives to accentuate the impact of market moves. They also utilize hedging, but
the leveraged directional investments tend to have the largest impact on performance. Very frequently, Global Macro funds dilute the risk by investing in other directional funds; however, some funds may also focus their
efforts on a reduced number of bets. Most global macro funds follow a top/down type management process. As a result, the importance of stock picking is reduced in comparison with the asset allocation process (both strate-
gic and tactical). Due to a large exposure to stock, bond, currency and other markets, Global Macro is regarded as a Multi-Directional strategy. Consequently, Global Macro funds may be used as “Return Diversifiers” in
- 24. Prepared by: Pj de Marigny, DITMo Strategies Page 24 ©2012 RENOVATIO ASSET MANAGEMENT, LLC
Manager Interview
This week's manager interview is with Peter J. de Marigny, from DITMo®.
Read Interview
This Week's Featured Hedge Fund Manager:
Peter J. deMarigny, DITMo® of Renovatio Asset Management
Browse our library of interviews, designed to give you an up-front and personal feel for each specific fund. Find an investment philosophy that interests you, compare strategies,
view risk controls and get a better understanding of the rationale behind each investment vehicle. Each hedge fund manager featured on HedgeCo.Net is answering these ques-
tions in hopes of eliminating confusion while creating as much transparency as possible for the potential investor. Have more questions? Email the manager directly!
"The DITMo® philosophy is the belief that markets overpay for downside protection from certain equities over the short term."
DITMo® focuses on only those metrics that determine the likelihood of option exercise to provide an aggressive income.
What is your investment philosophy?
DITMo® is a “Buy-Write” portfolio for INCOME employing “Deep-In-The-Money” covered calls. This is a different strategy from typical Covered Call Indexes / Funds. DITMo® Portfolio is devised to mimic the “DITMo®
Index” that is an algorithmic representation of a Deep-In-The-Money Buy-Write strategy. Similarly to how one would expect the “XYZ SP500 Fund” to proxy the SP500 Index, DITMo® Portfolio is expected to follow the risk/
return metrics of the DITMo® Index. (The DITMo® Index in the “DITMo® Hedge Strategy Monthly” report juxtaposing 20 Hedged Strategies & Indexes is available for free download on www.HedgeCo.net/blogs .)
The DITMo® philosophy is the belief that markets overpay for downside protection from certain equities over the short term. DITMo® strategy identifies short-term, high probability “relative stability” by creating a portfolio of
“Deep-In-The-Money” covered calls that are anticipated to be exercised creating a high yield payoff from option premiums and dividends. DITMo® focuses on one objective: AGGRESSIVE INCOME employing “covered”
equities to create a high yield payoff. We believe the optimal risk/return income payoff is created employing Deep-In-The-Money covered calls. Custodians (banks/brokers) allow these covered call strategies in IRAs/ERISA
accounts (since the positions are “covered” there is no UBIT exposure). Where the DITMo® strategy differs from typical “At-The-Money” Covered Calls is that ATM Covered Calls (the default strategy of most funds and index-
es) – is a “Growth Income” objective whereas, Deep “ITM” objective is 100% Income to have ALL positions exercised (i.e. “Called-Away”) providing an INCOME stream from Option Premiums and Dividends. DITMo® fo-
cuses on only those metrics that determine the likelihood of option exercise to provide an aggressive income. The guiding principle is to increase probability of option exercise (distinct from the managers of the more common
ATM Covered Call Funds). The DITMo® selection metrics include short-term fundamental, statistical and supply/demand measurements. This is the biggest distinction between the DITMo® Philosophy and most other manag-
ers that are looking for good long or good short positions. DITMo® screens for relative stability that is a counter-intuitive selection and “risk-driven” process requiring competencies of a financial risk manager more than a fun-
damental analyst or a prop derivatives trader. DITMo® is a “BUY-HOLD” portfolio of approximately 85 Buy-Writes that does not engage in Dynamic Delta Hedging. This Buy-Write style would categorize DITMo® an
“EVENT-DRIVEN” trading style within a “RELATIVE VALUE” classification that is expected to print similarly to DITMo® on a risk/return scattergram and VAMI Chart. Further characterizing categorization for allocation
purposes would include “STAT ARB” as DITMo® screens for distortions in option pricing (i.e. “Implied Volatility”) that provides the downside “cushion” protecting trading profits within a certain range.
- 25. Prepared by: Pj de Marigny, DITMo Strategies Page 25 ©2012 RENOVATIO ASSET MANAGEMENT, LLC
How was the strategy developed?
As the top consultant at a major wirehouse I perceived the need for an INCOME objective portfolio. I recognized there was a need by Treasurers for a complement to typical Corporate Cash Management vehicles. The choices for
enhancing return on cash management were either “reach for yield” (causing credit, duration or spread risks), adding market neutral hedge funds, or using equity structured products. Market neutral products have low downside risk,
muted upside returns and constrain liquidity. Equity structured products are indexes with knock-in features or barrier options or unmanaged baskets, again with constrained liquidity. Reaching for yield is offset by duration, spread,
credit, or extension/prepayment risks.
As a portfolio manager with additional certifications in financial risk and treasury I created a Buy-Write portfolio to proxy high yield payoffs that offered liquidity without the duration or credit risks of fixed portfolios as a comple-
mentary INCOME portfolio for corporate cash management. DITMo® was branded March 2005 while I was Treasurer for a holding company of a family office where my main function was to manage “excess cash” that was above
what was needed to fund operations. More recently DITMo® was offered out by my own and other registered advisors (recently with Renovatio Asset Management).
Who are your current and target clients?
DITMo® Portfolio originated on the affiliated retail manager platform of Smith Barney for Corporate Treasurers, Opportunistic Real Estate Developers and others who maintained large vacillating cash balances. Target clients are
Family Offices, LDI Investors (Pensions, Endowments & Foundations, Sovereigns), and Corp. Treasurers.
3 - What is your long/short ratio?
DITMo® typically is 114/14 in terms of long stocks/short calls, 75% hedge ratio, .30 or lower Beta, 4-6% SD with a short 2 to 4 month average expiration (holding period) of options. The short holding period implies the portfolio
turnover is about 33% per month with about 1 trade executed per trading day on an approximately 85 Buy-Write portfolio. The Morningstar Size/Style Matrix plots “Balanced” between Growth and Value and on the line between
“Large and Mid” Cap. These are artificial barriers in terms of portfolio management but Wealth Advisors use this information for allocation.
4 - What makes your trading model unique?
I do not know of any other managers employing this strategy or investable indexes. Executing a DITM income strategy, unlike many of the other hedge strategies, is found to work best when portfolio management is “RISK-
DRIVEN.” That is, the DITMo® portfolio is devised to follow a set of risk metrics using DITM Buy-Writes. This “Risk-Driven” portfolio approach allows DITMo® Portfolio to track the DITMo® Index that is an algorithmic return
series based on the SP500. In this way, DITMo® Portfolio can offer a 10Y pro-forma risk/return series similar to how you would expect the Vanguard SP500 to have tracked the SP500.
5 - What gives you an edge in this area?
DITMo® has a manager edge in DITM income strategies relating to its manager competencies in its unique RISK-DRIVEN, DITM Buy-Write process as follows:
Manager Competencies of a DITM portfolio for income must include derivatives trading, portfolio management and financial risk experience or training.
The short-expiry nature and relative stability nature of DITM requires a “RISK-DRIVEN” selection process (Request the “DITMo® Process Slide”) that is counter-intuitive to fundamental analysis and typical portfolio management
processes.
Derivative traders widely recognize DITM as an income strategy but DITM INDEX writing is not a high yield strategy. DITM or ITM Index Buy-Writes are limited as to the option price known as “Implied VOL” that is muted
because of the diversification of the index. DITMo® Strategy employs INDIVIDUAL, Short-expiry DITM Buy-Writes.
6 - What benchmarks do you employ for performance analysis?
DITMo® Index (offered monthly in the “DITMo® Hedge Strategy Monthly” report) is an “algo” benchmark of SPX. Both SPX and the DITMo® Index are used as benchmarks.
The DITMo® Portfolio strives for HIGH Correlation with SPX with LOW BETA. High Correlation is desirable for this type of strategy striving for “SINGLE FACTOR” risk as “CORRELATION” is NOT a risk factor, rather it
identifies the source of risk but NOT IN SCALE. For risk SCALING, BETA is generally used, therefore, for DITMo Buy-Writes, what is desirable is HIGH Correlation and LOW Beta. For Long-Only portfolios R-sq and Correla-
tion may indicate higher risk associated with the benchmark index, however, in hedged portfolios there may be a significant difference where identification of the risk factor (Correl) is beneficial as is the case using DITM options.
- 26. Prepared by: Pj de Marigny, DITMo Strategies Page 26 ©2012 RENOVATIO ASSET MANAGEMENT, LLC
7 - In what types of markets does your fund perform best?
DITM Covered Calls perform similarly in up, sideways and slightly down markets. Generally, the portfolio will outperform SPX in all conditions except strong up equity markets where DITM is capped in upside at about 12%.
DITM Covered Calls utilizing INDIVIDUAL securities (as does DITMo® Portfolio) are not very sensitive to “LOW VOL” environments as DITM Index Calls since even in low VOL environments there are a number of events
spiking individual securities offering Buy-Write opportunities of overpriced “relative stability.”
The most challenging environment for DITM Covered Calls is an equity market that experiences most of its gains and losses in very few months or a single quarter. DITM Covered Calls offers a downside “CUSHION” but an
egregious drawdown within any single holding period (2-4 months) would not sufficiently cover all losses. The “cushion” is about 1.4 standard deviations in any holding period that is a self-correcting risk control that enlarges in
times of high VOL that requires greater downside protection, and conversely, contracts during periods of low VOL that requires a more shallow cushion – but remains a STEADY measure of protection standardized in terms of
Standard Deviation.
8 - Do you use leverage?
DITMo® Portfolio is offered out as an SMA (managed account) brokered and custodied at Merrill Lynch but may be client directed. If the account is “TAX-Deferred” then margin is not allowed due to UBIT. For taxable accounts
leverage is used ONLY to REPLACE the positions expected to be exercised at the monthly expiration.
For example, if a Buy-Write is IBM May 185 and it is today 15May with IBM offered at 205, it is expected that we will lose the position on expiration a week hence and will use leverage to REPLACE the lost position. Very im-
portant, when monthly expiration comes the portfolio has a ZERO TARGET LEVERAGE that means it is expected the portfolio is fully invested after all exercised options but is not using margin (cash is close to zero). If the port-
folio did not replace lost positions there would be a large amount of non-deployed cash on expiration day that would require multiple trades within a smaller scope of time or if deployed slowly, the portfolio could drift away from
the benchmark return. To mitigate this effect in Tax-Deferred accounts that may not use leverage, average expiry is somewhat elongated mitigating non-deployed cash.
On taxable accounts the portfolio is expected to lose 25% to 50% of its positions monthly that would require up to 33% leverage. This extra 33% leverage, however, is not “added risk leverage” to any meaningful degree; it is simp-
ly replacing those positions that are extremely likely to be called away within a couple of weeks.
9 - At what asset level would your fund reach capacity?
DITMo® Portfolio requires extreme flexibility with a 100k (one thousand options) capacity equating to about $350 million. After this point there would be a number of “partial fills” and incremental execution costs requiring
“algo” trading and increasing the number of holdings.
Once the capacity point is reached the portfolio is considering entering into other asset classes and markets. The most interesting characteristic about DITMo® Portfolio for Family Offices and Institutions is that the manager will
EXECUTE A “PORTABLE ALPHA” strategy on an existing portfolio (option overlay) that would then allow the hedged portion of an existing portfolio to be “ported” to DITMo® Portfolio that effectively replaces a portion of an
existing portfolio with a DITM Buy-Write mitigating taxable implications and averting “write and roll” strategies that are of limited use.