Good Stuff Happens in 1:1 Meetings: Why you need them and how to do them well
September 2012 MLS Statistics
1. September 2012
Area Delimited by Entire OK State MLS -
Single-Family Property Type
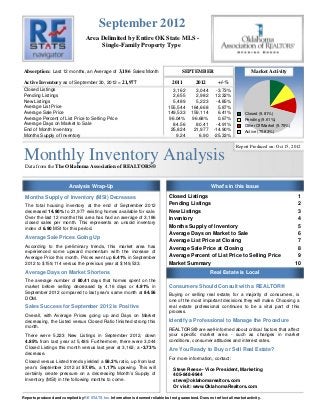
Absorption: Last 12 months, an Average of 3,186 Sales/Month SEPTEMBER Market Activity
Active Inventory as of September 30, 2012 = 21,977 2011 2012 +/-%
Closed Listings 3,162 3,044 -3.73%
Pending Listings 2,655 2,982 12.32%
New Listings 5,489 5,223 -4.85%
Average List Price 155,544 164,668 5.87%
Average Sale Price 149,533 159,114 6.41% Closed (9.81%)
Average Percent of List Price to Selling Price 96.04% 96.68% 0.67% Pending (9.61%)
Average Days on Market to Sale 84.56 80.41 -4.91% Other OffMarket (9.75%)
End of Month Inventory 25,824 21,977 -14.90% Active (70.83%)
Months Supply of Inventory 9.24 6.90 -25.33%
Report Produced on: Oct 15, 2012
Monthly Inventory Analysis
Data from the The Oklahoma Association of REALTORS®
Analysis Wrap-Up What's in this Issue
Months Supply of Inventory (MSI) Decreases Closed Listings 1
The total housing inventory at the end of September 2012 Pending Listings 2
decreased 14.90% to 21,977 existing homes available for sale. New Listings 3
Over the last 12 months this area has had an average of 3,186 Inventory 4
closed sales per month. This represents an unsold inventory
Months Supply of Inventory 5
index of 6.90 MSI for this period.
Average Days on Market to Sale 6
Average Sale Prices Going Up
Average List Price at Closing 7
According to the preliminary trends, this market area has Average Sale Price at Closing 8
experienced some upward momentum with the increase of
Average Price this month. Prices went up 6.41% in September Average Percent of List Price to Selling Price 9
2012 to $159,114 versus the previous year at $149,533. Market Summary 10
Average Days on Market Shortens Real Estate is Local
The average number of 80.41 days that homes spent on the
market before selling decreased by 4.16 days or 4.91% in Consumers Should Consult with a REALTOR®
September 2012 compared to last year’s same month at 84.56 Buying or selling real estate, for a majority of consumers, is
DOM. one of the most important decisions they will make. Choosing a
Sales Success for September 2012 is Positive real estate professional continues to be a vital part of this
process.
Overall, with Average Prices going up and Days on Market
decreasing, the Listed versus Closed Ratio finished strong this Identify a Professional to Manage the Procedure
month. REALTORS® are well-informed about critical factors that affect
There were 5,223 New Listings in September 2012, down your specific market area - such as changes in market
4.85% from last year at 5,489. Furthermore, there were 3,044 conditions, consumer attitudes and interest rates.
Closed Listings this month versus last year at 3,162, a -3.73%
Are You Ready to Buy or Sell Real Estate?
decrease.
For more information, contact:
Closed versus Listed trends yielded a 58.3% ratio, up from last
year’s September 2012 at 57.6%, a 1.17% upswing. This will Steve Reese - Vice President, Marketing
certainly create pressure on a decreasing Month’s Supply of 405-848-9944
Inventory (MSI) in the following months to come. steve@oklahomarealtors.com
Or visit: www.OklahomaRealtors.com
Reports produced and compiled by RE STATS Inc. Information is deemed reliable but not guaranteed. Does not reflect all market activity.
2. Monthly Inventory Analysis
Data from the The Oklahoma Association of
REALTORS®
September 2012
Closed Sales as of Oct 12, 2012
Closed Listings Report Produced on: Oct 15, 2012
Area Delimited by Entire OK State MLS - Single-Family Property Type
SEPTEMBER YEAR TO DATE (YTD)
2008 2009 2010 2011 2012 2008 2009 2010 2011 2012
3,475 3,467 31,048 30,061
3,162 3,044 28,004
2,604 26,431 26,419
1 Year 1 Year
-3.73% +13.79%
2 Year 2 Year
+16.90% +13.73%
5 YEAR MARKET ACTIVITY TRENDS 5yr SEP AVG = 3,150 3 MONTHS
5,000 High J 3,819
Jul 2008 = 4,041 U
4,000
Low L
3,000 Jan 2010 = 1,691 A 3,981
U
Closed Listings
2,000 Closed Listings
this G 4.24%
1,000 month at 3,044,
below the 5 yr SEP S 3,044
E
0
Jun 2008 Dec 2008Jun 2009 Dec 2009Jun 2010 Dec 2010Jun 2011 Dec 2011Jun 2012 average of 3,150 P -23.54%
CLOSED LISTINGS & BEDROOMS DISTRIBUTION BY PRICE
Distribution of Closed Listings by Price Range % AVDOM 2 Beds 3 Beds 4 Beds 5 Beds+
$25,000
and less 121 3.98% 87.4 65 46 10 0
$25,001
$75,000 511 16.79% 82.9 177 285 46 3
$75,001
$100,000 352 11.56% 81.4 75 247 28 2
$100,001
Contact an experienced REALTOR
Ready to Buy or Sell Real Estate?
$150,000 806 26.48% 74.4 123 561 117 5
$150,001
$200,000 551 18.10% 76.4 68 307 171 5
$200,001
$275,000 371 12.19% 80.9 34 150 173 14
$275,001
and up 332 10.91% 93.8 35 70 184 43
Total Closed Units: 3,044 80.4 577 1666 729 72
Total Closed Volume: 484,343,506 64.38M 223.14M 167.13M 29.69M
Average Closed Price: $159,114 $111,585 $133,939 $229,258 $412,324
Reports produced and compiled by RE STATS Inc. Information is deemed reliable but not guaranteed. Does not reflect all market activity. pp. 1
Steve Reese 405-848-9944 steve@oklahomarealtors.com
3. Monthly Inventory Analysis
Data from the The Oklahoma Association of
REALTORS®
September 2012
Pending Listings as of Oct 12, 2012
Pending Listings Report Produced on: Oct 15, 2012
Area Delimited by Entire OK State MLS - Single-Family Property Type
SEPTEMBER YEAR TO DATE (YTD)
2008 2009 2010 2011 2012 2008 2009 2010 2011 2012
3,409 31,832 31,385
3,196 30,071
2,982
2,453 2,655 27,168 26,942
1 Year 1 Year
+12.32% +16.49%
2 Year 2 Year
+21.57% +15.52%
5 YEAR MARKET ACTIVITY TRENDS 5yr SEP AVG = 2,939 3 MONTHS
5,000 High J 3,808
Apr 2010 = 4,803 U
4,000
Low L
3,000 Dec 2009 = 2,007 A 3,096
U
Pending Listings
2,000 Pending Listingsthis G -18.70%
1,000 month at 2,982,
above the 5 yr SEP S 2,982
E
0
Jun 2008 Dec 2008Jun 2009 Dec 2009Jun 2010 Dec 2010Jun 2011 Dec 2011Jun 2012 average of 2,939 P -3.68%
PENDING LISTINGS & BEDROOMS DISTRIBUTION BY PRICE
Distribution of Pending Listings by Price Range % AVDOM 2 Beds 3 Beds 4 Beds 5 Beds+
$25,000
and less 114 3.82% 61.6 60 49 5 0
$25,001
$75,000 498 16.70% 86.0 169 291 35 3
$75,001
$100,000 329 11.03% 80.9 80 216 33 0
$100,001
Contact an experienced REALTOR
Ready to Buy or Sell Real Estate?
$150,000 769 25.79% 67.1 119 541 104 5
$150,001
$200,000 562 18.85% 74.9 87 338 134 3
$200,001
$275,000 363 12.17% 90.6 47 160 143 13
$275,001
and up 347 11.64% 87.0 42 76 189 40
Total Pending Units: 2,982 102.0 604 1671 643 64
Total Pending Volume: 487,797,945 74.01M 230.62M 151.94M 31.22M
Average Listing Price: $168,732 $122,537 $138,016 $236,303 $487,791
Reports produced and compiled by RE STATS Inc. Information is deemed reliable but not guaranteed. Does not reflect all market activity. pp. 2
Steve Reese 405-848-9944 steve@oklahomarealtors.com
4. Monthly Inventory Analysis
Data from the The Oklahoma Association of
REALTORS®
September 2012
New Listings as of Oct 12, 2012
New Listings Report Produced on: Oct 15, 2012
Area Delimited by Entire OK State MLS - Single-Family Property Type
SEPTEMBER YEAR TO DATE (YTD)
2008 2009 2010 2011 2012 2008 2009 2010 2011 2012
5,727 55,784 55,046
5,408 5,489 53,344 53,429
5,144 5,223 50,630
1 Year 1 Year
-4.85% +3.03%
2 Year 2 Year
+1.54% +3.19%
5 YEAR MARKET ACTIVITY TRENDS 5yr SEP AVG = 5,398 3 MONTHS
8,000 High J 6,274
7,000 Apr 2010 = 7,584 U
6,000 Low L
5,000 Dec 2008 = 3,500 A 6,084
4,000 U
New Listings
3,000 New Listings this G -3.03%
2,000 month at 5,223,
1,000 below the 5 yr SEP S 5,223
E
0
Jun 2008 Dec 2008Jun 2009 Dec 2009Jun 2010 Dec 2010Jun 2011 Dec 2011Jun 2012 average of 5,398 P -14.15%
NEW LISTINGS & BEDROOMS DISTRIBUTION BY PRICE
Distribution of New Listings by Price Range % 2 Beds 3 Beds 4 Beds 5 Beds+
$50,000
and less 479 9.17% 231 223 22 3
$50,001
$75,000 490 9.38% 158 298 32 2
$75,001
$100,000 639 12.23% 177 412 46 4
$100,001
Contact an experienced REALTOR
Ready to Buy or Sell Real Estate?
$150,000 1,262 24.16% 220 860 172 10
$150,001
$200,000 958 18.34% 118 564 264 12
$200,001
$325,000 886 16.96% 100 356 392 38
$325,001
and up 509 9.75% 39 121 277 72
Total New Listed Units: 5,223 1043 2834 1205 141
Total New Listed Volume: 956,998,241 127.00M 431.71M 329.03M 69.26M
Average New Listed Listing Price: $189,085 $121,764 $152,333 $273,051 $491,214
Reports produced and compiled by RE STATS Inc. Information is deemed reliable but not guaranteed. Does not reflect all market activity. pp. 3
Steve Reese 405-848-9944 steve@oklahomarealtors.com
5. Monthly Inventory Analysis
Data from the The Oklahoma Association of
REALTORS®
September 2012
Active Inventory as of Oct 12, 2012
Active Inventory Report Produced on: Oct 15, 2012
Area Delimited by Entire OK State MLS - Single-Family Property Type
END OF SEPTEMBER ACTIVE DURING SEPTEMBER
2008 2009 2010 2011 2012 2008 2009 2010 2011 2012
25,022 25,819 31,591
30,465
23,457 29,327
21,977 27,983
20,950 26,784
1 Year 1 Year
-14.88% -11.42%
2 Year 2 Year
-12.17% -8.15%
5 YEAR MARKET ACTIVITY TRENDS 5yr SEP AVG = 23,445 3 MONTHS
Active Inventory
30,000 High J 22,714
Aug 2011 = 26,141 U
Low L
20,000
Jan 2008 = 19,324 A 22,800
U
10,000
Inventory this G 0.38%
month at 21,977,
below the 5 yr SEP S 21,977
E
0
Jun 2008 Dec 2008Jun 2009 Dec 2009Jun 2010 Dec 2010Jun 2011 Dec 2011Jun 2012 average of 23,445 P -3.61%
INVENTORY & BEDROOMS DISTRIBUTION BY PRICE
Distribution of Inventory by Price Range % AVDOM 2 Beds 3 Beds 4 Beds 5 Beds+
$50,000
and less 1,786 8.13% 122.4 886 781 96 23
$50,001
$75,000 2,219 10.10% 120.5 802 1,243 156 18
$75,001
$100,000 2,683 12.21% 110.2 709 1,691 253 30
$100,001
Contact an experienced REALTOR
Ready to Buy or Sell Real Estate?
$175,000 7,014 31.92% 100.7 1,250 4,551 1,132 81
$175,001
$225,000 2,791 12.70% 101.6 459 1,336 908 88
$225,001
$350,000 3,155 14.36% 109.0 425 1,104 1,408 218
$350,001
and up 2,329 10.60% 122.4 216 497 1,126 490
Total Active Inventory by Units: 21,977 109.2 4,747 11,203 5,079 948
Total Active Inventory by Volume: 4,397,866,750 651.44M 1.74B 1.47B 535.17M
Average Active Inventory Listing Price: $200,112 $137,232 $155,591 $289,068 $564,521
Reports produced and compiled by RE STATS Inc. Information is deemed reliable but not guaranteed. Does not reflect all market activity. pp. 4
Steve Reese 405-848-9944 steve@oklahomarealtors.com
6. Monthly Inventory Analysis
Data from the The Oklahoma Association of
REALTORS®
September 2012
Active Inventory as of Oct 12, 2012
Months Supply of Inventory Report Produced on: Oct 15, 2012
Area Delimited by Entire OK State MLS - Single-Family Property Type
MSI FOR SEPTEMBER INDICATORS FOR SEPTEMBER 2012
2008 2009 2010 2011 2012 Inventory Closed Absorption MSI MSI %
9.2 38,231
8.4 6.9 14.497%
21,977
7.0 7.0 6.9
1 Year 3,186
End of Closed Average Months Percent
-25.32% Month Last Closed per Supply Months
2 Year Active 12 Month over of Supply of
-17.66% Inventory Months 12 Months Inventory Inventory
5 YEAR MARKET ACTIVITY TRENDS 5yr SEP AVG = 7.7 3 MONTHS
10 High J 7.2
9 Jun 2011 = 9.7 U
8
Low L
7
6 Jan 2008 = 5.3 A 7.1
5 U
Months Supply
4 Months Supply this G -1.17%
3
2 month at 6.9,
1 below the 5 yr SEP S 6.9
E
0
Jun 2008 Dec 2008 Jun 2009 Dec 2009 Jun 2010 Dec 2010 Jun 2011 Dec 2011 Jun 2012 average of 7.7 P -3.31%
MONTHS SUPPLY & BEDROOMS DISTRIBUTION BY PRICE
Distribution of Active Inventory by Price Range and MSI % MSI 2 Beds 3 Beds 4 Beds 5 Beds+
$50,000
and less 1,786 8.13% 4.1 5.0 3.5 3.2 6.0
$50,001
$80,000 2,795 12.72% 7.1 8.7 6.5 6.4 9.8
$80,001
$110,000 2,886 13.13% 6.7 7.8 6.4 6.7 8.9
$110,001
Contact an experienced REALTOR
Ready to Buy or Sell Real Estate?
$170,000 5,905 26.87% 6.2 7.1 6.0 6.1 6.8
$170,001
$230,000 3,365 15.31% 7.4 9.3 7.4 6.5 9.5
$230,001
$360,000 3,014 13.71% 8.3 11.3 9.2 7.1 9.3
$360,001
and up 2,226 10.13% 14.6 23.2 15.7 12.8 15.8
MSI: 6.9 7.6 6.3 7.2 11.2
Total Active Inventory: 21,977 4,747 11,203 5,079 948
Reports produced and compiled by RE STATS Inc. Information is deemed reliable but not guaranteed. Does not reflect all market activity. pp. 5
Steve Reese 405-848-9944 steve@oklahomarealtors.com
7. Monthly Inventory Analysis
Data from the The Oklahoma Association of
REALTORS®
September 2012
Closed Sales as of Oct 12, 2012
Average Days on Market to Sale Report Produced on: Oct 15, 2012
Area Delimited by Entire OK State MLS - Single-Family Property Type
SEPTEMBER YEAR TO DATE (YTD)
2008 2009 2010 2011 2012 2008 2009 2010 2011 2012
85 88
82 81 80 83 83 83
76 78
1 Year 1 Year
-4.91% -5.32%
2 Year 2 Year
-0.80% +5.89%
5 YEAR MARKET ACTIVITY TRENDS 5yr SEP AVG = 81 3 MONTHS
Average Days on Market
100 High J 78
90 Mar 2011 = 97 U
80
Low L
70
60 May 2010 = 73 A 78
50 U
40 Average DOM this G 0.82%
30
20 month at 80,
10 below the 5 yr SEP S 80
E
0
Jun 2008 Dec 2008 Jun 2009 Dec 2009 Jun 2010 Dec 2010 Jun 2011 Dec 2011 Jun 2012 average of 81 P 2.45%
AVERAGE DOM OF CLOSED SALES & BEDROOMS DISTRIBUTION BY PRICE
Distribution of Average Days on Market to Sale by Price Range % AVDOM 2 Beds 3 Beds 4 Beds 5 Beds+
$25,000
and less 121 3.98% 87.4 113.8 53.3 72.3 0.0
$25,001
$75,000 511 16.79% 82.9 91.8 79.4 69.4 93.3
$75,001
$100,000 352 11.56% 81.4 91.8 77.9 64.5 356.5
$100,001
Contact an experienced REALTOR
Ready to Buy or Sell Real Estate?
$150,000 806 26.48% 74.4 73.6 72.8 83.7 61.2
$150,001
$200,000 551 18.10% 76.4 92.0 72.5 77.7 56.8
$200,001
$275,000 371 12.19% 80.9 103.3 78.5 77.0 98.7
$275,001
and up 332 10.91% 93.8 105.8 77.7 87.8 135.8
Average Closed DOM: 80.4 91.9 74.8 80.0 122.3
Total Closed Units: 3,044 577 1666 729 72
Total Closed Volume: 484,343,506 64.38M 223.14M 167.13M 29.69M
Reports produced and compiled by RE STATS Inc. Information is deemed reliable but not guaranteed. Does not reflect all market activity. pp. 6
Steve Reese 405-848-9944 steve@oklahomarealtors.com
8. Monthly Inventory Analysis
Data from the The Oklahoma Association of
REALTORS®
September 2012
Closed Sales as of Oct 12, 2012
Average List Price at Closing Report Produced on: Oct 15, 2012
Area Delimited by Entire OK State MLS - Single-Family Property Type
SEPTEMBER YEAR TO DATE (YTD)
2008 2009 2010 2011 2012 2008 2009 2010 2011 2012
164,668 160,813
156,084 155,544 153,493 155,898
148,572 152,056
146,047 149,328
1 Year 1 Year
+5.87% +3.15%
2 Year 2 Year
+5.50% +5.76%
5 YEAR MARKET ACTIVITY TRENDS 5yr SEP AVG = 154K 3 MONTHS
Average List Price
200,000 High J 165,058
Aug 2012 = 169,128 U
Low L
Nov 2008 = 135,800 A 169,128
100,000 U
Average LPrice this G 2.47%
month at 164,668,
above the 5 yr SEP S 164,668
E
0
Jun 2008Dec 2008Jun 2009Dec 2009Jun 2010Dec 2010Jun 2011Dec 2011Jun 2012 average of 154,183 P -2.64%
AVERAGE LIST PRICE OF CLOSED SALES & BEDROOMS DISTRIBUTION BY PRICE
Distribution of Average List Price at Closing by Price Range % AVL$ 2 Beds 3 Beds 4 Beds 5 Beds+
$25,000
and less 101 3.32% 17,811 21,134 20,971 20,485 0
$25,001
$75,000 501 16.46% 53,314 54,397 57,341 60,366 49,933
$75,001
$100,000 352 11.56% 89,662 92,176 90,825 90,193 95,950
$100,001
Contact an experienced REALTOR
Ready to Buy or Sell Real Estate?
$150,000 803 26.38% 128,194 130,817 129,117 134,872 131,360
$150,001
$200,000 559 18.36% 175,378 181,186 176,040 180,029 180,530
$200,001
$275,000 377 12.39% 238,144 246,871 240,300 242,682 243,699
$275,001
and up 351 11.53% 428,552 365,278 395,691 427,109 600,544
Average List Price: $164,668 $116,992 $138,033 $236,823 $432,449
Total Closed Units: 3,044 577 1666 729 72
Total List Volume: 501,248,026 67.50M 229.96M 172.64M 31.14M
Reports produced and compiled by RE STATS Inc. Information is deemed reliable but not guaranteed. Does not reflect all market activity. pp. 7
Steve Reese 405-848-9944 steve@oklahomarealtors.com
9. Monthly Inventory Analysis
Data from the The Oklahoma Association of
REALTORS®
September 2012
Closed Sales as of Oct 12, 2012
Average Sold Price at Closing Report Produced on: Oct 15, 2012
Area Delimited by Entire OK State MLS - Single-Family Property Type
SEPTEMBER YEAR TO DATE (YTD)
2008 2009 2010 2011 2012 2008 2009 2010 2011 2012
159,114 155,170
150,185 149,533 148,832 149,811
143,982 146,611
141,529 144,071
1 Year 1 Year
+6.41% +3.58%
2 Year 2 Year
+5.95% +5.84%
5 YEAR MARKET ACTIVITY TRENDS 5yr SEP AVG = 149K 3 MONTHS
Average Sold Price
200,000 High J 159,206
Aug 2012 = 163,334 U
Low L
Nov 2008 = 131,059 A 163,334
100,000 U
Average SPrice this G 2.59%
month at 159,114,
above the 5 yr SEP S 159,114
E
0
Jun 2008Dec 2008Jun 2009Dec 2009Jun 2010Dec 2010Jun 2011Dec 2011Jun 2012 average of 148,869 P -2.58%
AVERAGE SOLD PRICE OF CLOSED SALES & BEDROOMS DISTRIBUTION BY PRICE
Distribution of Average Sold Price at Closing by Price Range % AVS$ 2 Beds 3 Beds 4 Beds 5 Beds+
$25,000
and less 121 3.98% 17,548 16,925 18,270 18,273 0
$25,001
$75,000 511 16.79% 52,338 50,284 53,407 54,037 45,967
$75,001
$100,000 352 11.56% 88,021 87,712 88,128 87,630 91,950
$100,001
Contact an experienced REALTOR
Ready to Buy or Sell Real Estate?
$150,000 806 26.48% 126,689 126,075 126,032 130,266 131,800
$150,001
$200,000 551 18.10% 173,178 173,963 171,594 175,658 174,980
$200,001
$275,000 371 12.19% 236,102 240,206 234,145 236,883 237,439
$275,001
and up 332 10.91% 419,776 351,483 382,981 411,671 569,941
Average Closed Price: $159,114 $111,585 $133,939 $229,258 $412,324
Total Closed Units: 3,044 577 1666 729 72
Total Closed Volume: 484,343,506 64.38M 223.14M 167.13M 29.69M
Reports produced and compiled by RE STATS Inc. Information is deemed reliable but not guaranteed. Does not reflect all market activity. pp. 8
Steve Reese 405-848-9944 steve@oklahomarealtors.com
10. Monthly Inventory Analysis
Data from the The Oklahoma Association of
REALTORS®
September 2012
Closed Sales as of Oct 12, 2012
Average Percent of List Price to Selling Price Report Produced on: Oct 15, 2012
Area Delimited by Entire OK State MLS - Single-Family Property Type
SEPTEMBER YEAR TO DATE (YTD)
2008 2009 2010 2011 2012 2008 2009 2010 2011 2012
97.05% 96.87% 96.86%
96.68% 96.35% 96.41%
96.31%
96.02% 96.04% 95.92%
1 Year 1 Year
+0.67% +0.51%
2 Year 2 Year
+0.69% +0.10%
5 YEAR MARKET ACTIVITY TRENDS 5yr SEP AVG=96.53% 3 MONTHS
Average List/Sell Price
98 High J 96.78%
May 2008 = 97.13% U
Low L
97
Jan 2011 = 95.15% A 96.68%
U
96
Average List/Sell this G -0.10%
month at 96.68%,
above the 5 yr SEP S 96.68%
E
95
Jun 2008 Dec 2008 Jun 2009 Dec 2009 Jun 2010 Dec 2010 Jun 2011 Dec 2011 Jun 2012 average of 96.53% P -0.01%
AVERAGE L/S% OF CLOSED SALES & BEDROOMS DISTRIBUTION BY PRICE
Distribution of $avgmed L/S % by Price Range % AVL/S% 2 Beds 3 Beds 4 Beds 5 Beds+
$25,000
and less 121 3.98% 90.30% 90.39% 88.34% 98.75% 0.00%
$25,001
$75,000 511 16.79% 94.21% 92.88% 95.24% 93.08% 91.99%
$75,001
$100,000 352 11.56% 98.06% 95.60% 98.83% 97.94% 96.19%
$100,001
Contact an experienced REALTOR
Ready to Buy or Sell Real Estate?
$150,000 806 26.48% 97.46% 96.76% 97.71% 96.86%100.81%
$150,001
$200,000 551 18.10% 97.50% 96.34% 97.62% 97.74% 97.31%
$200,001
$275,000 371 12.19% 97.58% 97.39% 97.54% 97.67% 97.59%
$275,001
and up 332 10.91% 97.06% 96.22% 98.70% 96.64% 96.91%
Average List/Sell Ratio: 96.70% 94.66% 97.21% 97.03% 97.11%
Total Closed Units: 3,044 577 1666 729 72
Total Closed Volume: 484,343,506 64.38M 223.14M 167.13M 29.69M
Reports produced and compiled by RE STATS Inc. Information is deemed reliable but not guaranteed. Does not reflect all market activity. pp. 9
Steve Reese 405-848-9944 steve@oklahomarealtors.com
11. Monthly Inventory Analysis
Data from the The Oklahoma Association of
REALTORS®
September 2012
Inventory as of Oct 12, 2012
Market Summary Report Produced on: Oct 15, 2012
Area Delimited by Entire OK State MLS - Single-Family Property Type
Inventory Inventory Market Activity Market Activity
New Listings Closed Sales
5,223 = 18.64% 3,044 = 9.81%
Start Inventory Pending Sales
22,802 2,982 = 9.61%
Total Inventory
Other Off Market
Units 3,026 = 9.75%
28,025
Volume Active Inventory
$5,501,367,296 21,977 = 70.83%
Absorption: Last 12 months, an Average of 3,186 Sales/Month SEPTEMBER Year To Date
Active Inventory as of September 30, 2012 = 21,977 2011 2012 +/-% 2011 2012 +/-%
Closed Sales 3,162 3,044 -3.73% 26,419 30,061 13.79%
Pending Sales 2,655 2,982 12.32% 26,942 31,385 16.49%
New Listings 5,489 5,223 -4.85% 53,429 55,046 3.03%
Average List Price 155,544 164,668 5.87% 155,898 160,813 3.15%
Average Sale Price 149,533 159,114 6.41% 149,811 155,170 3.58%
Average Percent of List Price to Selling Price 96.04% 96.68% 0.67% 95.92% 96.41% 0.51%
Average Days on Market to Sale 84.56 80.41 -4.91% 87.63 82.96 -5.32%
Monthly Inventory 25,824 21,977 -14.90% 25,824 21,977 -14.90%
Months Supply of Inventory 9.24 6.90 -25.33% 9.24 6.90 -25.33%
2011 2011
SEPTEMBER MARKET 2012 AVERAGE PRICES 2012
New Listings Pending Listings List Price Sale Price
5,489 5,223 164,668
159,114
155,544
2,655 2,982 149,533
-4.85% +12.32% +5.87% +6.41%
2011 2011
INVENTORY 2012 AVERAGE L/S% & DOM 2012
Active Inventory Monthly Supply of Inventory % of List to Sale Price Days on Market to Sale
25,824 9.24 96.68% 84.56
21,977 6.90 96.04% 80.41
-14.90% -25.33% +0.67% -4.91%
Reports produced and compiled by RE STATS Inc. Information is deemed reliable but not guaranteed. Does not reflect all market activity. pp. 10
Steve Reese 405-848-9944 steve@oklahomarealtors.com