SlideShare uma empresa Scribd logo
1 de 11
Baixar para ler offline
June 2012
                                   Area Delimited by Entire OK State MLS -
                                        Single-Family Property Type


Absorption: Last 12 months, an Average of 3,101 Sales/Month                                    JUNE                              Market Activity
Active Inventory as of June 30, 2012 = 22,400                                       2011          2012        +/-%
Closed Listings                                                                     3,452        3,725        7.91%
Pending Listings                                                                    3,392        3,814       12.44%
New Listings                                                                        6,618        5,980       -9.64%
Average List Price                                                                161,298      166,728        3.37%
Average Sale Price                                                                155,373      161,207        3.75%          Closed (11.55%)
Average Percent of List Price to Selling Price                                    96.15%       97.13%         1.02%          Pending (11.82%)
Average Days on Market to Sale                                                      83.05        76.85       -7.47%          Other OffMarket (7.21%)
End of Month Inventory                                                             26,280       22,400      -14.76%          Active (69.43%)
Months Supply of Inventory                                                           9.90         7.22      -27.04%

                                                                                                                         Report Produced on: Jul 13, 2012

Monthly Inventory Analysis
 Data from the The Oklahoma Association of REALTORS®


                          Analysis Wrap-Up                                                                What's in this Issue

 Months Supply of Inventory (MSI) Decreases                                        Closed Listings                                                      1
 The total housing inventory at the end of June 2012 decreased                     Pending Listings                                                     2
 14.76% to 22,400 existing homes available for sale. Over the                      New Listings                                                         3
 last 12 months this area has had an average of 3,101 closed                       Inventory                                                            4
 sales per month. This represents an unsold inventory index of
                                                                                   Months Supply of Inventory                                           5
 7.22 MSI for this period.
                                                                                   Average Days on Market to Sale                                       6
 Average Sale Prices Going Up
                                                                                   Average List Price at Closing                                        7
 According to the preliminary trends, this market area has                         Average Sale Price at Closing                                        8
 experienced some upward momentum with the increase of
 Average Price this month. Prices went up 3.75% in June 2012                       Average Percent of List Price to Selling Price                       9
 to $161,207 versus the previous year at $155,373.                                 Market Summary                                                      10
 Average Days on Market Shortens                                                                          Real Estate is Local
 The average number of 76.85 days that homes spent on the
 market before selling decreased by 6.20 days or 7.47% in June                     Consumers Should Consult with a REALTOR®
 2012 compared to last year’s same month at 83.05 DOM.                             Buying or selling real estate, for a majority of consumers, is
 Sales Success for June 2012 is Positive                                           one of the most important decisions they will make. Choosing a
                                                                                   real estate professional continues to be a vital part of this
 Overall, with Average Prices going up and Days on Market                          process.
 decreasing, the Listed versus Closed Ratio finished strong this
 month.                                                                            Identify a Professional to Manage the Procedure
 There were 5,980 New Listings in June 2012, down 9.64%                            REALTORS® are well-informed about critical factors that affect
 from last year at 6,618. Furthermore, there were 3,725 Closed                     your specific market area - such as changes in market
 Listings this month versus last year at 3,452, a 7.91%                            conditions, consumer attitudes and interest rates.
 increase.
                                                                                   Are You Ready to Buy or Sell Real Estate?
 Closed versus Listed trends yielded a 62.3% ratio, up from last                   For more information, contact:
 year’s June 2012 at 52.2%, a 19.42% upswing. This will
 certainly create pressure on a decreasing Month’s Supply of                         Steve Reese - Vice President, Marketing
 Inventory (MSI) in the following months to come.                                    405-848-9944
                                                                                     steve@oklahomarealtors.com
                                                                                     Or visit: www.OklahomaRealtors.com

Reports produced and compiled by RE STATS Inc. Information is deemed reliable but not guaranteed. Does not reflect all market activity.
Monthly Inventory Analysis
                                                         Data from the The Oklahoma Association of
                                                         REALTORS®

                                                                             June 2012
                                                         Closed Sales as of Jul 11, 2012

Closed Listings                                                                                                                        Report Produced on: Jul 13, 2012
Area Delimited by Entire OK State MLS - Single-Family Property Type

                                                          JUNE                                                                YEAR TO DATE (YTD)
              2008                          2009           2010          2011          2012                2008          2009            2010        2011            2012

            3,857                           3,829                                                         19,639                                                     19,132
                                                          3,701                        3,725                                            18,378
                                                                                                                        17,276
                                                                         3,452                                                                       16,596
                                                                                      1 Year                                                                      1 Year
                                                                                      +7.91%                                                                     +15.28%
                                                                                      2 Year                                                                      2 Year
                                                                                      +0.65%                                                                     +4.10%


                                                           5 YEAR MARKET ACTIVITY TRENDS                                              5yr JUN AVG = 3,713     3 MONTHS

                                          5,000                                                                                        High                 A 3,361
                                                                                                                                       Jul 2008 = 4,047     P
                                          4,000
                                                                                                                                       Low                  R
                                          3,000                                                                                        Jan 2010 = 1,695     M 3,845
                                                                                                                                                            A
   Closed Listings


                                          2,000                                                                                        Closed Listings
                                                                                                                                                     this   Y 14.40%
                                          1,000                                                                                        month at 3,725,
                                                                                                                                       above the 5 yr JUN J 3,725
                                                                                                                                                          U
                                             0
                                                   Jun 2008 Dec 2008 Jun 2009 Dec 2009 Jun 2010 Dec 2010 Jun 2011 Dec 2011             average of 3,713   N -3.12%


                                                                   CLOSED LISTINGS & BEDROOMS DISTRIBUTION BY PRICE
                                             Distribution of Closed Listings by Price Range                     %      AVDOM            2 Beds   3 Beds     4 Beds    5 Beds+

                                        $25,000
                                        and less           147                                                3.95%          67.2          74       59         13             1

                                        $25,001
                                        $75,000            635                                              17.05%           81.7        202       371         56             6

                                        $75,001
                                        $100,000           440                                              11.81%           76.3        124       269         47             0

                                        $100,001
    Contact an experienced REALTOR
    Ready to Buy or Sell Real Estate?


                                        $150,000           972                                              26.09%           70.0        162       679        127             4

                                        $150,001
                                        $200,000           647                                              17.37%           81.4          87      365        181           14

                                        $200,001
                                        $275,000           438                                              11.76%           72.4          50      179        196           13

                                        $275,001
                                         and up            446                                              11.97%           86.6          36      105        241           64

                                        Total Closed Units:             3,725                                                76.9          735     2027      861      102
                                        Total Closed Volume:      600,497,742                                                           81.68M 275.75M 198.13M     44.94M
                                        Average Closed Price:       $161,207                                                          $111,124 $136,041 $230,111 $440,594

Reports produced and compiled by RE STATS Inc. Information is deemed reliable but not guaranteed. Does not reflect all market activity.                                  pp. 1

Steve Reese                                                                                         405-848-9944                    steve@oklahomarealtors.com
Monthly Inventory Analysis
                                                          Data from the The Oklahoma Association of
                                                          REALTORS®

                                                                              June 2012
                                                          Pending Listings as of Jul 11, 2012

Pending Listings                                                                                                                        Report Produced on: Jul 13, 2012
Area Delimited by Entire OK State MLS - Single-Family Property Type

                                                           JUNE                                                                YEAR TO DATE (YTD)
              2008                           2009           2010          2011          2012                2008          2009            2010        2011            2012

            3,815                           3,704                                       3,814              21,395                                                     21,933
                                                                          3,392
                                                                                                                         19,508          19,151
                                                           2,652                                                                                      18,201
                                                                                       1 Year                                                                      1 Year
                                                                                      +12.44%                                                                     +20.50%
                                                                                       2 Year                                                                      2 Year
                                                                                      +43.82%                                                                     +14.53%


                                                            5 YEAR MARKET ACTIVITY TRENDS                                              5yr JUN AVG = 3,475     3 MONTHS

                                          5,000                                                                                         High                 A 3,996
                                                                                                                                        Apr 2010 = 4,815     P
                                          4,000
                                                                                                                                        Low                  R
                                          3,000                                                                                         Dec 2009 = 2,009     M 3,955
                                                                                                                                                             A
   Pending Listings


                                          2,000                                                                                         Pending Listingsthis Y -1.03%
                                          1,000                                                                                         month at 3,814,
                                                                                                                                        above the 5 yr JUN J 3,814
                                                                                                                                                             U
                                              0
                                                    Jun 2008 Dec 2008 Jun 2009 Dec 2009 Jun 2010 Dec 2010 Jun 2011 Dec 2011             average of 3,475     N -3.57%


                                                                   PENDING LISTINGS & BEDROOMS DISTRIBUTION BY PRICE
                                             Distribution of Pending Listings by Price Range                     %      AVDOM            2 Beds   3 Beds     4 Beds    5 Beds+

                                        $25,000
                                        and less            135                                                3.54%          62.1          62       65           8            0

                                        $25,001
                                        $75,000             661                                              17.33%           81.0        215       398         44             4

                                        $75,001
                                        $100,000            430                                              11.27%           84.9        107       285         31             7

                                        $100,001
    Contact an experienced REALTOR
    Ready to Buy or Sell Real Estate?


                                        $150,000            990                                              25.96%           65.7        162       723         97             8

                                        $150,001
                                        $200,000            706                                              18.51%           72.5        100       391        204           11

                                        $200,001
                                        $275,000            461                                              12.09%           73.5          60      172        212           17

                                        $275,001
                                         and up             431                                              11.30%           89.5          34      105        233           59

                                        Total Pending Units:             3,814                                                83.2          740     2139      829      106
                                        Total Pending Volume:      627,556,031                                                           86.44M 292.14M 196.11M     52.87M
                                        Average Listing Price:       $158,470                                                          $116,810 $136,576 $236,568 $498,737

Reports produced and compiled by RE STATS Inc. Information is deemed reliable but not guaranteed. Does not reflect all market activity.                                   pp. 2

Steve Reese                                                                                          405-848-9944                    steve@oklahomarealtors.com
Monthly Inventory Analysis
                                                         Data from the The Oklahoma Association of
                                                         REALTORS®

                                                                             June 2012
                                                         New Listings as of Jul 11, 2012

New Listings                                                                                                                       Report Produced on: Jul 13, 2012
Area Delimited by Entire OK State MLS - Single-Family Property Type

                                                          JUNE                                                               YEAR TO DATE (YTD)
             2008                           2009           2010            2011         2012               2008          2009        2010        2011            2012

                                                                         6,618                            37,755                                                 37,415
                                                                                                                                    36,291       36,223
           6,221                           6,129          6,003                        5,980                            33,623
                                                                                       1 Year                                                                    1 Year
                                                                                       -9.64%                                                                    +3.29%
                                                                                       2 Year                                                                    2 Year
                                                                                       -0.38%                                                                    +3.10%


                                                           5 YEAR MARKET ACTIVITY TRENDS                                          5yr JUN AVG = 6,190     3 MONTHS

                                         8,000                                                                                     High                 A 6,716
                                         7,000                                                                                     Apr 2010 = 7,619     P
                                         6,000                                                                                     Low                  R
                                         5,000                                                                                     Dec 2008 = 3,505     M 6,615
                                         4,000                                                                                                          A
   New Listings


                                         3,000                                                                                     New Listings this    Y -1.50%
                                         2,000                                                                                     month at 5,980,
                                         1,000                                                                                     below the 5 yr JUN   J 5,980
                                             0
                                                                                                                                                        U
                                                   Jun 2008 Dec 2008 Jun 2009 Dec 2009 Jun 2010 Dec 2010 Jun 2011 Dec 2011         average of 6,190     N -9.60%


                                                                     NEW LISTINGS & BEDROOMS DISTRIBUTION BY PRICE
                                            Distribution of New Listings by Price Range                         %                   2 Beds   3 Beds     4 Beds    5 Beds+

                                       $50,000
                                       and less            491                                                8.21%                  216       238         31             6

                                       $50,001
                                       $75,000             488                                                8.16%                  159       284         39             6

                                       $75,001
                                       $100,000            688                                              11.51%                   157       461         65             5

                                       $100,001
   Contact an experienced REALTOR
   Ready to Buy or Sell Real Estate?


                                       $150,000          1,523                                              25.47%                   267     1,066        177           13

                                       $150,001
                                       $225,000          1,425                                              23.83%                   221       738        436           30

                                       $225,001
                                       $325,000            769                                              12.86%                   100       243        368           58

                                       $325,001
                                        and up             596                                                9.97%                    55      132        284        125

                                       Total New Listed Units:                            5,980                                       1175     3162     1400      243
                                       Total New Listed Volume:                   1,145,436,871                                    202.16M 467.00M 367.09M 109.18M
                                       Average New Listed Listing Price:              $156,692                                    $172,049 $147,693 $262,208 $449,310

Reports produced and compiled by RE STATS Inc. Information is deemed reliable but not guaranteed. Does not reflect all market activity.                              pp. 3

Steve Reese                                                                                         405-848-9944                steve@oklahomarealtors.com
Monthly Inventory Analysis
                                                          Data from the The Oklahoma Association of
                                                          REALTORS®

                                                                              June 2012
                                                          Active Inventory as of Jul 11, 2012

Active Inventory                                                                                                                         Report Produced on: Jul 13, 2012
Area Delimited by Entire OK State MLS - Single-Family Property Type

                                                     END OF JUNE                                                               ACTIVE DURING JUNE
              2008                           2009          2010           2011          2012               2008           2009             2010        2011              2012

                                                                         26,272                                                                        32,139
       23,733                                             23,833                                          29,511                                                        28,540
                                                                                       22,400                                             28,472
                                            21,591                                                                       27,268
                                                                                       1 Year                                                                            1 Year
                                                                                      -14.74%                                                                           -11.20%
                                                                                       2 Year                                                                            2 Year
                                                                                       -6.01%                                                                           +0.24%


                                                            5 YEAR MARKET ACTIVITY TRENDS                                               5yr JUN AVG = 23,566     3 MONTHS
   Active Inventory


                                           30,000                                                                                        High                  A 22,388
                                                                                                                                         Jul 2011 = 26,623     P
                                                                                                                                         Low                   R
                                           20,000
                                                                                                                                         Jan 2008 = 19,336     M 22,570
                                                                                                                                                               A
                                           10,000
                                                                                                                                         Inventory this        Y 0.81%
                                                                                                                                         month at 22,400,
                                                                                                                                         below the 5 yr JUN    J 22,400
                                               0
                                                                                                                                                               U
                                                    Jun 2008 Dec 2008 Jun 2009 Dec 2009 Jun 2010 Dec 2010 Jun 2011 Dec 2011              average of 23,566     N -0.75%


                                                                        INVENTORY & BEDROOMS DISTRIBUTION BY PRICE
                                             Distribution of Inventory by Price Range                           %       AVDOM             2 Beds   3 Beds      4 Beds     5 Beds+

                                        $50,000
                                        and less         1,825                                                 8.15%      121.1            912       791         105            17

                                         $50,001
                                         $75,000         2,298                                               10.26%       120.0            847     1,273         148            30

                                        $75,001
                                        $100,000         2,645                                               11.81%       110.0            674     1,685         260            26

                                        $100,001
    Contact an experienced REALTOR
    Ready to Buy or Sell Real Estate?


                                        $175,000         7,125                                               31.81%           95.4        1,242    4,647       1,152            84

                                        $175,001
                                        $225,000         2,718                                               12.13%           94.8         421     1,261         954            82

                                        $225,001
                                        $350,000         3,442                                               15.37%       102.1            458     1,213       1,526        245

                                        $350,001
                                         and up          2,347                                               10.48%       117.3            226       476       1,106        539

                                        Total Active Inventory by Units:                        22,400                        105.0        4,780   11,346    5,251    1,023
                                        Total Active Inventory by Volume:                4,510,240,733                                   693.79M    1.77B    1.49B 552.61M
                                        Average Active Inventory Listing Price:              $201,350                                   $145,145 $156,053 $284,375 $540,189

Reports produced and compiled by RE STATS Inc. Information is deemed reliable but not guaranteed. Does not reflect all market activity.                                      pp. 4

Steve Reese                                                                                          405-848-9944                     steve@oklahomarealtors.com
Monthly Inventory Analysis
                                                         Data from the The Oklahoma Association of
                                                         REALTORS®

                                                                           June 2012
                                                         Active Inventory as of Jul 11, 2012

Months Supply of Inventory                                                                                                         Report Produced on: Jul 13, 2012
Area Delimited by Entire OK State MLS - Single-Family Property Type

                                                    MSI FOR JUNE                                                    INDICATORS FOR JUNE 2012
             2008                            2009         2010         2011             2012           Inventory    Closed        Absorption        MSI            MSI %

                                                                        9.9                                          37,209
                                                                                                                                                    7.2        13.843%
                                                           7.4                                          22,400
                    6.9                      7.1                                        7.2
                                                                                     1 Year                                          3,101
                                                                                                         End of      Closed         Average       Months        Percent
                                                                                    -27.02%              Month        Last         Closed per     Supply        Months
                                                                                     2 Year              Active        12          Month over        of        Supply of
                                                                                     -2.50%            Inventory     Months        12 Months     Inventory     Inventory


                                                          5 YEAR MARKET ACTIVITY TRENDS                                            5yr JUN AVG = 7.7        3 MONTHS

                                        10                                                                                         High                   A 7.4
                                         9                                                                                         Jun 2011 = 9.9         P
                                         8
                                                                                                                                   Low                    R
                                         7
                                         6                                                                                         Jan 2008 = 5.3         M 7.3
                                         5                                                                                                                A
   Months Supply


                                         4                                                                                         Months Supply this     Y -0.72%
                                         3
                                         2                                                                                         month at 7.2,
                                         1                                                                                         below the 5 yr JUN     J 7.2
                                         0
                                                                                                                                                          U
                                               Jun 2008 Dec 2008 Jun 2009 Dec 2009 Jun 2010 Dec 2010 Jun 2011 Dec 2011             average of 7.7         N -1.48%


                                                                  MONTHS SUPPLY & BEDROOMS DISTRIBUTION BY PRICE
                                             Distribution of Active Inventory by Price Range and MSI        %            MSI        2 Beds   3 Beds       4 Beds    5 Beds+

                                       $50,000
                                       and less         1,825                                              8.15%          4.1         5.1        3.5         3.3       5.0

                                       $50,001
                                       $80,000          2,858                                             12.76%          7.3         9.2        6.6         6.4      12.4

                                       $80,001
                                       $110,000         2,829                                             12.63%          6.7         7.5        6.4         6.8       9.7

                                       $110,001
   Contact an experienced REALTOR
   Ready to Buy or Sell Real Estate?


                                       $170,000         6,060                                             27.05%          6.5         7.3        6.4         6.4       6.8

                                       $170,001
                                       $240,000         3,665                                             16.36%          7.5         9.1        7.5         7.0       8.7

                                       $240,001
                                       $360,000         2,908                                             12.98%          9.9        13.1       10.8         8.5      10.8

                                       $360,001
                                        and up          2,255                                             10.07%         15.9        23.9       16.3       13.8       18.8


                                       MSI:                                       7.2                                                  7.7   6.6             7.8      12.5
                                       Total Active Inventory:                22,400                                                4,780 11,346          5,251      1,023

Reports produced and compiled by RE STATS Inc. Information is deemed reliable but not guaranteed. Does not reflect all market activity.                                pp. 5

Steve Reese                                                                                       405-848-9944                  steve@oklahomarealtors.com
Monthly Inventory Analysis
                                                         Data from the The Oklahoma Association of
                                                         REALTORS®

                                                                            June 2012
                                                         Closed Sales as of Jul 11, 2012

Average Days on Market to Sale                                                                                                      Report Produced on: Jul 13, 2012
Area Delimited by Entire OK State MLS - Single-Family Property Type

                                                          JUNE                                                              YEAR TO DATE (YTD)
              2008                            2009        2010          2011          2012               2008             2009        2010          2011              2012

                       82                                                 83                                                                           90
                                               81                                                         85               87                                          85
                                                            77                          77                                              78
                                                                                     1 Year                                                                          1 Year
                                                                                     -7.47%                                                                          -5.68%
                                                                                     2 Year                                                                          2 Year
                                                                                     -0.37%                                                                          +9.61%


                                                           5 YEAR MARKET ACTIVITY TRENDS                                             5yr JUN AVG = 80         3 MONTHS
   Average Days on Market


                                        100                                                                                         High                     A 83
                                         90                                                                                         Mar 2011 = 97            P
                                         80
                                                                                                                                    Low                      R
                                         70
                                         60                                                                                         May 2010 = 73            M 79
                                         50                                                                                                                  A
                                         40                                                                                         Average DOM this         Y -4.61%
                                         30
                                         20                                                                                         month at 77,
                                         10                                                                                         below the 5 yr JUN       J 77
                                          0
                                                                                                                                                             U
                                                Jun 2008 Dec 2008 Jun 2009 Dec 2009 Jun 2010 Dec 2010 Jun 2011 Dec 2011             average of 80            N -3.20%


                                                       AVERAGE DOM OF CLOSED SALES & BEDROOMS DISTRIBUTION BY PRICE
                                              Distribution of Average Days on Market to Sale by Price Range %        AVDOM           2 Beds   3 Beds        4 Beds     5 Beds+

                                        $25,000
                                        and less           147                                              3.95%          67.2       71.5     57.8          80.7      119.0

                                        $25,001
                                        $75,000            635                                            17.05%           81.7       80.7     83.1          80.7        34.7

                                        $75,001
                                        $100,000           440                                            11.81%           76.3       80.7     69.8         101.5           0.0

                                        $100,001
    Contact an experienced REALTOR
    Ready to Buy or Sell Real Estate?


                                        $150,000           972                                            26.09%           70.0       85.7     64.2          81.0        57.8

                                        $150,001
                                        $200,000           647                                            17.37%           81.4      108.1     76.6          80.1        56.1

                                        $200,001
                                        $275,000           438                                            11.76%           72.4       79.4     66.7          73.6      105.0

                                        $275,001
                                         and up            446                                            11.97%           86.6      110.9     74.0          86.4        94.2

                                        Average Closed DOM:              76.9                                                         85.5       71.2         81.7       85.7
                                        Total Closed Units:             3,725                                                           735      2027           861        102
                                        Total Closed Volume:      600,497,742                                                        81.68M   275.75M       198.13M     44.94M

Reports produced and compiled by RE STATS Inc. Information is deemed reliable but not guaranteed. Does not reflect all market activity.                                     pp. 6

Steve Reese                                                                                        405-848-9944                  steve@oklahomarealtors.com
Monthly Inventory Analysis
                                                          Data from the The Oklahoma Association of
                                                          REALTORS®

                                                                               June 2012
                                                          Closed Sales as of Jul 11, 2012

Average List Price at Closing                                                                                                         Report Produced on: Jul 13, 2012
Area Delimited by Entire OK State MLS - Single-Family Property Type

                                                           JUNE                                                                 YEAR TO DATE (YTD)
              2008                           2009             2010        2011           2012                2008           2009        2010         2011           2012

                                                                                       166,728                                                                  157,648
   164,670                                                                                                                                          153,685
                                                                         161,298                           151,771
                                           158,386        159,882                                                         147,645      149,258
                                                                                        1 Year                                                                      1 Year
                                                                                        +3.37%                                                                      +2.58%
                                                                                        2 Year                                                                      2 Year
                                                                                        +4.28%                                                                      +5.62%


                                                              5 YEAR MARKET ACTIVITY TRENDS                                           5yr JUN AVG = 162K      3 MONTHS
   Average List Price


                                           200,000                                                                                    High                  A 158,421
                                                                                                                                      Jun 2012 = 166,728    P
                                                                                                                                      Low                   R
                                                                                                                                      Nov 2008 = 135,798  M 164,784
                                           100,000                                                                                                        A
                                                                                                                                      Average LPrice this Y 4.02%
                                                                                                                                      month at 166,728,
                                                                                                                                      above the 5 yr JUN J 166,728
                                                                                                                                                          U
                                                0
                                                      Jun 2008 Dec 2008 Jun 2009 Dec 2009 Jun 2010 Dec 2010 Jun 2011 Dec 2011         average of 162,193 N 1.18%


                                                     AVERAGE LIST PRICE OF CLOSED SALES & BEDROOMS DISTRIBUTION BY PRICE
                                             Distribution of Average List Price at Closing by Price Range         %        AVL$        2 Beds    3 Beds    4 Beds    5 Beds+

                                        $25,000
                                        and less              129                                                3.46%      16,848     18,895    19,780    18,538     24,900

                                         $25,001
                                         $75,000              611                                               16.40%      52,139     52,934    56,085    52,854     41,236

                                        $75,001
                                        $100,000              444                                               11.92%      88,761     92,007    91,178    91,391            0

                                        $100,001
    Contact an experienced REALTOR
    Ready to Buy or Sell Real Estate?


                                        $150,000              966                                               25.93% 127,235       128,017 128,898 133,789 140,500

                                        $150,001
                                        $200,000              668                                               17.93% 175,374       177,808 175,993 180,207 181,579

                                        $200,001
                                        $275,000              428                                               11.49% 236,003       241,531 237,978 243,383 246,345

                                        $275,001
                                         and up               479                                               12.86% 431,215       375,313 408,533 412,154 645,208


                                        Average List Price:            $166,728                                                      $116,049 $139,988 $237,093 $469,335
                                        Total Closed Units:                3,725                                                          735     2027      861      102
                                        Total List Volume:           621,060,087                                                       85.30M 283.76M 204.14M     47.87M

Reports produced and compiled by RE STATS Inc. Information is deemed reliable but not guaranteed. Does not reflect all market activity.                                 pp. 7

Steve Reese                                                                                            405-848-9944                steve@oklahomarealtors.com
Monthly Inventory Analysis
                                                          Data from the The Oklahoma Association of
                                                          REALTORS®

                                                                               June 2012
                                                          Closed Sales as of Jul 11, 2012

Average Sold Price at Closing                                                                                                         Report Produced on: Jul 13, 2012
Area Delimited by Entire OK State MLS - Single-Family Property Type

                                                           JUNE                                                                 YEAR TO DATE (YTD)
              2008                          2009            2010          2011           2012                2008           2009        2010         2011           2012

   159,484                                                                             161,207                                                                  152,069
                                                                                                           147,091                                  147,521
                                                          154,416       155,373                                                        144,051
                                           153,063                                                                        142,390
                                                                                        1 Year                                                                      1 Year
                                                                                        +3.75%                                                                      +3.08%
                                                                                        2 Year                                                                      2 Year
                                                                                        +4.40%                                                                      +5.57%


                                                            5 YEAR MARKET ACTIVITY TRENDS                                             5yr JUN AVG = 157K      3 MONTHS
   Average Sold Price


                                           200,000                                                                                    High                  A 153,191
                                                                                                                                      Jun 2012 = 161,207    P
                                                                                                                                      Low                   R
                                                                                                                                      Nov 2008 = 131,055  M 159,490
                                           100,000                                                                                                        A
                                                                                                                                      Average SPrice this Y 4.11%
                                                                                                                                      month at 161,207,
                                                                                                                                      above the 5 yr JUN J 161,207
                                                                                                                                                          U
                                                0
                                                      Jun 2008 Dec 2008 Jun 2009 Dec 2009 Jun 2010 Dec 2010 Jun 2011 Dec 2011         average of 156,709 N 1.08%


                                                     AVERAGE SOLD PRICE OF CLOSED SALES & BEDROOMS DISTRIBUTION BY PRICE
                                             Distribution of Average Sold Price at Closing by Price Range         %        AVS$        2 Beds    3 Beds    4 Beds    5 Beds+

                                        $25,000
                                        and less            147                                                  3.95%      16,911     16,268    18,055    15,716     12,500

                                        $25,001
                                        $75,000             635                                                 17.05%      51,536     48,981    53,445    49,426     39,186

                                        $75,001
                                        $100,000            440                                                 11.81%      88,032     87,197    88,138    89,628            0

                                        $100,001
    Contact an experienced REALTOR
    Ready to Buy or Sell Real Estate?


                                        $150,000            972                                                 26.09% 125,794       123,821 125,636 128,943 132,688

                                        $150,001
                                        $200,000            647                                                 17.37% 173,548       172,539 172,435 176,305 173,181

                                        $200,001
                                        $275,000            438                                                 11.76% 235,367       235,036 231,821 238,940 231,603

                                        $275,001
                                         and up             446                                                 11.97% 423,552       359,565 394,390 397,601 605,108


                                        Average Closed Price:         $161,207                                                       $111,124 $136,041 $230,111 $440,594
                                        Total Closed Units:               3,725                                                           735     2027      861      102
                                        Total Closed Volume:        600,497,742                                                        81.68M 275.75M 198.13M     44.94M

Reports produced and compiled by RE STATS Inc. Information is deemed reliable but not guaranteed. Does not reflect all market activity.                                 pp. 8

Steve Reese                                                                                            405-848-9944                steve@oklahomarealtors.com
Monthly Inventory Analysis
                                                          Data from the The Oklahoma Association of
                                                          REALTORS®

                                                                             June 2012
                                                          Closed Sales as of Jul 11, 2012

Average Percent of List Price to Selling Price                                                                                       Report Produced on: Jul 13, 2012
Area Delimited by Entire OK State MLS - Single-Family Property Type

                                                           JUNE                                                              YEAR TO DATE (YTD)
              2008                            2009          2010         2011          2012               2008             2009        2010          2011            2012

     97.08%                                                                          97.13%             96.80%
                                              96.79%      96.62%                                                                      96.48%                       96.30%
                                                                                                                      96.08%
                                                                        96.15%                                                                     95.76%
                                                                                     1 Year                                                                        1 Year
                                                                                      +1.02%                                                                       +0.56%
                                                                                     2 Year                                                                        2 Year
                                                                                      +0.52%                                                                       -0.19%


                                                            5 YEAR MARKET ACTIVITY TRENDS                                           5yr JUN AVG=96.75%       3 MONTHS
   Average List/Sell Price


                                         98                                                                                         High                    A 96.70%
                                                                                                                                    May 2008 = 97.13%       P
                                                                                                                                    Low                     R
                                         97
                                                                                                                                    Jan 2011 = 95.15%      M 96.61%
                                                                                                                                                           A
                                         96
                                                                                                                                    Average List/Sell this Y -0.10%
                                                                                                                                    month at 97.13%,
                                                                                                                                     above the 5 yr JUN J 97.13%
                                                                                                                                                           U
                                         95
                                                 Jun 2008 Dec 2008 Jun 2009 Dec 2009 Jun 2010 Dec 2010 Jun 2011 Dec 2011            average of 96.75% N 0.54%


                                                        AVERAGE L/S% OF CLOSED SALES & BEDROOMS DISTRIBUTION BY PRICE
                                               Distribution of $avgmed L/S % by Price Range                   %       AVL/S%          2 Beds    3 Beds    4 Beds      5 Beds+

                                        $25,000
                                        and less            147                                              3.95% 92.79% 92.13% 95.17% 89.08% 50.20%

                                         $25,001
                                         $75,000            635                                            17.05% 96.92% 93.43% 99.17% 95.05% 92.94%

                                        $75,001
                                        $100,000            440                                            11.81% 96.73% 95.57% 96.98% 98.30%                         0.00%

                                        $100,001
    Contact an experienced REALTOR
    Ready to Buy or Sell Real Estate?


                                        $150,000            972                                            26.09% 97.44% 96.79% 97.78% 96.58% 94.02%

                                        $150,001
                                        $200,000            647                                            17.37% 97.86% 97.20% 98.07% 97.95% 95.50%

                                        $200,001
                                        $275,000            438                                            11.76% 97.80% 97.55% 97.56% 98.23% 95.53%

                                        $275,001
                                         and up             446                                            11.97% 96.85% 96.42% 97.10% 97.09% 95.73%

                                        Average List/Sell Ratio:       97.10%                                                         95.28%     97.85%    97.27%     95.00%
                                        Total Closed Units:              3,725                                                            735      2027        861        102
                                        Total Closed Volume:       600,497,742                                                        81.68M    275.75M   198.13M     44.94M

Reports produced and compiled by RE STATS Inc. Information is deemed reliable but not guaranteed. Does not reflect all market activity.                                  pp. 9

Steve Reese                                                                                         405-848-9944                  steve@oklahomarealtors.com
Monthly Inventory Analysis
                                  Data from the The Oklahoma Association of
                                  REALTORS®

                                                       June 2012
                                  Inventory as of Jul 11, 2012

Market Summary                                                                                                   Report Produced on: Jul 13, 2012
Area Delimited by Entire OK State MLS - Single-Family Property Type


                   Inventory                              Inventory                Market Activity                          Market Activity
                                                              New Listings                Closed Sales
                                                            5,980 = 20.94%               3,725 = 11.55%
                                                            Start Inventory               Pending Sales
                                                                22,576                   3,814 = 11.82%
                                                            Total Inventory
                                                                                        Other Off Market
                                                                Units                    2,326 = 7.21%
                                                               28,556
                                                               Volume                   Active Inventory
                                                           $5,586,923,382               22,400 = 69.43%


Absorption: Last 12 months, an Average of 3,101 Sales/Month                                    JUNE                                Year To Date

Active Inventory as of June 30, 2012 = 22,400                                       2011          2012        +/-%         2011           2012        +/-%
Closed Sales                                                                        3,452        3,725        7.91%        16,596          19,132     15.28%
Pending Sales                                                                       3,392        3,814       12.44%        18,201          21,933     20.50%
New Listings                                                                        6,618        5,980       -9.64%        36,223          37,415      3.29%
Average List Price                                                                161,298      166,728        3.37%       153,685         157,648      2.58%
Average Sale Price                                                                155,373      161,207        3.75%       147,521         152,069      3.08%
Average Percent of List Price to Selling Price                                    96.15%       97.13%         1.02%       95.76%          96.30%       0.56%
Average Days on Market to Sale                                                      83.05        76.85       -7.47%         90.30           85.18     -5.68%
Monthly Inventory                                                                  26,280       22,400      -14.76%        26,280          22,400    -14.76%
Months Supply of Inventory                                                           9.90         7.22      -27.04%          9.90            7.22    -27.04%

                                                                         2011                                                                            2011
                             JUNE MARKET                                 2012                              AVERAGE PRICES                                2012

      New Listings                                Pending Listings                          List Price                                Sale Price

     6,618          5,980                                                                          166,728
                                                                                    161,298                                                      161,207
                                                  3,392          3,814                                                            155,373


                    -9.64%                                      +12.44%                             +3.37%                                          +3.75%

                                                                         2011                                                                            2011
                              INVENTORY                                  2012                          AVERAGE L/S% & DOM                                2012

      Active Inventory                  Monthly Supply of Inventory                % of List to Sale Price                   Days on Market to Sale

    26,280                                         9.90                                            97.13%                          83.05

                   22,400                                         7.22              96.15%                                                          76.85


                   -14.76%                                      -27.04%                             +1.02%                                          -7.47%

Reports produced and compiled by RE STATS Inc. Information is deemed reliable but not guaranteed. Does not reflect all market activity.                  pp. 10

Steve Reese                                                                     405-848-9944                 steve@oklahomarealtors.com

Mais conteúdo relacionado

Mais procurados

GT Industry Intelligence Unit - Retail 2012 Australia
GT Industry Intelligence Unit - Retail 2012 AustraliaGT Industry Intelligence Unit - Retail 2012 Australia
GT Industry Intelligence Unit - Retail 2012 AustraliaGrant Thornton
 
Metro Boston Monthly Indicators Report, October 2012
Metro Boston Monthly Indicators Report, October 2012 Metro Boston Monthly Indicators Report, October 2012
Metro Boston Monthly Indicators Report, October 2012 Unit Realty Group
 
January 2013's Monthly Indicators report
January 2013's Monthly Indicators reportJanuary 2013's Monthly Indicators report
January 2013's Monthly Indicators reportUnit Realty Group
 
This Month in Real Estate for Canada - December 2011
This Month in Real Estate for Canada - December 2011This Month in Real Estate for Canada - December 2011
This Month in Real Estate for Canada - December 2011Keller Williams Careers
 
Daily Deal Industry in China Q3, 2012 inc. Travel Special
Daily Deal Industry in China Q3, 2012 inc. Travel Special Daily Deal Industry in China Q3, 2012 inc. Travel Special
Daily Deal Industry in China Q3, 2012 inc. Travel Special dataotuan
 
Spencer Levy - Capital Markets 2.0 - Did We Speak Too Soon?
Spencer Levy - Capital Markets 2.0 - Did We Speak Too Soon?Spencer Levy - Capital Markets 2.0 - Did We Speak Too Soon?
Spencer Levy - Capital Markets 2.0 - Did We Speak Too Soon?Ryan Slack
 
Greater Boston Real Estate Market Data, September 2012
Greater Boston Real Estate Market Data, September 2012Greater Boston Real Estate Market Data, September 2012
Greater Boston Real Estate Market Data, September 2012Unit Realty Group
 
Mercer Capital's Value Focus: Real Estate Industry | Q4 2017 | Segment Focus:...
Mercer Capital's Value Focus: Real Estate Industry | Q4 2017 | Segment Focus:...Mercer Capital's Value Focus: Real Estate Industry | Q4 2017 | Segment Focus:...
Mercer Capital's Value Focus: Real Estate Industry | Q4 2017 | Segment Focus:...Mercer Capital
 
Toronto real estate statistics December 2011
Toronto real estate statistics December 2011Toronto real estate statistics December 2011
Toronto real estate statistics December 2011John Helfrich
 

Mais procurados (18)

Market Data, November 2012
Market Data, November 2012Market Data, November 2012
Market Data, November 2012
 
Weekly market outlook 11.02.12
Weekly market outlook 11.02.12Weekly market outlook 11.02.12
Weekly market outlook 11.02.12
 
Toronto Real Estate Board Market Watch for October 2012
Toronto Real Estate Board Market Watch for October 2012Toronto Real Estate Board Market Watch for October 2012
Toronto Real Estate Board Market Watch for October 2012
 
GT Industry Intelligence Unit - Retail 2012 Australia
GT Industry Intelligence Unit - Retail 2012 AustraliaGT Industry Intelligence Unit - Retail 2012 Australia
GT Industry Intelligence Unit - Retail 2012 Australia
 
Weekly market outlook 18.02.12
Weekly market outlook 18.02.12Weekly market outlook 18.02.12
Weekly market outlook 18.02.12
 
Metro Boston Monthly Indicators Report, October 2012
Metro Boston Monthly Indicators Report, October 2012 Metro Boston Monthly Indicators Report, October 2012
Metro Boston Monthly Indicators Report, October 2012
 
Market Watch December 2012
Market Watch December 2012Market Watch December 2012
Market Watch December 2012
 
Market Watch March 2012
Market Watch March 2012Market Watch March 2012
Market Watch March 2012
 
Month In Review February 2012
Month In Review February 2012Month In Review February 2012
Month In Review February 2012
 
January 2013's Monthly Indicators report
January 2013's Monthly Indicators reportJanuary 2013's Monthly Indicators report
January 2013's Monthly Indicators report
 
This Month in Real Estate for Canada - December 2011
This Month in Real Estate for Canada - December 2011This Month in Real Estate for Canada - December 2011
This Month in Real Estate for Canada - December 2011
 
Daily Deal Industry in China Q3, 2012 inc. Travel Special
Daily Deal Industry in China Q3, 2012 inc. Travel Special Daily Deal Industry in China Q3, 2012 inc. Travel Special
Daily Deal Industry in China Q3, 2012 inc. Travel Special
 
Spencer Levy - Capital Markets 2.0 - Did We Speak Too Soon?
Spencer Levy - Capital Markets 2.0 - Did We Speak Too Soon?Spencer Levy - Capital Markets 2.0 - Did We Speak Too Soon?
Spencer Levy - Capital Markets 2.0 - Did We Speak Too Soon?
 
Greater Toronto REALTORS Condo Report for Q2, 2012
Greater Toronto REALTORS Condo Report for Q2, 2012Greater Toronto REALTORS Condo Report for Q2, 2012
Greater Toronto REALTORS Condo Report for Q2, 2012
 
Greater Boston Real Estate Market Data, September 2012
Greater Boston Real Estate Market Data, September 2012Greater Boston Real Estate Market Data, September 2012
Greater Boston Real Estate Market Data, September 2012
 
Mercer Capital's Value Focus: Real Estate Industry | Q4 2017 | Segment Focus:...
Mercer Capital's Value Focus: Real Estate Industry | Q4 2017 | Segment Focus:...Mercer Capital's Value Focus: Real Estate Industry | Q4 2017 | Segment Focus:...
Mercer Capital's Value Focus: Real Estate Industry | Q4 2017 | Segment Focus:...
 
Toronto real estate statistics December 2011
Toronto real estate statistics December 2011Toronto real estate statistics December 2011
Toronto real estate statistics December 2011
 
2013 Canadian Retail Outlook
2013 Canadian Retail Outlook2013 Canadian Retail Outlook
2013 Canadian Retail Outlook
 

Destaque

The impact of innovation on travel and tourism industries (World Travel Marke...
The impact of innovation on travel and tourism industries (World Travel Marke...The impact of innovation on travel and tourism industries (World Travel Marke...
The impact of innovation on travel and tourism industries (World Travel Marke...Brian Solis
 
Open Source Creativity
Open Source CreativityOpen Source Creativity
Open Source CreativitySara Cannon
 
Reuters: Pictures of the Year 2016 (Part 2)
Reuters: Pictures of the Year 2016 (Part 2)Reuters: Pictures of the Year 2016 (Part 2)
Reuters: Pictures of the Year 2016 (Part 2)maditabalnco
 
The Six Highest Performing B2B Blog Post Formats
The Six Highest Performing B2B Blog Post FormatsThe Six Highest Performing B2B Blog Post Formats
The Six Highest Performing B2B Blog Post FormatsBarry Feldman
 
The Outcome Economy
The Outcome EconomyThe Outcome Economy
The Outcome EconomyHelge Tennø
 

Destaque (6)

Succession “Losers”: What Happens to Executives Passed Over for the CEO Job?
Succession “Losers”: What Happens to Executives Passed Over for the CEO Job? Succession “Losers”: What Happens to Executives Passed Over for the CEO Job?
Succession “Losers”: What Happens to Executives Passed Over for the CEO Job?
 
The impact of innovation on travel and tourism industries (World Travel Marke...
The impact of innovation on travel and tourism industries (World Travel Marke...The impact of innovation on travel and tourism industries (World Travel Marke...
The impact of innovation on travel and tourism industries (World Travel Marke...
 
Open Source Creativity
Open Source CreativityOpen Source Creativity
Open Source Creativity
 
Reuters: Pictures of the Year 2016 (Part 2)
Reuters: Pictures of the Year 2016 (Part 2)Reuters: Pictures of the Year 2016 (Part 2)
Reuters: Pictures of the Year 2016 (Part 2)
 
The Six Highest Performing B2B Blog Post Formats
The Six Highest Performing B2B Blog Post FormatsThe Six Highest Performing B2B Blog Post Formats
The Six Highest Performing B2B Blog Post Formats
 
The Outcome Economy
The Outcome EconomyThe Outcome Economy
The Outcome Economy
 

Semelhante a June 2012 MLS Statistics

Residential Sales Report - December 2011
Residential Sales Report - December 2011Residential Sales Report - December 2011
Residential Sales Report - December 2011Team Price Real Estate
 
Monthly Real Estate Indicators: Twin Cities Housing Market Info & Statistics
Monthly Real Estate Indicators: Twin Cities Housing Market Info & StatisticsMonthly Real Estate Indicators: Twin Cities Housing Market Info & Statistics
Monthly Real Estate Indicators: Twin Cities Housing Market Info & Statisticspattiann
 
TREB Market Watch October 2012
TREB Market Watch October 2012TREB Market Watch October 2012
TREB Market Watch October 2012realestatesnatch
 
Naea 09-13
Naea 09-13Naea 09-13
Naea 09-13Cate8364
 
TREB Market Watch May 2012
TREB Market Watch May 2012TREB Market Watch May 2012
TREB Market Watch May 2012realestatesnatch
 
Toronto Real Estate Market Update june 2012
Toronto Real Estate Market Update june 2012Toronto Real Estate Market Update june 2012
Toronto Real Estate Market Update june 2012jefftoleary
 
February 2013's Monthly Indicators report - Boston Real Estate Market Trends
February 2013's Monthly Indicators report - Boston Real Estate Market TrendsFebruary 2013's Monthly Indicators report - Boston Real Estate Market Trends
February 2013's Monthly Indicators report - Boston Real Estate Market TrendsUnit Realty Group
 
Georgia Home prices up 25.4% since last January!
Georgia Home prices up 25.4% since last January! Georgia Home prices up 25.4% since last January!
Georgia Home prices up 25.4% since last January! Sandra Watkins
 
The Nest Report Q3 2012
The Nest Report Q3 2012The Nest Report Q3 2012
The Nest Report Q3 2012Jeremy Hart
 
Market Watch: August 2012
Market Watch: August 2012Market Watch: August 2012
Market Watch: August 2012lauragolbeck
 
PVP market report
PVP market reportPVP market report
PVP market reportJDCalvin
 

Semelhante a June 2012 MLS Statistics (20)

Residential Sales Report - December 2011
Residential Sales Report - December 2011Residential Sales Report - December 2011
Residential Sales Report - December 2011
 
May 2013 Housing Sales Statistics
May 2013 Housing Sales StatisticsMay 2013 Housing Sales Statistics
May 2013 Housing Sales Statistics
 
September 2012 Toronto Real Estate Market Watch
September 2012 Toronto Real Estate Market WatchSeptember 2012 Toronto Real Estate Market Watch
September 2012 Toronto Real Estate Market Watch
 
Mw1209
Mw1209Mw1209
Mw1209
 
Monthly Real Estate Indicators: Twin Cities Housing Market Info & Statistics
Monthly Real Estate Indicators: Twin Cities Housing Market Info & StatisticsMonthly Real Estate Indicators: Twin Cities Housing Market Info & Statistics
Monthly Real Estate Indicators: Twin Cities Housing Market Info & Statistics
 
TREB Market Watch October 2012
TREB Market Watch October 2012TREB Market Watch October 2012
TREB Market Watch October 2012
 
Naea 09-13
Naea 09-13Naea 09-13
Naea 09-13
 
Market Data, December 2012
Market Data, December 2012Market Data, December 2012
Market Data, December 2012
 
TREB Market Watch May 2012
TREB Market Watch May 2012TREB Market Watch May 2012
TREB Market Watch May 2012
 
Toronto Area REALTORS Releases Market Watch for May 2012
Toronto Area REALTORS Releases Market Watch for May 2012Toronto Area REALTORS Releases Market Watch for May 2012
Toronto Area REALTORS Releases Market Watch for May 2012
 
Toronto Real Estate Market Update june 2012
Toronto Real Estate Market Update june 2012Toronto Real Estate Market Update june 2012
Toronto Real Estate Market Update june 2012
 
Mw1204
Mw1204Mw1204
Mw1204
 
April 2013 Housing Sales Statistics
April 2013 Housing Sales StatisticsApril 2013 Housing Sales Statistics
April 2013 Housing Sales Statistics
 
February 2013's Monthly Indicators report - Boston Real Estate Market Trends
February 2013's Monthly Indicators report - Boston Real Estate Market TrendsFebruary 2013's Monthly Indicators report - Boston Real Estate Market Trends
February 2013's Monthly Indicators report - Boston Real Estate Market Trends
 
Georgia Home prices up 25.4% since last January!
Georgia Home prices up 25.4% since last January! Georgia Home prices up 25.4% since last January!
Georgia Home prices up 25.4% since last January!
 
The Nest Report Q3 2012
The Nest Report Q3 2012The Nest Report Q3 2012
The Nest Report Q3 2012
 
August 2013 Housing Sales Statistics
August 2013 Housing Sales StatisticsAugust 2013 Housing Sales Statistics
August 2013 Housing Sales Statistics
 
Market Watch August 2012
Market Watch August 2012Market Watch August 2012
Market Watch August 2012
 
Market Watch: August 2012
Market Watch: August 2012Market Watch: August 2012
Market Watch: August 2012
 
PVP market report
PVP market reportPVP market report
PVP market report
 

Último

Nanke Area Estate commercial ( Dir. Kat Kuo)
Nanke Area Estate commercial ( Dir. Kat Kuo)Nanke Area Estate commercial ( Dir. Kat Kuo)
Nanke Area Estate commercial ( Dir. Kat Kuo)jessica288382
 
Affordable and Quality Construction SVTN's Signature Blend of Cost-Efficiency...
Affordable and Quality Construction SVTN's Signature Blend of Cost-Efficiency...Affordable and Quality Construction SVTN's Signature Blend of Cost-Efficiency...
Affordable and Quality Construction SVTN's Signature Blend of Cost-Efficiency...AditiAlishetty
 
83770-87607 ۞Call Girls In Near The Park Hotel (Cp) Delhi
83770-87607 ۞Call Girls In Near The Park Hotel (Cp) Delhi83770-87607 ۞Call Girls In Near The Park Hotel (Cp) Delhi
83770-87607 ۞Call Girls In Near The Park Hotel (Cp) Delhidollysharma2066
 
Eco-Efficient Living: Redefining Sustainability through Leech's Green Design ...
Eco-Efficient Living: Redefining Sustainability through Leech's Green Design ...Eco-Efficient Living: Redefining Sustainability through Leech's Green Design ...
Eco-Efficient Living: Redefining Sustainability through Leech's Green Design ...Newman George Leech
 
Covid 19 and Market Impact during the Pandemic
Covid 19 and Market Impact during the PandemicCovid 19 and Market Impact during the Pandemic
Covid 19 and Market Impact during the PandemicTim Wilmath
 
SSPL The Strand Abodes Kharadi Pune Brochure.pdf
SSPL The Strand Abodes Kharadi Pune Brochure.pdfSSPL The Strand Abodes Kharadi Pune Brochure.pdf
SSPL The Strand Abodes Kharadi Pune Brochure.pdfabbu831446
 
Call Girls In Vasundhara Ghaziabad ❤️8860477959 Low Rate Escorts Service In 2...
Call Girls In Vasundhara Ghaziabad ❤️8860477959 Low Rate Escorts Service In 2...Call Girls In Vasundhara Ghaziabad ❤️8860477959 Low Rate Escorts Service In 2...
Call Girls In Vasundhara Ghaziabad ❤️8860477959 Low Rate Escorts Service In 2...lizamodels9
 
Cashpay_Call Girls In Gaur City Mall Noida ❤️8860477959 Escorts Service In 24...
Cashpay_Call Girls In Gaur City Mall Noida ❤️8860477959 Escorts Service In 24...Cashpay_Call Girls In Gaur City Mall Noida ❤️8860477959 Escorts Service In 24...
Cashpay_Call Girls In Gaur City Mall Noida ❤️8860477959 Escorts Service In 24...lizamodels9
 
Call Girls in Nehru Place Delhi 💯Call Us 🔝8264348440🔝
Call Girls in Nehru Place Delhi 💯Call Us 🔝8264348440🔝Call Girls in Nehru Place Delhi 💯Call Us 🔝8264348440🔝
Call Girls in Nehru Place Delhi 💯Call Us 🔝8264348440🔝soniya singh
 
Sobha Aranya Sector 80 Gurgaon E- Brochure.pdf
Sobha Aranya Sector 80 Gurgaon E- Brochure.pdfSobha Aranya Sector 80 Gurgaon E- Brochure.pdf
Sobha Aranya Sector 80 Gurgaon E- Brochure.pdffaheemali990101
 
Prestige Rainbow Waters Raidurgam, Gachibowli Hyderabad E- Brochure.pdf
Prestige Rainbow Waters Raidurgam, Gachibowli Hyderabad E- Brochure.pdfPrestige Rainbow Waters Raidurgam, Gachibowli Hyderabad E- Brochure.pdf
Prestige Rainbow Waters Raidurgam, Gachibowli Hyderabad E- Brochure.pdffaheemali990101
 
Rustomjee The Panorama At Pali Hill, Bandra West, Mumbai - Brochure.pdf
Rustomjee The Panorama At Pali Hill, Bandra West, Mumbai - Brochure.pdfRustomjee The Panorama At Pali Hill, Bandra West, Mumbai - Brochure.pdf
Rustomjee The Panorama At Pali Hill, Bandra West, Mumbai - Brochure.pdfmonikasharma630
 
9990771857 Call Girls in Noida Sector 10 Noida (Call Girls) Delhi
9990771857 Call Girls in Noida Sector 10 Noida (Call Girls) Delhi9990771857 Call Girls in Noida Sector 10 Noida (Call Girls) Delhi
9990771857 Call Girls in Noida Sector 10 Noida (Call Girls) Delhidelhimodel235
 
Brigade Neopolis Kokapet, Hyderabad E- Brochure
Brigade Neopolis Kokapet, Hyderabad E- BrochureBrigade Neopolis Kokapet, Hyderabad E- Brochure
Brigade Neopolis Kokapet, Hyderabad E- Brochurefaheemali990101
 
LCAR Unit 22 - Leasing and Property Management - 14th Edition Revised.pptx
LCAR Unit 22 - Leasing and Property Management - 14th Edition Revised.pptxLCAR Unit 22 - Leasing and Property Management - 14th Edition Revised.pptx
LCAR Unit 22 - Leasing and Property Management - 14th Edition Revised.pptxTom Blefko
 
Ajmera Prive at Juhu, Mumbai E-Brochure.pdf
Ajmera Prive at Juhu, Mumbai  E-Brochure.pdfAjmera Prive at Juhu, Mumbai  E-Brochure.pdf
Ajmera Prive at Juhu, Mumbai E-Brochure.pdfManishSaxena95
 
Namrata 7 Plumeria Drive Pimpri Chinchwad Pune Brochure.pdf
Namrata 7 Plumeria Drive Pimpri Chinchwad Pune Brochure.pdfNamrata 7 Plumeria Drive Pimpri Chinchwad Pune Brochure.pdf
Namrata 7 Plumeria Drive Pimpri Chinchwad Pune Brochure.pdfPrachiRudram
 
Call Girls In The Lalit New Delhi ❤️8860477959 Good Looking Escorts In 24/7 D...
Call Girls In The Lalit New Delhi ❤️8860477959 Good Looking Escorts In 24/7 D...Call Girls In The Lalit New Delhi ❤️8860477959 Good Looking Escorts In 24/7 D...
Call Girls In The Lalit New Delhi ❤️8860477959 Good Looking Escorts In 24/7 D...lizamodels9
 
8 Key Elements for Comfortable Farmland Living
8 Key Elements for Comfortable Farmland Living 8 Key Elements for Comfortable Farmland Living
8 Key Elements for Comfortable Farmland Living Farmland Bazaar
 

Último (20)

Nanke Area Estate commercial ( Dir. Kat Kuo)
Nanke Area Estate commercial ( Dir. Kat Kuo)Nanke Area Estate commercial ( Dir. Kat Kuo)
Nanke Area Estate commercial ( Dir. Kat Kuo)
 
Call Girls in Mahavir Nagar whatsaap call US +919953056974
Call Girls in Mahavir Nagar  whatsaap call US  +919953056974Call Girls in Mahavir Nagar  whatsaap call US  +919953056974
Call Girls in Mahavir Nagar whatsaap call US +919953056974
 
Affordable and Quality Construction SVTN's Signature Blend of Cost-Efficiency...
Affordable and Quality Construction SVTN's Signature Blend of Cost-Efficiency...Affordable and Quality Construction SVTN's Signature Blend of Cost-Efficiency...
Affordable and Quality Construction SVTN's Signature Blend of Cost-Efficiency...
 
83770-87607 ۞Call Girls In Near The Park Hotel (Cp) Delhi
83770-87607 ۞Call Girls In Near The Park Hotel (Cp) Delhi83770-87607 ۞Call Girls In Near The Park Hotel (Cp) Delhi
83770-87607 ۞Call Girls In Near The Park Hotel (Cp) Delhi
 
Eco-Efficient Living: Redefining Sustainability through Leech's Green Design ...
Eco-Efficient Living: Redefining Sustainability through Leech's Green Design ...Eco-Efficient Living: Redefining Sustainability through Leech's Green Design ...
Eco-Efficient Living: Redefining Sustainability through Leech's Green Design ...
 
Covid 19 and Market Impact during the Pandemic
Covid 19 and Market Impact during the PandemicCovid 19 and Market Impact during the Pandemic
Covid 19 and Market Impact during the Pandemic
 
SSPL The Strand Abodes Kharadi Pune Brochure.pdf
SSPL The Strand Abodes Kharadi Pune Brochure.pdfSSPL The Strand Abodes Kharadi Pune Brochure.pdf
SSPL The Strand Abodes Kharadi Pune Brochure.pdf
 
Call Girls In Vasundhara Ghaziabad ❤️8860477959 Low Rate Escorts Service In 2...
Call Girls In Vasundhara Ghaziabad ❤️8860477959 Low Rate Escorts Service In 2...Call Girls In Vasundhara Ghaziabad ❤️8860477959 Low Rate Escorts Service In 2...
Call Girls In Vasundhara Ghaziabad ❤️8860477959 Low Rate Escorts Service In 2...
 
Cashpay_Call Girls In Gaur City Mall Noida ❤️8860477959 Escorts Service In 24...
Cashpay_Call Girls In Gaur City Mall Noida ❤️8860477959 Escorts Service In 24...Cashpay_Call Girls In Gaur City Mall Noida ❤️8860477959 Escorts Service In 24...
Cashpay_Call Girls In Gaur City Mall Noida ❤️8860477959 Escorts Service In 24...
 
Call Girls in Nehru Place Delhi 💯Call Us 🔝8264348440🔝
Call Girls in Nehru Place Delhi 💯Call Us 🔝8264348440🔝Call Girls in Nehru Place Delhi 💯Call Us 🔝8264348440🔝
Call Girls in Nehru Place Delhi 💯Call Us 🔝8264348440🔝
 
Sobha Aranya Sector 80 Gurgaon E- Brochure.pdf
Sobha Aranya Sector 80 Gurgaon E- Brochure.pdfSobha Aranya Sector 80 Gurgaon E- Brochure.pdf
Sobha Aranya Sector 80 Gurgaon E- Brochure.pdf
 
Prestige Rainbow Waters Raidurgam, Gachibowli Hyderabad E- Brochure.pdf
Prestige Rainbow Waters Raidurgam, Gachibowli Hyderabad E- Brochure.pdfPrestige Rainbow Waters Raidurgam, Gachibowli Hyderabad E- Brochure.pdf
Prestige Rainbow Waters Raidurgam, Gachibowli Hyderabad E- Brochure.pdf
 
Rustomjee The Panorama At Pali Hill, Bandra West, Mumbai - Brochure.pdf
Rustomjee The Panorama At Pali Hill, Bandra West, Mumbai - Brochure.pdfRustomjee The Panorama At Pali Hill, Bandra West, Mumbai - Brochure.pdf
Rustomjee The Panorama At Pali Hill, Bandra West, Mumbai - Brochure.pdf
 
9990771857 Call Girls in Noida Sector 10 Noida (Call Girls) Delhi
9990771857 Call Girls in Noida Sector 10 Noida (Call Girls) Delhi9990771857 Call Girls in Noida Sector 10 Noida (Call Girls) Delhi
9990771857 Call Girls in Noida Sector 10 Noida (Call Girls) Delhi
 
Brigade Neopolis Kokapet, Hyderabad E- Brochure
Brigade Neopolis Kokapet, Hyderabad E- BrochureBrigade Neopolis Kokapet, Hyderabad E- Brochure
Brigade Neopolis Kokapet, Hyderabad E- Brochure
 
LCAR Unit 22 - Leasing and Property Management - 14th Edition Revised.pptx
LCAR Unit 22 - Leasing and Property Management - 14th Edition Revised.pptxLCAR Unit 22 - Leasing and Property Management - 14th Edition Revised.pptx
LCAR Unit 22 - Leasing and Property Management - 14th Edition Revised.pptx
 
Ajmera Prive at Juhu, Mumbai E-Brochure.pdf
Ajmera Prive at Juhu, Mumbai  E-Brochure.pdfAjmera Prive at Juhu, Mumbai  E-Brochure.pdf
Ajmera Prive at Juhu, Mumbai E-Brochure.pdf
 
Namrata 7 Plumeria Drive Pimpri Chinchwad Pune Brochure.pdf
Namrata 7 Plumeria Drive Pimpri Chinchwad Pune Brochure.pdfNamrata 7 Plumeria Drive Pimpri Chinchwad Pune Brochure.pdf
Namrata 7 Plumeria Drive Pimpri Chinchwad Pune Brochure.pdf
 
Call Girls In The Lalit New Delhi ❤️8860477959 Good Looking Escorts In 24/7 D...
Call Girls In The Lalit New Delhi ❤️8860477959 Good Looking Escorts In 24/7 D...Call Girls In The Lalit New Delhi ❤️8860477959 Good Looking Escorts In 24/7 D...
Call Girls In The Lalit New Delhi ❤️8860477959 Good Looking Escorts In 24/7 D...
 
8 Key Elements for Comfortable Farmland Living
8 Key Elements for Comfortable Farmland Living 8 Key Elements for Comfortable Farmland Living
8 Key Elements for Comfortable Farmland Living
 

June 2012 MLS Statistics

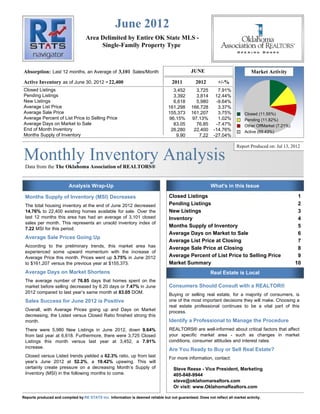
  • 1. June 2012 Area Delimited by Entire OK State MLS - Single-Family Property Type Absorption: Last 12 months, an Average of 3,101 Sales/Month JUNE Market Activity Active Inventory as of June 30, 2012 = 22,400 2011 2012 +/-% Closed Listings 3,452 3,725 7.91% Pending Listings 3,392 3,814 12.44% New Listings 6,618 5,980 -9.64% Average List Price 161,298 166,728 3.37% Average Sale Price 155,373 161,207 3.75% Closed (11.55%) Average Percent of List Price to Selling Price 96.15% 97.13% 1.02% Pending (11.82%) Average Days on Market to Sale 83.05 76.85 -7.47% Other OffMarket (7.21%) End of Month Inventory 26,280 22,400 -14.76% Active (69.43%) Months Supply of Inventory 9.90 7.22 -27.04% Report Produced on: Jul 13, 2012 Monthly Inventory Analysis Data from the The Oklahoma Association of REALTORS® Analysis Wrap-Up What's in this Issue Months Supply of Inventory (MSI) Decreases Closed Listings 1 The total housing inventory at the end of June 2012 decreased Pending Listings 2 14.76% to 22,400 existing homes available for sale. Over the New Listings 3 last 12 months this area has had an average of 3,101 closed Inventory 4 sales per month. This represents an unsold inventory index of Months Supply of Inventory 5 7.22 MSI for this period. Average Days on Market to Sale 6 Average Sale Prices Going Up Average List Price at Closing 7 According to the preliminary trends, this market area has Average Sale Price at Closing 8 experienced some upward momentum with the increase of Average Price this month. Prices went up 3.75% in June 2012 Average Percent of List Price to Selling Price 9 to $161,207 versus the previous year at $155,373. Market Summary 10 Average Days on Market Shortens Real Estate is Local The average number of 76.85 days that homes spent on the market before selling decreased by 6.20 days or 7.47% in June Consumers Should Consult with a REALTOR® 2012 compared to last year’s same month at 83.05 DOM. Buying or selling real estate, for a majority of consumers, is Sales Success for June 2012 is Positive one of the most important decisions they will make. Choosing a real estate professional continues to be a vital part of this Overall, with Average Prices going up and Days on Market process. decreasing, the Listed versus Closed Ratio finished strong this month. Identify a Professional to Manage the Procedure There were 5,980 New Listings in June 2012, down 9.64% REALTORS® are well-informed about critical factors that affect from last year at 6,618. Furthermore, there were 3,725 Closed your specific market area - such as changes in market Listings this month versus last year at 3,452, a 7.91% conditions, consumer attitudes and interest rates. increase. Are You Ready to Buy or Sell Real Estate? Closed versus Listed trends yielded a 62.3% ratio, up from last For more information, contact: year’s June 2012 at 52.2%, a 19.42% upswing. This will certainly create pressure on a decreasing Month’s Supply of Steve Reese - Vice President, Marketing Inventory (MSI) in the following months to come. 405-848-9944 steve@oklahomarealtors.com Or visit: www.OklahomaRealtors.com Reports produced and compiled by RE STATS Inc. Information is deemed reliable but not guaranteed. Does not reflect all market activity.
  • 2. Monthly Inventory Analysis Data from the The Oklahoma Association of REALTORS® June 2012 Closed Sales as of Jul 11, 2012 Closed Listings Report Produced on: Jul 13, 2012 Area Delimited by Entire OK State MLS - Single-Family Property Type JUNE YEAR TO DATE (YTD) 2008 2009 2010 2011 2012 2008 2009 2010 2011 2012 3,857 3,829 19,639 19,132 3,701 3,725 18,378 17,276 3,452 16,596 1 Year 1 Year +7.91% +15.28% 2 Year 2 Year +0.65% +4.10% 5 YEAR MARKET ACTIVITY TRENDS 5yr JUN AVG = 3,713 3 MONTHS 5,000 High A 3,361 Jul 2008 = 4,047 P 4,000 Low R 3,000 Jan 2010 = 1,695 M 3,845 A Closed Listings 2,000 Closed Listings this Y 14.40% 1,000 month at 3,725, above the 5 yr JUN J 3,725 U 0 Jun 2008 Dec 2008 Jun 2009 Dec 2009 Jun 2010 Dec 2010 Jun 2011 Dec 2011 average of 3,713 N -3.12% CLOSED LISTINGS & BEDROOMS DISTRIBUTION BY PRICE Distribution of Closed Listings by Price Range % AVDOM 2 Beds 3 Beds 4 Beds 5 Beds+ $25,000 and less 147 3.95% 67.2 74 59 13 1 $25,001 $75,000 635 17.05% 81.7 202 371 56 6 $75,001 $100,000 440 11.81% 76.3 124 269 47 0 $100,001 Contact an experienced REALTOR Ready to Buy or Sell Real Estate? $150,000 972 26.09% 70.0 162 679 127 4 $150,001 $200,000 647 17.37% 81.4 87 365 181 14 $200,001 $275,000 438 11.76% 72.4 50 179 196 13 $275,001 and up 446 11.97% 86.6 36 105 241 64 Total Closed Units: 3,725 76.9 735 2027 861 102 Total Closed Volume: 600,497,742 81.68M 275.75M 198.13M 44.94M Average Closed Price: $161,207 $111,124 $136,041 $230,111 $440,594 Reports produced and compiled by RE STATS Inc. Information is deemed reliable but not guaranteed. Does not reflect all market activity. pp. 1 Steve Reese 405-848-9944 steve@oklahomarealtors.com
  • 3. Monthly Inventory Analysis Data from the The Oklahoma Association of REALTORS® June 2012 Pending Listings as of Jul 11, 2012 Pending Listings Report Produced on: Jul 13, 2012 Area Delimited by Entire OK State MLS - Single-Family Property Type JUNE YEAR TO DATE (YTD) 2008 2009 2010 2011 2012 2008 2009 2010 2011 2012 3,815 3,704 3,814 21,395 21,933 3,392 19,508 19,151 2,652 18,201 1 Year 1 Year +12.44% +20.50% 2 Year 2 Year +43.82% +14.53% 5 YEAR MARKET ACTIVITY TRENDS 5yr JUN AVG = 3,475 3 MONTHS 5,000 High A 3,996 Apr 2010 = 4,815 P 4,000 Low R 3,000 Dec 2009 = 2,009 M 3,955 A Pending Listings 2,000 Pending Listingsthis Y -1.03% 1,000 month at 3,814, above the 5 yr JUN J 3,814 U 0 Jun 2008 Dec 2008 Jun 2009 Dec 2009 Jun 2010 Dec 2010 Jun 2011 Dec 2011 average of 3,475 N -3.57% PENDING LISTINGS & BEDROOMS DISTRIBUTION BY PRICE Distribution of Pending Listings by Price Range % AVDOM 2 Beds 3 Beds 4 Beds 5 Beds+ $25,000 and less 135 3.54% 62.1 62 65 8 0 $25,001 $75,000 661 17.33% 81.0 215 398 44 4 $75,001 $100,000 430 11.27% 84.9 107 285 31 7 $100,001 Contact an experienced REALTOR Ready to Buy or Sell Real Estate? $150,000 990 25.96% 65.7 162 723 97 8 $150,001 $200,000 706 18.51% 72.5 100 391 204 11 $200,001 $275,000 461 12.09% 73.5 60 172 212 17 $275,001 and up 431 11.30% 89.5 34 105 233 59 Total Pending Units: 3,814 83.2 740 2139 829 106 Total Pending Volume: 627,556,031 86.44M 292.14M 196.11M 52.87M Average Listing Price: $158,470 $116,810 $136,576 $236,568 $498,737 Reports produced and compiled by RE STATS Inc. Information is deemed reliable but not guaranteed. Does not reflect all market activity. pp. 2 Steve Reese 405-848-9944 steve@oklahomarealtors.com
  • 4. Monthly Inventory Analysis Data from the The Oklahoma Association of REALTORS® June 2012 New Listings as of Jul 11, 2012 New Listings Report Produced on: Jul 13, 2012 Area Delimited by Entire OK State MLS - Single-Family Property Type JUNE YEAR TO DATE (YTD) 2008 2009 2010 2011 2012 2008 2009 2010 2011 2012 6,618 37,755 37,415 36,291 36,223 6,221 6,129 6,003 5,980 33,623 1 Year 1 Year -9.64% +3.29% 2 Year 2 Year -0.38% +3.10% 5 YEAR MARKET ACTIVITY TRENDS 5yr JUN AVG = 6,190 3 MONTHS 8,000 High A 6,716 7,000 Apr 2010 = 7,619 P 6,000 Low R 5,000 Dec 2008 = 3,505 M 6,615 4,000 A New Listings 3,000 New Listings this Y -1.50% 2,000 month at 5,980, 1,000 below the 5 yr JUN J 5,980 0 U Jun 2008 Dec 2008 Jun 2009 Dec 2009 Jun 2010 Dec 2010 Jun 2011 Dec 2011 average of 6,190 N -9.60% NEW LISTINGS & BEDROOMS DISTRIBUTION BY PRICE Distribution of New Listings by Price Range % 2 Beds 3 Beds 4 Beds 5 Beds+ $50,000 and less 491 8.21% 216 238 31 6 $50,001 $75,000 488 8.16% 159 284 39 6 $75,001 $100,000 688 11.51% 157 461 65 5 $100,001 Contact an experienced REALTOR Ready to Buy or Sell Real Estate? $150,000 1,523 25.47% 267 1,066 177 13 $150,001 $225,000 1,425 23.83% 221 738 436 30 $225,001 $325,000 769 12.86% 100 243 368 58 $325,001 and up 596 9.97% 55 132 284 125 Total New Listed Units: 5,980 1175 3162 1400 243 Total New Listed Volume: 1,145,436,871 202.16M 467.00M 367.09M 109.18M Average New Listed Listing Price: $156,692 $172,049 $147,693 $262,208 $449,310 Reports produced and compiled by RE STATS Inc. Information is deemed reliable but not guaranteed. Does not reflect all market activity. pp. 3 Steve Reese 405-848-9944 steve@oklahomarealtors.com
  • 5. Monthly Inventory Analysis Data from the The Oklahoma Association of REALTORS® June 2012 Active Inventory as of Jul 11, 2012 Active Inventory Report Produced on: Jul 13, 2012 Area Delimited by Entire OK State MLS - Single-Family Property Type END OF JUNE ACTIVE DURING JUNE 2008 2009 2010 2011 2012 2008 2009 2010 2011 2012 26,272 32,139 23,733 23,833 29,511 28,540 22,400 28,472 21,591 27,268 1 Year 1 Year -14.74% -11.20% 2 Year 2 Year -6.01% +0.24% 5 YEAR MARKET ACTIVITY TRENDS 5yr JUN AVG = 23,566 3 MONTHS Active Inventory 30,000 High A 22,388 Jul 2011 = 26,623 P Low R 20,000 Jan 2008 = 19,336 M 22,570 A 10,000 Inventory this Y 0.81% month at 22,400, below the 5 yr JUN J 22,400 0 U Jun 2008 Dec 2008 Jun 2009 Dec 2009 Jun 2010 Dec 2010 Jun 2011 Dec 2011 average of 23,566 N -0.75% INVENTORY & BEDROOMS DISTRIBUTION BY PRICE Distribution of Inventory by Price Range % AVDOM 2 Beds 3 Beds 4 Beds 5 Beds+ $50,000 and less 1,825 8.15% 121.1 912 791 105 17 $50,001 $75,000 2,298 10.26% 120.0 847 1,273 148 30 $75,001 $100,000 2,645 11.81% 110.0 674 1,685 260 26 $100,001 Contact an experienced REALTOR Ready to Buy or Sell Real Estate? $175,000 7,125 31.81% 95.4 1,242 4,647 1,152 84 $175,001 $225,000 2,718 12.13% 94.8 421 1,261 954 82 $225,001 $350,000 3,442 15.37% 102.1 458 1,213 1,526 245 $350,001 and up 2,347 10.48% 117.3 226 476 1,106 539 Total Active Inventory by Units: 22,400 105.0 4,780 11,346 5,251 1,023 Total Active Inventory by Volume: 4,510,240,733 693.79M 1.77B 1.49B 552.61M Average Active Inventory Listing Price: $201,350 $145,145 $156,053 $284,375 $540,189 Reports produced and compiled by RE STATS Inc. Information is deemed reliable but not guaranteed. Does not reflect all market activity. pp. 4 Steve Reese 405-848-9944 steve@oklahomarealtors.com
  • 6. Monthly Inventory Analysis Data from the The Oklahoma Association of REALTORS® June 2012 Active Inventory as of Jul 11, 2012 Months Supply of Inventory Report Produced on: Jul 13, 2012 Area Delimited by Entire OK State MLS - Single-Family Property Type MSI FOR JUNE INDICATORS FOR JUNE 2012 2008 2009 2010 2011 2012 Inventory Closed Absorption MSI MSI % 9.9 37,209 7.2 13.843% 7.4 22,400 6.9 7.1 7.2 1 Year 3,101 End of Closed Average Months Percent -27.02% Month Last Closed per Supply Months 2 Year Active 12 Month over of Supply of -2.50% Inventory Months 12 Months Inventory Inventory 5 YEAR MARKET ACTIVITY TRENDS 5yr JUN AVG = 7.7 3 MONTHS 10 High A 7.4 9 Jun 2011 = 9.9 P 8 Low R 7 6 Jan 2008 = 5.3 M 7.3 5 A Months Supply 4 Months Supply this Y -0.72% 3 2 month at 7.2, 1 below the 5 yr JUN J 7.2 0 U Jun 2008 Dec 2008 Jun 2009 Dec 2009 Jun 2010 Dec 2010 Jun 2011 Dec 2011 average of 7.7 N -1.48% MONTHS SUPPLY & BEDROOMS DISTRIBUTION BY PRICE Distribution of Active Inventory by Price Range and MSI % MSI 2 Beds 3 Beds 4 Beds 5 Beds+ $50,000 and less 1,825 8.15% 4.1 5.1 3.5 3.3 5.0 $50,001 $80,000 2,858 12.76% 7.3 9.2 6.6 6.4 12.4 $80,001 $110,000 2,829 12.63% 6.7 7.5 6.4 6.8 9.7 $110,001 Contact an experienced REALTOR Ready to Buy or Sell Real Estate? $170,000 6,060 27.05% 6.5 7.3 6.4 6.4 6.8 $170,001 $240,000 3,665 16.36% 7.5 9.1 7.5 7.0 8.7 $240,001 $360,000 2,908 12.98% 9.9 13.1 10.8 8.5 10.8 $360,001 and up 2,255 10.07% 15.9 23.9 16.3 13.8 18.8 MSI: 7.2 7.7 6.6 7.8 12.5 Total Active Inventory: 22,400 4,780 11,346 5,251 1,023 Reports produced and compiled by RE STATS Inc. Information is deemed reliable but not guaranteed. Does not reflect all market activity. pp. 5 Steve Reese 405-848-9944 steve@oklahomarealtors.com
  • 7. Monthly Inventory Analysis Data from the The Oklahoma Association of REALTORS® June 2012 Closed Sales as of Jul 11, 2012 Average Days on Market to Sale Report Produced on: Jul 13, 2012 Area Delimited by Entire OK State MLS - Single-Family Property Type JUNE YEAR TO DATE (YTD) 2008 2009 2010 2011 2012 2008 2009 2010 2011 2012 82 83 90 81 85 87 85 77 77 78 1 Year 1 Year -7.47% -5.68% 2 Year 2 Year -0.37% +9.61% 5 YEAR MARKET ACTIVITY TRENDS 5yr JUN AVG = 80 3 MONTHS Average Days on Market 100 High A 83 90 Mar 2011 = 97 P 80 Low R 70 60 May 2010 = 73 M 79 50 A 40 Average DOM this Y -4.61% 30 20 month at 77, 10 below the 5 yr JUN J 77 0 U Jun 2008 Dec 2008 Jun 2009 Dec 2009 Jun 2010 Dec 2010 Jun 2011 Dec 2011 average of 80 N -3.20% AVERAGE DOM OF CLOSED SALES & BEDROOMS DISTRIBUTION BY PRICE Distribution of Average Days on Market to Sale by Price Range % AVDOM 2 Beds 3 Beds 4 Beds 5 Beds+ $25,000 and less 147 3.95% 67.2 71.5 57.8 80.7 119.0 $25,001 $75,000 635 17.05% 81.7 80.7 83.1 80.7 34.7 $75,001 $100,000 440 11.81% 76.3 80.7 69.8 101.5 0.0 $100,001 Contact an experienced REALTOR Ready to Buy or Sell Real Estate? $150,000 972 26.09% 70.0 85.7 64.2 81.0 57.8 $150,001 $200,000 647 17.37% 81.4 108.1 76.6 80.1 56.1 $200,001 $275,000 438 11.76% 72.4 79.4 66.7 73.6 105.0 $275,001 and up 446 11.97% 86.6 110.9 74.0 86.4 94.2 Average Closed DOM: 76.9 85.5 71.2 81.7 85.7 Total Closed Units: 3,725 735 2027 861 102 Total Closed Volume: 600,497,742 81.68M 275.75M 198.13M 44.94M Reports produced and compiled by RE STATS Inc. Information is deemed reliable but not guaranteed. Does not reflect all market activity. pp. 6 Steve Reese 405-848-9944 steve@oklahomarealtors.com
  • 8. Monthly Inventory Analysis Data from the The Oklahoma Association of REALTORS® June 2012 Closed Sales as of Jul 11, 2012 Average List Price at Closing Report Produced on: Jul 13, 2012 Area Delimited by Entire OK State MLS - Single-Family Property Type JUNE YEAR TO DATE (YTD) 2008 2009 2010 2011 2012 2008 2009 2010 2011 2012 166,728 157,648 164,670 153,685 161,298 151,771 158,386 159,882 147,645 149,258 1 Year 1 Year +3.37% +2.58% 2 Year 2 Year +4.28% +5.62% 5 YEAR MARKET ACTIVITY TRENDS 5yr JUN AVG = 162K 3 MONTHS Average List Price 200,000 High A 158,421 Jun 2012 = 166,728 P Low R Nov 2008 = 135,798 M 164,784 100,000 A Average LPrice this Y 4.02% month at 166,728, above the 5 yr JUN J 166,728 U 0 Jun 2008 Dec 2008 Jun 2009 Dec 2009 Jun 2010 Dec 2010 Jun 2011 Dec 2011 average of 162,193 N 1.18% AVERAGE LIST PRICE OF CLOSED SALES & BEDROOMS DISTRIBUTION BY PRICE Distribution of Average List Price at Closing by Price Range % AVL$ 2 Beds 3 Beds 4 Beds 5 Beds+ $25,000 and less 129 3.46% 16,848 18,895 19,780 18,538 24,900 $25,001 $75,000 611 16.40% 52,139 52,934 56,085 52,854 41,236 $75,001 $100,000 444 11.92% 88,761 92,007 91,178 91,391 0 $100,001 Contact an experienced REALTOR Ready to Buy or Sell Real Estate? $150,000 966 25.93% 127,235 128,017 128,898 133,789 140,500 $150,001 $200,000 668 17.93% 175,374 177,808 175,993 180,207 181,579 $200,001 $275,000 428 11.49% 236,003 241,531 237,978 243,383 246,345 $275,001 and up 479 12.86% 431,215 375,313 408,533 412,154 645,208 Average List Price: $166,728 $116,049 $139,988 $237,093 $469,335 Total Closed Units: 3,725 735 2027 861 102 Total List Volume: 621,060,087 85.30M 283.76M 204.14M 47.87M Reports produced and compiled by RE STATS Inc. Information is deemed reliable but not guaranteed. Does not reflect all market activity. pp. 7 Steve Reese 405-848-9944 steve@oklahomarealtors.com
  • 9. Monthly Inventory Analysis Data from the The Oklahoma Association of REALTORS® June 2012 Closed Sales as of Jul 11, 2012 Average Sold Price at Closing Report Produced on: Jul 13, 2012 Area Delimited by Entire OK State MLS - Single-Family Property Type JUNE YEAR TO DATE (YTD) 2008 2009 2010 2011 2012 2008 2009 2010 2011 2012 159,484 161,207 152,069 147,091 147,521 154,416 155,373 144,051 153,063 142,390 1 Year 1 Year +3.75% +3.08% 2 Year 2 Year +4.40% +5.57% 5 YEAR MARKET ACTIVITY TRENDS 5yr JUN AVG = 157K 3 MONTHS Average Sold Price 200,000 High A 153,191 Jun 2012 = 161,207 P Low R Nov 2008 = 131,055 M 159,490 100,000 A Average SPrice this Y 4.11% month at 161,207, above the 5 yr JUN J 161,207 U 0 Jun 2008 Dec 2008 Jun 2009 Dec 2009 Jun 2010 Dec 2010 Jun 2011 Dec 2011 average of 156,709 N 1.08% AVERAGE SOLD PRICE OF CLOSED SALES & BEDROOMS DISTRIBUTION BY PRICE Distribution of Average Sold Price at Closing by Price Range % AVS$ 2 Beds 3 Beds 4 Beds 5 Beds+ $25,000 and less 147 3.95% 16,911 16,268 18,055 15,716 12,500 $25,001 $75,000 635 17.05% 51,536 48,981 53,445 49,426 39,186 $75,001 $100,000 440 11.81% 88,032 87,197 88,138 89,628 0 $100,001 Contact an experienced REALTOR Ready to Buy or Sell Real Estate? $150,000 972 26.09% 125,794 123,821 125,636 128,943 132,688 $150,001 $200,000 647 17.37% 173,548 172,539 172,435 176,305 173,181 $200,001 $275,000 438 11.76% 235,367 235,036 231,821 238,940 231,603 $275,001 and up 446 11.97% 423,552 359,565 394,390 397,601 605,108 Average Closed Price: $161,207 $111,124 $136,041 $230,111 $440,594 Total Closed Units: 3,725 735 2027 861 102 Total Closed Volume: 600,497,742 81.68M 275.75M 198.13M 44.94M Reports produced and compiled by RE STATS Inc. Information is deemed reliable but not guaranteed. Does not reflect all market activity. pp. 8 Steve Reese 405-848-9944 steve@oklahomarealtors.com
  • 10. Monthly Inventory Analysis Data from the The Oklahoma Association of REALTORS® June 2012 Closed Sales as of Jul 11, 2012 Average Percent of List Price to Selling Price Report Produced on: Jul 13, 2012 Area Delimited by Entire OK State MLS - Single-Family Property Type JUNE YEAR TO DATE (YTD) 2008 2009 2010 2011 2012 2008 2009 2010 2011 2012 97.08% 97.13% 96.80% 96.79% 96.62% 96.48% 96.30% 96.08% 96.15% 95.76% 1 Year 1 Year +1.02% +0.56% 2 Year 2 Year +0.52% -0.19% 5 YEAR MARKET ACTIVITY TRENDS 5yr JUN AVG=96.75% 3 MONTHS Average List/Sell Price 98 High A 96.70% May 2008 = 97.13% P Low R 97 Jan 2011 = 95.15% M 96.61% A 96 Average List/Sell this Y -0.10% month at 97.13%, above the 5 yr JUN J 97.13% U 95 Jun 2008 Dec 2008 Jun 2009 Dec 2009 Jun 2010 Dec 2010 Jun 2011 Dec 2011 average of 96.75% N 0.54% AVERAGE L/S% OF CLOSED SALES & BEDROOMS DISTRIBUTION BY PRICE Distribution of $avgmed L/S % by Price Range % AVL/S% 2 Beds 3 Beds 4 Beds 5 Beds+ $25,000 and less 147 3.95% 92.79% 92.13% 95.17% 89.08% 50.20% $25,001 $75,000 635 17.05% 96.92% 93.43% 99.17% 95.05% 92.94% $75,001 $100,000 440 11.81% 96.73% 95.57% 96.98% 98.30% 0.00% $100,001 Contact an experienced REALTOR Ready to Buy or Sell Real Estate? $150,000 972 26.09% 97.44% 96.79% 97.78% 96.58% 94.02% $150,001 $200,000 647 17.37% 97.86% 97.20% 98.07% 97.95% 95.50% $200,001 $275,000 438 11.76% 97.80% 97.55% 97.56% 98.23% 95.53% $275,001 and up 446 11.97% 96.85% 96.42% 97.10% 97.09% 95.73% Average List/Sell Ratio: 97.10% 95.28% 97.85% 97.27% 95.00% Total Closed Units: 3,725 735 2027 861 102 Total Closed Volume: 600,497,742 81.68M 275.75M 198.13M 44.94M Reports produced and compiled by RE STATS Inc. Information is deemed reliable but not guaranteed. Does not reflect all market activity. pp. 9 Steve Reese 405-848-9944 steve@oklahomarealtors.com
  • 11. Monthly Inventory Analysis Data from the The Oklahoma Association of REALTORS® June 2012 Inventory as of Jul 11, 2012 Market Summary Report Produced on: Jul 13, 2012 Area Delimited by Entire OK State MLS - Single-Family Property Type Inventory Inventory Market Activity Market Activity New Listings Closed Sales 5,980 = 20.94% 3,725 = 11.55% Start Inventory Pending Sales 22,576 3,814 = 11.82% Total Inventory Other Off Market Units 2,326 = 7.21% 28,556 Volume Active Inventory $5,586,923,382 22,400 = 69.43% Absorption: Last 12 months, an Average of 3,101 Sales/Month JUNE Year To Date Active Inventory as of June 30, 2012 = 22,400 2011 2012 +/-% 2011 2012 +/-% Closed Sales 3,452 3,725 7.91% 16,596 19,132 15.28% Pending Sales 3,392 3,814 12.44% 18,201 21,933 20.50% New Listings 6,618 5,980 -9.64% 36,223 37,415 3.29% Average List Price 161,298 166,728 3.37% 153,685 157,648 2.58% Average Sale Price 155,373 161,207 3.75% 147,521 152,069 3.08% Average Percent of List Price to Selling Price 96.15% 97.13% 1.02% 95.76% 96.30% 0.56% Average Days on Market to Sale 83.05 76.85 -7.47% 90.30 85.18 -5.68% Monthly Inventory 26,280 22,400 -14.76% 26,280 22,400 -14.76% Months Supply of Inventory 9.90 7.22 -27.04% 9.90 7.22 -27.04% 2011 2011 JUNE MARKET 2012 AVERAGE PRICES 2012 New Listings Pending Listings List Price Sale Price 6,618 5,980 166,728 161,298 161,207 3,392 3,814 155,373 -9.64% +12.44% +3.37% +3.75% 2011 2011 INVENTORY 2012 AVERAGE L/S% & DOM 2012 Active Inventory Monthly Supply of Inventory % of List to Sale Price Days on Market to Sale 26,280 9.90 97.13% 83.05 22,400 7.22 96.15% 76.85 -14.76% -27.04% +1.02% -7.47% Reports produced and compiled by RE STATS Inc. Information is deemed reliable but not guaranteed. Does not reflect all market activity. pp. 10 Steve Reese 405-848-9944 steve@oklahomarealtors.com