SlideShare uma empresa Scribd logo
1 de 11
Baixar para ler offline
July 2012
                                   Area Delimited by Entire OK State MLS -
                                        Single-Family Property Type


Absorption: Last 12 months, an Average of 3,140 Sales/Month                                    JULY                              Market Activity
Active Inventory as of July 31, 2012 = 22,362                                       2011          2012        +/-%
Closed Listings                                                                     3,309        3,778       14.17%
Pending Listings                                                                    3,283        4,093       24.67%
New Listings                                                                        6,372        6,243       -2.02%
Average List Price                                                                163,623      165,401        1.09%
Average Sale Price                                                                157,657      159,449        1.14%          Closed (11.45%)
Average Percent of List Price to Selling Price                                    96.36%       96.76%         0.41%          Pending (12.41%)
Average Days on Market to Sale                                                      84.04        77.44       -7.86%          Other OffMarket (8.35%)
End of Month Inventory                                                             26,589       22,362      -15.90%          Active (67.79%)
Months Supply of Inventory                                                           9.83         7.12      -27.57%

                                                                                                                        Report Produced on: Aug 13, 2012

Monthly Inventory Analysis
 Data from the The Oklahoma Association of REALTORS®


                          Analysis Wrap-Up                                                                What's in this Issue

 Months Supply of Inventory (MSI) Decreases                                        Closed Listings                                                      1
 The total housing inventory at the end of July 2012 decreased                     Pending Listings                                                     2
 15.90% to 22,362 existing homes available for sale. Over the                      New Listings                                                         3
 last 12 months this area has had an average of 3,140 closed                       Inventory                                                            4
 sales per month. This represents an unsold inventory index of
                                                                                   Months Supply of Inventory                                           5
 7.12 MSI for this period.
                                                                                   Average Days on Market to Sale                                       6
 Average Sale Prices Going Up
                                                                                   Average List Price at Closing                                        7
 According to the preliminary trends, this market area has                         Average Sale Price at Closing                                        8
 experienced some upward momentum with the increase of
 Average Price this month. Prices went up 1.14% in July 2012                       Average Percent of List Price to Selling Price                       9
 to $159,449 versus the previous year at $157,657.                                 Market Summary                                                      10
 Average Days on Market Shortens                                                                          Real Estate is Local
 The average number of 77.44 days that homes spent on the
 market before selling decreased by 6.60 days or 7.86% in July                     Consumers Should Consult with a REALTOR®
 2012 compared to last year’s same month at 84.04 DOM.                             Buying or selling real estate, for a majority of consumers, is
 Sales Success for July 2012 is Positive                                           one of the most important decisions they will make. Choosing a
                                                                                   real estate professional continues to be a vital part of this
 Overall, with Average Prices going up and Days on Market                          process.
 decreasing, the Listed versus Closed Ratio finished strong this
 month.                                                                            Identify a Professional to Manage the Procedure
 There were 6,243 New Listings in July 2012, down 2.02% from                       REALTORS® are well-informed about critical factors that affect
 last year at 6,372. Furthermore, there were 3,778 Closed                          your specific market area - such as changes in market
 Listings this month versus last year at 3,309, a 14.17%                           conditions, consumer attitudes and interest rates.
 increase.
                                                                                   Are You Ready to Buy or Sell Real Estate?
 Closed versus Listed trends yielded a 60.5% ratio, up from last                   For more information, contact:
 year’s July 2012 at 51.9%, a 16.53% upswing. This will
 certainly create pressure on a decreasing Month’s Supply of                         Steve Reese - Vice President, Marketing
 Inventory (MSI) in the following months to come.                                    405-848-9944
                                                                                     steve@oklahomarealtors.com
                                                                                     Or visit: www.OklahomaRealtors.com

Reports produced and compiled by RE STATS Inc. Information is deemed reliable but not guaranteed. Does not reflect all market activity.
Monthly Inventory Analysis
                                                          Data from the The Oklahoma Association of
                                                          REALTORS®

                                                                               July 2012
                                                          Closed Sales as of Aug 12, 2012

Closed Listings                                                                                                                       Report Produced on: Aug 13, 2012
Area Delimited by Entire OK State MLS - Single-Family Property Type

                                                          JULY                                                                YEAR TO DATE (YTD)
              2008                          2009           2010           2011          2012                2008           2009          2010         2011            2012

            4,041                           3,947                                       3,778              23,629                                                     22,966
                                                                         3,309                                            21,180        20,971
                                                           2,627                                                                                     19,868
                                                                                       1 Year                                                                      1 Year
                                                                                      +14.17%                                                                     +15.59%
                                                                                       2 Year                                                                      2 Year
                                                                                      +43.81%                                                                     +9.51%


                                                           5 YEAR MARKET ACTIVITY TRENDS                                               5yr JUL AVG = 3,540     3 MONTHS

                                          5,000                                                                                        High                  M 3,853
                                                                                                                                       Jul 2008 = 4,041      A
                                          4,000
                                                                                                                                       Low                   Y
                                          3,000                                                                                        Jan 2010 = 1,691      J 3,768
                                                                                                                                                             U
   Closed Listings


                                          2,000                                                                                        Closed Listings
                                                                                                                                                     this    N -2.21%
                                          1,000                                                                                        month at 3,778,
                                                                                                                                       above the 5 yr JUL    J 3,778
                                             0
                                                                                                                                                             U
                                                   Jun 2008 Dec 2008 Jun 2009 Dec 2009 Jun 2010 Dec 2010 Jun 2011 Dec 2011 Jun 2012    average of 3,540      L 0.27%


                                                                   CLOSED LISTINGS & BEDROOMS DISTRIBUTION BY PRICE
                                             Distribution of Closed Listings by Price Range                      %       AVDOM          2 Beds   3 Beds      4 Beds    5 Beds+

                                        $25,000
                                        and less           124                                                 3.28%         70.2          59        59          5             1

                                        $25,001
                                        $75,000            675                                                17.87%         84.8         203      425          40             7

                                        $75,001
                                        $100,000           404                                                10.69%         79.7          90      284          28             2

                                        $100,001
    Contact an experienced REALTOR
    Ready to Buy or Sell Real Estate?


                                        $150,000           989                                                26.18%         71.3         173      708         101             7

                                        $150,001
                                        $200,000           710                                                18.79%         74.7          99      393         205           13

                                        $200,001
                                        $275,000           466                                                12.33%         74.7          56      174         216           20

                                        $275,001
                                         and up            410                                                10.85%         88.1          30        90        230           60

                                        Total Closed Units:              3,778                                               77.4          710     2133      825      110
                                        Total Closed Volume:       602,398,295                                                          81.80M 278.01M 200.66M     41.93M
                                        Average Closed Price:        $159,449                                                         $115,215 $130,337 $243,226 $381,142

Reports produced and compiled by RE STATS Inc. Information is deemed reliable but not guaranteed. Does not reflect all market activity.                                   pp. 1

Steve Reese                                                                                           405-848-9944                  steve@oklahomarealtors.com
Monthly Inventory Analysis
                                                          Data from the The Oklahoma Association of
                                                          REALTORS®

                                                                               July 2012
                                                          Pending Listings as of Aug 12, 2012

Pending Listings                                                                                                                      Report Produced on: Aug 13, 2012
Area Delimited by Entire OK State MLS - Single-Family Property Type

                                                          JULY                                                                YEAR TO DATE (YTD)
              2008                           2009          2010           2011          2012                2008           2009          2010          2011            2012

                                                                                        4,093              25,158                                                      25,767
            3,804                           3,556                        3,283                                            23,015
                                                           2,825                                                                        21,927        21,412
                                                                                       1 Year                                                                       1 Year
                                                                                      +24.67%                                                                      +20.34%
                                                                                       2 Year                                                                       2 Year
                                                                                      +44.88%                                                                      +17.51%


                                                           5 YEAR MARKET ACTIVITY TRENDS                                               5yr JUL AVG = 3,512      3 MONTHS

                                          5,000                                                                                        High                   M 3,880
                                                                                                                                       Apr 2010 = 4,806       A
                                          4,000
                                                                                                                                       Low                    Y
                                          3,000                                                                                        Dec 2009 = 2,007       J 3,693
                                                                                                                                                              U
   Pending Listings


                                          2,000                                                                                        Pending Listingsthis   N -4.82%
                                          1,000                                                                                        month at 4,093,
                                                                                                                                       above the 5 yr JUL     J 4,093
                                              0
                                                                                                                                                              U
                                                   Jun 2008 Dec 2008 Jun 2009 Dec 2009 Jun 2010 Dec 2010 Jun 2011 Dec 2011 Jun 2012    average of 3,512       L 10.83%


                                                                   PENDING LISTINGS & BEDROOMS DISTRIBUTION BY PRICE
                                             Distribution of Pending Listings by Price Range                     %       AVDOM          2 Beds    3 Beds      4 Beds    5 Beds+

                                        $50,000
                                        and less           387                                                 9.46%         75.3         161       196          25             5

                                        $50,001
                                        $75,000            360                                                 8.80%         87.4         113       216          26             5

                                        $75,001
                                        $100,000           440                                                10.75%         78.2         107       289          40             4

                                        $100,001
    Contact an experienced REALTOR
    Ready to Buy or Sell Real Estate?


                                        $150,000         1,067                                                26.07%         71.4         171       769         119             8

                                        $150,001
                                        $200,000           797                                                19.47%         75.7         104       454         232             7

                                        $200,001
                                        $275,000           538                                                13.14%         68.3          56       202         258           22

                                        $275,001
                                         and up            504                                                12.31%         83.8          40       112         281           71

                                        Total Pending Units:             4,093                                               81.8          752     2238      981      122
                                        Total Pending Volume:      686,863,145                                                          89.59M 311.85M 241.45M     43.97M
                                        Average Listing Price:       $174,389                                                         $119,134 $139,343 $246,126 $360,447

Reports produced and compiled by RE STATS Inc. Information is deemed reliable but not guaranteed. Does not reflect all market activity.                                    pp. 2

Steve Reese                                                                                           405-848-9944                  steve@oklahomarealtors.com
Monthly Inventory Analysis
                                                         Data from the The Oklahoma Association of
                                                         REALTORS®

                                                                              July 2012
                                                         New Listings as of Aug 12, 2012

New Listings                                                                                                                         Report Produced on: Aug 13, 2012
Area Delimited by Entire OK State MLS - Single-Family Property Type

                                                         JULY                                                                YEAR TO DATE (YTD)
             2008                           2009          2010             2011         2012               2008           2009          2010        2011            2012

           6,531                                                                                          44,239                                                    43,691
                                                                        6,372                                                          42,291      42,272
                                                                                       6,243
                                           6,009          6,116                                                          39,579
                                                                                       1 Year                                                                       1 Year
                                                                                       -2.02%                                                                       +3.36%
                                                                                       2 Year                                                                       2 Year
                                                                                       +2.08%                                                                       +3.31%


                                                          5 YEAR MARKET ACTIVITY TRENDS                                              5yr JUL AVG = 6,254     3 MONTHS

                                         8,000                                                                                       High                  M 6,620
                                         7,000                                                                                       Apr 2010 = 7,586      A
                                         6,000                                                                                       Low                   Y
                                         5,000                                                                                       Dec 2008 = 3,500      J 6,011
                                         4,000                                                                                                             U
   New Listings


                                         3,000                                                                                       New Listings this     N -9.20%
                                         2,000                                                                                       month at 6,243,
                                         1,000                                                                                       below the 5 yr JUL    J 6,243
                                             0
                                                                                                                                                           U
                                                  Jun 2008 Dec 2008 Jun 2009 Dec 2009 Jun 2010 Dec 2010 Jun 2011 Dec 2011 Jun 2012   average of 6,254      L 3.86%


                                                                     NEW LISTINGS & BEDROOMS DISTRIBUTION BY PRICE
                                            Distribution of New Listings by Price Range                         %                      2 Beds   3 Beds     4 Beds    5 Beds+

                                       $50,000
                                       and less           466                                                 7.46%                     236       195         30             5

                                       $50,001
                                       $75,000            526                                                 8.43%                     187       298         37             4

                                       $75,001
                                       $100,000           747                                                11.97%                     203       482         58             4

                                       $100,001
   Contact an experienced REALTOR
   Ready to Buy or Sell Real Estate?


                                       $150,000         1,628                                                26.08%                     303     1,113        198           14

                                       $150,001
                                       $225,000         1,461                                                23.40%                     242       800        393           26

                                       $225,001
                                       $325,000           761                                                12.19%                      74       257        389           41

                                       $325,001
                                        and up            654                                                10.48%                      63       155        317        119

                                       Total New Listed Units:                            6,243                                          1308     3300     1422      213
                                       Total New Listed Volume:                   1,162,948,976                                       173.41M 501.64M 378.57M 109.33M
                                       Average New Listed Listing Price:              $247,058                                       $132,577 $152,012 $266,225 $513,277

Reports produced and compiled by RE STATS Inc. Information is deemed reliable but not guaranteed. Does not reflect all market activity.                                 pp. 3

Steve Reese                                                                                          405-848-9944                steve@oklahomarealtors.com
Monthly Inventory Analysis
                                                          Data from the The Oklahoma Association of
                                                          REALTORS®

                                                                                  July 2012
                                                          Active Inventory as of Aug 12, 2012

Active Inventory                                                                                                                       Report Produced on: Aug 13, 2012
Area Delimited by Entire OK State MLS - Single-Family Property Type

                                                     END OF JULY                                                               ACTIVE DURING JULY
              2008                           2009          2010           2011           2012                2008           2009          2010        2011              2012

                                                                         26,581                                                                      32,455
       24,028                                             24,635                                            30,215                       29,798
                                                                                       22,362                                                                          29,208
                                            21,761                                                                        27,548
                                                                                        1 Year                                                                          1 Year
                                                                                       -15.87%                                                                         -10.00%
                                                                                        2 Year                                                                          2 Year
                                                                                        -9.23%                                                                          -1.98%


                                                            5 YEAR MARKET ACTIVITY TRENDS                                              5yr JUL AVG = 23,873     3 MONTHS
   Active Inventory


                                           30,000                                                                                      High                   M 22,896
                                                                                                                                       Jul 2011 = 26,581      A
                                                                                                                                       Low                    Y
                                           20,000
                                                                                                                                       Jan 2008 = 19,323      J 22,975
                                                                                                                                                              U
                                           10,000
                                                                                                                                       Inventory this         N 0.35%
                                                                                                                                       month at 22,362,
                                                                                                                                       below the 5 yr JUL     J 22,362
                                               0
                                                                                                                                                              U
                                                    Jun 2008 Dec 2008 Jun 2009 Dec 2009 Jun 2010 Dec 2010 Jun 2011 Dec 2011 Jun 2012   average of 23,873      L -2.67%


                                                                        INVENTORY & BEDROOMS DISTRIBUTION BY PRICE
                                             Distribution of Inventory by Price Range                             %       AVDOM          2 Beds   3 Beds      4 Beds     5 Beds+

                                        $50,000
                                        and less         1,814                                                  8.11%       124.7         919       767         111            17

                                         $50,001
                                         $75,000         2,241                                                10.02%        120.2         838     1,229         149            25

                                        $75,001
                                        $100,000         2,709                                                12.11%        108.8         677     1,746         264            22

                                        $100,001
    Contact an experienced REALTOR
    Ready to Buy or Sell Real Estate?


                                        $175,000         7,152                                                31.98%         95.7       1,316     4,590       1,157            89

                                        $175,001
                                        $225,000         2,753                                                12.31%         97.0         453     1,290         927            83

                                        $225,001
                                        $350,000         3,348                                                14.97%        105.6         444     1,174       1,494        236

                                        $350,001
                                         and up          2,345                                                10.49%        118.1         233       486       1,107        519

                                        Total Active Inventory by Units:                         22,362                     106.1         4,880   11,282    5,209     991
                                        Total Active Inventory by Volume:                 4,464,604,913                                 668.30M    1.76B    1.48B 550.50M
                                        Average Active Inventory Listing Price:               $199,651                                 $136,947 $156,249 $284,700 $555,499

Reports produced and compiled by RE STATS Inc. Information is deemed reliable but not guaranteed. Does not reflect all market activity.                                     pp. 4

Steve Reese                                                                                           405-848-9944                  steve@oklahomarealtors.com
Monthly Inventory Analysis
                                                         Data from the The Oklahoma Association of
                                                         REALTORS®

                                                                             July 2012
                                                         Active Inventory as of Aug 12, 2012

Months Supply of Inventory                                                                                                        Report Produced on: Aug 13, 2012
Area Delimited by Entire OK State MLS - Single-Family Property Type

                                                    MSI FOR JULY                                                      INDICATORS FOR JULY 2012
             2008                            2009         2010          2011             2012          Inventory      Closed      Absorption        MSI            MSI %

                                                                         9.8                                          37,682
                                                                                                                                                    7.1        14.042%
                                                           7.9                                          22,362
                    7.1                      7.1                                         7.1
                                                                                      1 Year                                         3,140
                                                                                                         End of       Closed        Average       Months        Percent
                                                                                     -27.54%             Month         Last        Closed per     Supply        Months
                                                                                      2 Year             Active         12         Month over        of        Supply of
                                                                                     -10.39%           Inventory      Months       12 Months     Inventory     Inventory


                                                          5 YEAR MARKET ACTIVITY TRENDS                                             5yr JUL AVG = 7.8       3 MONTHS

                                        10                                                                                         High                   M 7.4
                                         9                                                                                         Jun 2011 = 9.9         A
                                         8
                                                                                                                                   Low                    Y
                                         7
                                         6                                                                                         Jan 2008 = 5.3         J 7.4
                                         5                                                                                                                U
   Months Supply


                                         4                                                                                         Months Supply this     N -0.53%
                                         3
                                         2                                                                                         month at 7.1,
                                         1                                                                                         below the 5 yr JUL     J 7.1
                                         0
                                                                                                                                                          U
                                               Jun 2008 Dec 2008 Jun 2009 Dec 2009 Jun 2010 Dec 2010 Jun 2011 Dec 2011 Jun 2012    average of 7.8         L -3.88%


                                                                  MONTHS SUPPLY & BEDROOMS DISTRIBUTION BY PRICE
                                             Distribution of Active Inventory by Price Range and MSI          %         MSI         2 Beds   3 Beds       4 Beds    5 Beds+

                                       $50,000
                                       and less         1,814                                               8.11%         4.1         5.1        3.3         3.5       4.5

                                       $50,001
                                       $80,000          2,843                                              12.71%         7.2         9.0        6.5         6.7      11.1

                                       $80,001
                                       $110,000         2,873                                              12.85%         6.8         7.6        6.4         7.3       7.4

                                       $110,001
   Contact an experienced REALTOR
   Ready to Buy or Sell Real Estate?


                                       $170,000         6,059                                              27.10%         6.4         7.5        6.2         6.3       6.7

                                       $170,001
                                       $240,000         3,683                                              16.47%         7.5         9.7        7.5         6.6       9.3

                                       $240,001
                                       $360,000         2,836                                              12.68%         9.6        13.4       10.6         8.2      10.5

                                       $360,001
                                        and up          2,254                                              10.08%        15.4        26.3       16.0       13.4       17.4


                                       MSI:                                        7.1                                                 7.8   6.4             7.6      11.8
                                       Total Active Inventory:                 22,362                                               4,880 11,282          5,209        991

Reports produced and compiled by RE STATS Inc. Information is deemed reliable but not guaranteed. Does not reflect all market activity.                                pp. 5

Steve Reese                                                                                        405-848-9944                 steve@oklahomarealtors.com
Monthly Inventory Analysis
                                                          Data from the The Oklahoma Association of
                                                          REALTORS®

                                                                               July 2012
                                                          Closed Sales as of Aug 12, 2012

Average Days on Market to Sale                                                                                                     Report Produced on: Aug 13, 2012
Area Delimited by Entire OK State MLS - Single-Family Property Type

                                                          JULY                                                             YEAR TO DATE (YTD)
              2008                            2009         2010          2011          2012               2008          2009          2010         2011               2012

                                                                          84                                                                           89
                                                                                                            84            85                                           84
                       78                                   79                           77
                                               77                                                                                      78
                                                                                      1 Year                                                                         1 Year
                                                                                      -7.86%                                                                         -5.94%
                                                                                      2 Year                                                                         2 Year
                                                                                      -1.60%                                                                         +7.90%


                                                           5 YEAR MARKET ACTIVITY TRENDS                                            5yr JUL AVG = 79          3 MONTHS
   Average Days on Market


                                        100                                                                                        High                      M 79
                                         90                                                                                        Mar 2011 = 97             A
                                         80
                                                                                                                                   Low                       Y
                                         70
                                         60                                                                                        May 2010 = 73             J 78
                                         50                                                                                                                  U
                                         40                                                                                        Average DOM this          N -2.26%
                                         30
                                         20                                                                                        month at 77,
                                         10                                                                                        below the 5 yr JUL        J 77
                                          0
                                                                                                                                                             U
                                                Jun 2008 Dec 2008 Jun 2009 Dec 2009 Jun 2010 Dec 2010 Jun 2011 Dec 2011 Jun 2012   average of 79             L -0.13%


                                                       AVERAGE DOM OF CLOSED SALES & BEDROOMS DISTRIBUTION BY PRICE
                                              Distribution of Average Days on Market to Sale by Price Range %         AVDOM          2 Beds   3 Beds        4 Beds     5 Beds+

                                        $25,000
                                        and less           124                                               3.28%        70.2       79.6      61.2          44.2      176.0

                                        $25,001
                                        $75,000            675                                              17.87%        84.8       93.0      81.0          88.8        53.6

                                        $75,001
                                        $100,000           404                                              10.69%        79.7       89.8      77.4          60.5      211.5

                                        $100,001
    Contact an experienced REALTOR
    Ready to Buy or Sell Real Estate?


                                        $150,000           989                                              26.18%        71.3       83.3      67.6          74.9        93.4

                                        $150,001
                                        $200,000           710                                              18.79%        74.7      100.7      70.4          68.9        95.9

                                        $200,001
                                        $275,000           466                                              12.33%        74.7       74.4      67.7          80.6        73.3

                                        $275,001
                                         and up            410                                              10.85%        88.1      149.6      72.4          89.2        76.8

                                        Average Closed DOM:              77.4                                                        91.1        72.1         78.9       81.3
                                        Total Closed Units:             3,778                                                          710       2133           825        110
                                        Total Closed Volume:      602,398,295                                                       81.80M    278.01M       200.66M     41.93M

Reports produced and compiled by RE STATS Inc. Information is deemed reliable but not guaranteed. Does not reflect all market activity.                                     pp. 6

Steve Reese                                                                                         405-848-9944               steve@oklahomarealtors.com
Monthly Inventory Analysis
                                                          Data from the The Oklahoma Association of
                                                          REALTORS®

                                                                               July 2012
                                                          Closed Sales as of Aug 12, 2012

Average List Price at Closing                                                                                                        Report Produced on: Aug 13, 2012
Area Delimited by Entire OK State MLS - Single-Family Property Type

                                                              JULY                                                           YEAR TO DATE (YTD)
              2008                           2009             2010        2011          2012                2008          2009          2010        2011           2012

                                                                         163,623      165,401                                                                  158,935
                                                          163,209                                                                                  155,300
   159,608                                                                                                153,088                     150,938
                                           156,493                                                                      149,154
                                                                                       1 Year                                                                      1 Year
                                                                                       +1.09%                                                                      +2.34%
                                                                                       2 Year                                                                      2 Year
                                                                                       +1.34%                                                                      +5.30%


                                                              5 YEAR MARKET ACTIVITY TRENDS                                          5yr JUL AVG = 162K      3 MONTHS
   Average List Price


                                           200,000                                                                                   High                  M 164,795
                                                                                                                                     Jun 2012 = 166,799    A
                                                                                                                                     Low                   Y
                                                                                                                                     Nov 2008 = 135,800  J 166,799
                                           100,000                                                                                                       U
                                                                                                                                     Average LPrice this N 1.22%
                                                                                                                                     month at 165,401,
                                                                                                                                     above the 5 yr JUL J 165,401
                                                                                                                                                         U
                                                0
                                                      Jun 2008 Dec 2008Jun 2009 Dec 2009Jun 2010 Dec 2010Jun 2011 Dec 2011Jun 2012   average of 161,667 L -0.84%


                                                     AVERAGE LIST PRICE OF CLOSED SALES & BEDROOMS DISTRIBUTION BY PRICE
                                             Distribution of Average List Price at Closing by Price Range       %        AVL$          2 Beds   3 Beds    4 Beds    5 Beds+

                                        $25,000
                                        and less              122                                               3.23%     18,876      19,411    20,142    22,720      9,900

                                         $25,001
                                         $75,000              638                                             16.89%      52,238      54,867    53,953    54,488     49,079

                                        $75,001
                                        $100,000              401                                             10.61%      88,687      90,888    91,038    92,714     91,900

                                        $100,001
    Contact an experienced REALTOR
    Ready to Buy or Sell Real Estate?


                                        $150,000              966                                             25.57% 127,665         131,397 129,499 135,082 138,007

                                        $150,001
                                        $200,000              739                                             19.56% 173,583         175,295 174,692 182,655 176,554

                                        $200,001
                                        $275,000              475                                             12.57% 235,744         242,428 237,154 241,925 281,249

                                        $275,001
                                         and up               437                                             11.57% 435,033         374,491 386,727 433,126 597,787


                                        Average List Price:            $165,401                                                      $120,225 $134,263 $251,941 $411,733
                                        Total Closed Units:                3,778                                                          710     2133      825      110
                                        Total List Volume:           624,884,945                                                       85.36M 286.38M 207.85M     45.29M

Reports produced and compiled by RE STATS Inc. Information is deemed reliable but not guaranteed. Does not reflect all market activity.                                pp. 7

Steve Reese                                                                                          405-848-9944                steve@oklahomarealtors.com
Monthly Inventory Analysis
                                                          Data from the The Oklahoma Association of
                                                          REALTORS®

                                                                               July 2012
                                                          Closed Sales as of Aug 12, 2012

Average Sold Price at Closing                                                                                                        Report Produced on: Aug 13, 2012
Area Delimited by Entire OK State MLS - Single-Family Property Type

                                                           JULY                                                              YEAR TO DATE (YTD)
              2008                          2009            2010          2011          2012                2008          2009          2010        2011           2012

                                                                        157,657       159,449                                                                  153,293
   155,222                                                157,053                                                                                  149,169
                                                                                                          148,454
                                           150,804                                                                      143,823       145,619
                                                                                       1 Year                                                                      1 Year
                                                                                       +1.14%                                                                      +2.76%
                                                                                       2 Year                                                                      2 Year
                                                                                       +1.53%                                                                      +5.27%


                                                            5 YEAR MARKET ACTIVITY TRENDS                                            5yr JUL AVG = 156K      3 MONTHS
   Average Sold Price


                                           200,000                                                                                   High                  M 159,503
                                                                                                                                     Jun 2012 = 161,269    A
                                                                                                                                     Low                   Y
                                                                                                                                     Nov 2008 = 131,059  J 161,269
                                           100,000                                                                                                       U
                                                                                                                                     Average SPrice this N 1.11%
                                                                                                                                     month at 159,449,
                                                                                                                                     above the 5 yr JUL J 159,449
                                                                                                                                                         U
                                                0
                                                      Jun 2008 Dec 2008Jun 2009 Dec 2009Jun 2010 Dec 2010Jun 2011 Dec 2011Jun 2012   average of 156,037 L -1.13%


                                                     AVERAGE SOLD PRICE OF CLOSED SALES & BEDROOMS DISTRIBUTION BY PRICE
                                             Distribution of Average Sold Price at Closing by Price Range       %         AVS$         2 Beds   3 Beds    4 Beds    5 Beds+

                                        $25,000
                                        and less            124                                                 3.28%     17,379      16,994    17,716    19,825      8,000

                                        $25,001
                                        $75,000             675                                               17.87%      50,756      50,532    50,972    50,297     46,750

                                        $75,001
                                        $100,000            404                                               10.69%      87,998      87,142    88,205    88,714     87,000

                                        $100,001
    Contact an experienced REALTOR
    Ready to Buy or Sell Real Estate?


                                        $150,000            989                                               26.18% 127,013         127,478 126,291 130,656 135,971

                                        $150,001
                                        $200,000            710                                               18.79% 172,815         171,236 170,798 177,808 167,069

                                        $200,001
                                        $275,000            466                                               12.33% 233,813         233,054 230,357 235,640 246,279

                                        $275,001
                                         and up             410                                               10.85% 422,343         354,724 373,674 415,310 556,119


                                        Average Closed Price:        $159,449                                                        $115,215 $130,337 $243,226 $381,142
                                        Total Closed Units:              3,778                                                            710     2133      825      110
                                        Total Closed Volume:       602,398,295                                                         81.80M 278.01M 200.66M     41.93M

Reports produced and compiled by RE STATS Inc. Information is deemed reliable but not guaranteed. Does not reflect all market activity.                                pp. 8

Steve Reese                                                                                          405-848-9944                steve@oklahomarealtors.com
Monthly Inventory Analysis
                                                           Data from the The Oklahoma Association of
                                                           REALTORS®

                                                                               July 2012
                                                           Closed Sales as of Aug 12, 2012

Average Percent of List Price to Selling Price                                                                                      Report Produced on: Aug 13, 2012
Area Delimited by Entire OK State MLS - Single-Family Property Type

                                                           JULY                                                             YEAR TO DATE (YTD)
              2008                            2009          2010          2011          2012               2008          2009          2010         2011            2012

     97.06%                                                                                               96.84%
                                              96.65%                                  96.76%                                          96.44%                      96.34%
                                                                        96.36%                                          96.18%
                                                          96.13%                                                                                  95.86%
                                                                                      1 Year                                                                      1 Year
                                                                                       +0.41%                                                                     +0.51%
                                                                                      2 Year                                                                      2 Year
                                                                                       +0.65%                                                                     -0.10%


                                                            5 YEAR MARKET ACTIVITY TRENDS                                           5yr JUL AVG=96.59%      3 MONTHS
   Average List/Sell Price


                                         98                                                                                         High                   M 96.61%
                                                                                                                                    May 2008 = 97.13%      A
                                                                                                                                    Low                    Y
                                         97
                                                                                                                                    Jan 2011 = 95.15%      J 96.93%
                                                                                                                                                           U
                                         96
                                                                                                                                    Average List/Sell this N 0.33%
                                                                                                                                    month at 96.76%,
                                                                                                                                     above the 5 yr JUL J 96.76%
                                                                                                                                                           U
                                         95
                                                 Jun 2008 Dec 2008 Jun 2009 Dec 2009 Jun 2010 Dec 2010 Jun 2011 Dec 2011 Jun 2012   average of 96.59% L -0.18%


                                                        AVERAGE L/S% OF CLOSED SALES & BEDROOMS DISTRIBUTION BY PRICE
                                               Distribution of $avgmed L/S % by Price Range                     %      AVL/S%         2 Beds   3 Beds    4 Beds      5 Beds+

                                        $25,000
                                        and less            124                                               3.28% 89.98% 89.37% 90.56% 92.32% 80.81%

                                         $25,001
                                         $75,000            675                                              17.87% 95.23% 94.24% 95.93% 92.57% 96.10%

                                        $75,001
                                        $100,000            404                                              10.69% 97.40% 96.09% 97.90% 96.74% 94.53%

                                        $100,001
    Contact an experienced REALTOR
    Ready to Buy or Sell Real Estate?


                                        $150,000            989                                              26.18% 97.57% 97.22% 97.72% 96.99% 98.60%

                                        $150,001
                                        $200,000            710                                              18.79% 97.77% 97.79% 98.00% 97.48% 95.20%

                                        $200,001
                                        $275,000            466                                              12.33% 97.19% 96.86% 97.34% 97.62% 92.24%

                                        $275,001
                                         and up             410                                              10.85% 96.51% 95.07% 96.73% 96.79% 95.80%

                                        Average List/Sell Ratio:       96.80%                                                        95.53%     97.17%    96.97%     95.12%
                                        Total Closed Units:              3,778                                                           710      2133        825        110
                                        Total Closed Volume:       602,398,295                                                       81.80M    278.01M   200.66M     41.93M

Reports produced and compiled by RE STATS Inc. Information is deemed reliable but not guaranteed. Does not reflect all market activity.                                 pp. 9

Steve Reese                                                                                          405-848-9944               steve@oklahomarealtors.com
Monthly Inventory Analysis
                                  Data from the The Oklahoma Association of
                                  REALTORS®

                                                       July 2012
                                  Inventory as of Aug 12, 2012

Market Summary                                                                                                  Report Produced on: Aug 13, 2012
Area Delimited by Entire OK State MLS - Single-Family Property Type


                   Inventory                              Inventory                Market Activity                          Market Activity
                                                              New Listings                Closed Sales
                                                            6,243 = 21.37%               3,778 = 11.45%
                                                            Start Inventory               Pending Sales
                                                                22,974                   4,093 = 12.41%
                                                            Total Inventory
                                                                                        Other Off Market
                                                                Units                    2,754 = 8.35%
                                                               29,217
                                                               Volume                   Active Inventory
                                                           $5,693,709,827               22,362 = 67.79%


Absorption: Last 12 months, an Average of 3,140 Sales/Month                                    JULY                                Year To Date

Active Inventory as of July 31, 2012 = 22,362                                       2011          2012        +/-%         2011           2012        +/-%
Closed Sales                                                                        3,309        3,778       14.17%        19,868          22,966     15.59%
Pending Sales                                                                       3,283        4,093       24.67%        21,412          25,767     20.34%
New Listings                                                                        6,372        6,243       -2.02%        42,272          43,691      3.36%
Average List Price                                                                163,623      165,401        1.09%       155,300         158,935      2.34%
Average Sale Price                                                                157,657      159,449        1.14%       149,169         153,293      2.76%
Average Percent of List Price to Selling Price                                    96.36%       96.76%         0.41%       95.86%          96.34%       0.51%
Average Days on Market to Sale                                                      84.04        77.44       -7.86%         89.29           83.99     -5.94%
Monthly Inventory                                                                  26,589       22,362      -15.90%        26,589          22,362    -15.90%
Months Supply of Inventory                                                           9.83         7.12      -27.57%          9.83            7.12    -27.57%

                                                                         2011                                                                            2011
                             JULY MARKET                                 2012                              AVERAGE PRICES                                2012

      New Listings                                Pending Listings                          List Price                                Sale Price

     6,372          6,243                                                                          165,401
                                                                                    163,623
                                                                 4,093                                                                           159,449
                                                  3,283                                                                           157,657


                    -2.02%                                      +24.67%                             +1.09%                                          +1.14%

                                                                         2011                                                                            2011
                              INVENTORY                                  2012                          AVERAGE L/S% & DOM                                2012

      Active Inventory                  Monthly Supply of Inventory                % of List to Sale Price                   Days on Market to Sale

    26,589                                         9.83                                            96.76%                          84.04

                   22,362                                         7.12              96.36%                                                          77.44


                   -15.90%                                      -27.57%                             +0.41%                                          -7.86%

Reports produced and compiled by RE STATS Inc. Information is deemed reliable but not guaranteed. Does not reflect all market activity.                  pp. 10

Steve Reese                                                                     405-848-9944                 steve@oklahomarealtors.com

Mais conteúdo relacionado

Mais procurados

TREB Market Watch May 2012
TREB Market Watch May 2012TREB Market Watch May 2012
TREB Market Watch May 2012realestatesnatch
 
TravelClick Webinar: How To Develop Competitive Intelligence
TravelClick Webinar: How To Develop Competitive IntelligenceTravelClick Webinar: How To Develop Competitive Intelligence
TravelClick Webinar: How To Develop Competitive IntelligenceTravelClick
 
This Month in Real Estate for Canada - December 2011
This Month in Real Estate for Canada - December 2011This Month in Real Estate for Canada - December 2011
This Month in Real Estate for Canada - December 2011Keller Williams Careers
 
January 2013's Monthly Indicators report
January 2013's Monthly Indicators reportJanuary 2013's Monthly Indicators report
January 2013's Monthly Indicators reportUnit Realty Group
 
TREB Market Watch Report November 2012
TREB Market Watch Report November 2012TREB Market Watch Report November 2012
TREB Market Watch Report November 2012realestatesnatch
 
VietRees_Newsletter_56_Week1_Month11_Year08
VietRees_Newsletter_56_Week1_Month11_Year08VietRees_Newsletter_56_Week1_Month11_Year08
VietRees_Newsletter_56_Week1_Month11_Year08internationalvr
 
Metro Boston Multi-Family Housing Activity Report, December 2012
Metro Boston Multi-Family Housing Activity Report, December 2012Metro Boston Multi-Family Housing Activity Report, December 2012
Metro Boston Multi-Family Housing Activity Report, December 2012Unit Realty Group
 
The Nest Report Q1 2012
The Nest Report Q1 2012The Nest Report Q1 2012
The Nest Report Q1 2012Jeremy Hart
 

Mais procurados (15)

Toronto Area REALTORS Releases Market Watch for May 2012
Toronto Area REALTORS Releases Market Watch for May 2012Toronto Area REALTORS Releases Market Watch for May 2012
Toronto Area REALTORS Releases Market Watch for May 2012
 
TREB Market Watch May 2012
TREB Market Watch May 2012TREB Market Watch May 2012
TREB Market Watch May 2012
 
September 2012 Toronto Real Estate Market Watch
September 2012 Toronto Real Estate Market WatchSeptember 2012 Toronto Real Estate Market Watch
September 2012 Toronto Real Estate Market Watch
 
Market Watch August 2012
Market Watch August 2012Market Watch August 2012
Market Watch August 2012
 
TravelClick Webinar: How To Develop Competitive Intelligence
TravelClick Webinar: How To Develop Competitive IntelligenceTravelClick Webinar: How To Develop Competitive Intelligence
TravelClick Webinar: How To Develop Competitive Intelligence
 
Market Watch March 2012
Market Watch March 2012Market Watch March 2012
Market Watch March 2012
 
Market Watch December 2012
Market Watch December 2012Market Watch December 2012
Market Watch December 2012
 
This Month in Real Estate for Canada - December 2011
This Month in Real Estate for Canada - December 2011This Month in Real Estate for Canada - December 2011
This Month in Real Estate for Canada - December 2011
 
Toronto Real Estate Board Market Watch for October 2012
Toronto Real Estate Board Market Watch for October 2012Toronto Real Estate Board Market Watch for October 2012
Toronto Real Estate Board Market Watch for October 2012
 
January 2013's Monthly Indicators report
January 2013's Monthly Indicators reportJanuary 2013's Monthly Indicators report
January 2013's Monthly Indicators report
 
TREB Market Watch Report November 2012
TREB Market Watch Report November 2012TREB Market Watch Report November 2012
TREB Market Watch Report November 2012
 
November 2011 Market Watch
November 2011 Market WatchNovember 2011 Market Watch
November 2011 Market Watch
 
VietRees_Newsletter_56_Week1_Month11_Year08
VietRees_Newsletter_56_Week1_Month11_Year08VietRees_Newsletter_56_Week1_Month11_Year08
VietRees_Newsletter_56_Week1_Month11_Year08
 
Metro Boston Multi-Family Housing Activity Report, December 2012
Metro Boston Multi-Family Housing Activity Report, December 2012Metro Boston Multi-Family Housing Activity Report, December 2012
Metro Boston Multi-Family Housing Activity Report, December 2012
 
The Nest Report Q1 2012
The Nest Report Q1 2012The Nest Report Q1 2012
The Nest Report Q1 2012
 

Destaque (7)

Monizz
MonizzMonizz
Monizz
 
Monizz
MonizzMonizz
Monizz
 
August 2013 Housing Sales Statistics
August 2013 Housing Sales StatisticsAugust 2013 Housing Sales Statistics
August 2013 Housing Sales Statistics
 
2013 Legislative Summit
2013 Legislative Summit2013 Legislative Summit
2013 Legislative Summit
 
Oklahoma Economic Outlook 02-09-12
Oklahoma Economic Outlook 02-09-12Oklahoma Economic Outlook 02-09-12
Oklahoma Economic Outlook 02-09-12
 
NCCCA Invite Book
NCCCA Invite BookNCCCA Invite Book
NCCCA Invite Book
 
May 2013 Housing Sales Statistics
May 2013 Housing Sales StatisticsMay 2013 Housing Sales Statistics
May 2013 Housing Sales Statistics
 

Semelhante a July 2012 MLS Statistics

Metro Boston Monthly Indicators Report, October 2012
Metro Boston Monthly Indicators Report, October 2012 Metro Boston Monthly Indicators Report, October 2012
Metro Boston Monthly Indicators Report, October 2012 Unit Realty Group
 
Monthly Real Estate Indicators: Twin Cities Housing Market Info & Statistics
Monthly Real Estate Indicators: Twin Cities Housing Market Info & StatisticsMonthly Real Estate Indicators: Twin Cities Housing Market Info & Statistics
Monthly Real Estate Indicators: Twin Cities Housing Market Info & Statisticspattiann
 
Residential Sales Report - December 2011
Residential Sales Report - December 2011Residential Sales Report - December 2011
Residential Sales Report - December 2011Team Price Real Estate
 
Greater Boston Real Estate Market Data, September 2012
Greater Boston Real Estate Market Data, September 2012Greater Boston Real Estate Market Data, September 2012
Greater Boston Real Estate Market Data, September 2012Unit Realty Group
 
Georgia Home prices up 25.4% since last January!
Georgia Home prices up 25.4% since last January! Georgia Home prices up 25.4% since last January!
Georgia Home prices up 25.4% since last January! Sandra Watkins
 
Naea 09-13
Naea 09-13Naea 09-13
Naea 09-13Cate8364
 
Georgia Association of Realtors Stats for December 2013
Georgia Association of Realtors Stats for December 2013Georgia Association of Realtors Stats for December 2013
Georgia Association of Realtors Stats for December 2013Sandra Watkins
 
The Nest Report Q3 2012
The Nest Report Q3 2012The Nest Report Q3 2012
The Nest Report Q3 2012Jeremy Hart
 
Toronto Real Estate Market Update june 2012
Toronto Real Estate Market Update june 2012Toronto Real Estate Market Update june 2012
Toronto Real Estate Market Update june 2012jefftoleary
 
TREB Market Watch October 2012
TREB Market Watch October 2012TREB Market Watch October 2012
TREB Market Watch October 2012realestatesnatch
 
February 2013's Monthly Indicators report - Boston Real Estate Market Trends
February 2013's Monthly Indicators report - Boston Real Estate Market TrendsFebruary 2013's Monthly Indicators report - Boston Real Estate Market Trends
February 2013's Monthly Indicators report - Boston Real Estate Market TrendsUnit Realty Group
 
Market Watch: August 2012
Market Watch: August 2012Market Watch: August 2012
Market Watch: August 2012lauragolbeck
 
Jan 2013 sales meeting
Jan 2013 sales meetingJan 2013 sales meeting
Jan 2013 sales meetingahemmings
 
Market Watch - January 2013
Market Watch - January 2013Market Watch - January 2013
Market Watch - January 2013Cameron Thornton
 

Semelhante a July 2012 MLS Statistics (20)

Metro Boston Monthly Indicators Report, October 2012
Metro Boston Monthly Indicators Report, October 2012 Metro Boston Monthly Indicators Report, October 2012
Metro Boston Monthly Indicators Report, October 2012
 
Monthly Real Estate Indicators: Twin Cities Housing Market Info & Statistics
Monthly Real Estate Indicators: Twin Cities Housing Market Info & StatisticsMonthly Real Estate Indicators: Twin Cities Housing Market Info & Statistics
Monthly Real Estate Indicators: Twin Cities Housing Market Info & Statistics
 
Residential Sales Report - December 2011
Residential Sales Report - December 2011Residential Sales Report - December 2011
Residential Sales Report - December 2011
 
Greater Boston Real Estate Market Data, September 2012
Greater Boston Real Estate Market Data, September 2012Greater Boston Real Estate Market Data, September 2012
Greater Boston Real Estate Market Data, September 2012
 
Mw1209
Mw1209Mw1209
Mw1209
 
Georgia Home prices up 25.4% since last January!
Georgia Home prices up 25.4% since last January! Georgia Home prices up 25.4% since last January!
Georgia Home prices up 25.4% since last January!
 
Naea 09-13
Naea 09-13Naea 09-13
Naea 09-13
 
Market Data, December 2012
Market Data, December 2012Market Data, December 2012
Market Data, December 2012
 
Georgia Association of Realtors Stats for December 2013
Georgia Association of Realtors Stats for December 2013Georgia Association of Realtors Stats for December 2013
Georgia Association of Realtors Stats for December 2013
 
The Nest Report Q3 2012
The Nest Report Q3 2012The Nest Report Q3 2012
The Nest Report Q3 2012
 
Toronto Real Estate Market Update june 2012
Toronto Real Estate Market Update june 2012Toronto Real Estate Market Update june 2012
Toronto Real Estate Market Update june 2012
 
TREB Market Watch October 2012
TREB Market Watch October 2012TREB Market Watch October 2012
TREB Market Watch October 2012
 
February 2013's Monthly Indicators report - Boston Real Estate Market Trends
February 2013's Monthly Indicators report - Boston Real Estate Market TrendsFebruary 2013's Monthly Indicators report - Boston Real Estate Market Trends
February 2013's Monthly Indicators report - Boston Real Estate Market Trends
 
Mw1204
Mw1204Mw1204
Mw1204
 
April 2013 Housing Sales Statistics
April 2013 Housing Sales StatisticsApril 2013 Housing Sales Statistics
April 2013 Housing Sales Statistics
 
Market Watch: August 2012
Market Watch: August 2012Market Watch: August 2012
Market Watch: August 2012
 
Month in-review-february-2013
Month in-review-february-2013Month in-review-february-2013
Month in-review-february-2013
 
Month in-review-february-2013
Month in-review-february-2013Month in-review-february-2013
Month in-review-february-2013
 
Jan 2013 sales meeting
Jan 2013 sales meetingJan 2013 sales meeting
Jan 2013 sales meeting
 
Market Watch - January 2013
Market Watch - January 2013Market Watch - January 2013
Market Watch - January 2013
 

Último

M3M The Line Brochure - Premium Investment Opportunity for Commercial Ventures
M3M The Line Brochure - Premium Investment Opportunity for Commercial VenturesM3M The Line Brochure - Premium Investment Opportunity for Commercial Ventures
M3M The Line Brochure - Premium Investment Opportunity for Commercial Venturessheltercareglobal
 
3D Architectural Rendering Company by Panoram CGI
3D Architectural Rendering Company by Panoram CGI3D Architectural Rendering Company by Panoram CGI
3D Architectural Rendering Company by Panoram CGIPanoram CGI
 
Mahindra Happinest Tathawade Pune Brochure.pdf
Mahindra Happinest Tathawade Pune Brochure.pdfMahindra Happinest Tathawade Pune Brochure.pdf
Mahindra Happinest Tathawade Pune Brochure.pdfBabyrudram
 
Call Girls In Vasant Vihar Delhi 💯Call Us 🔝8264348440🔝
Call Girls In Vasant Vihar Delhi 💯Call Us 🔝8264348440🔝Call Girls In Vasant Vihar Delhi 💯Call Us 🔝8264348440🔝
Call Girls In Vasant Vihar Delhi 💯Call Us 🔝8264348440🔝soniya singh
 
Call Girls In Laxmi Nagar Delhi +91-8447779280! !Best Woman Seeking Man Escor...
Call Girls In Laxmi Nagar Delhi +91-8447779280! !Best Woman Seeking Man Escor...Call Girls In Laxmi Nagar Delhi +91-8447779280! !Best Woman Seeking Man Escor...
Call Girls In Laxmi Nagar Delhi +91-8447779280! !Best Woman Seeking Man Escor...asmaqueen5
 
Premium Villa Projects in Sarjapur Road Bengaluru
Premium Villa Projects in Sarjapur Road BengaluruPremium Villa Projects in Sarjapur Road Bengaluru
Premium Villa Projects in Sarjapur Road BengaluruShivaSeo3
 
Maha Mauka Squarefeet Brochure |Maha Mauka Squarefeet PDF Brochure|
Maha Mauka Squarefeet Brochure |Maha Mauka Squarefeet PDF Brochure|Maha Mauka Squarefeet Brochure |Maha Mauka Squarefeet PDF Brochure|
Maha Mauka Squarefeet Brochure |Maha Mauka Squarefeet PDF Brochure|AkshayJoshi575980
 
Kohinoor Hinjewadi Phase 2 Pune E-Brochure.pdf
Kohinoor Hinjewadi Phase 2 Pune  E-Brochure.pdfKohinoor Hinjewadi Phase 2 Pune  E-Brochure.pdf
Kohinoor Hinjewadi Phase 2 Pune E-Brochure.pdfManishSaxena95
 
Shapoorji Pallonji Joyville Vista Pune | Spend Your Family Time Together
Shapoorji Pallonji Joyville Vista Pune | Spend Your Family Time TogetherShapoorji Pallonji Joyville Vista Pune | Spend Your Family Time Together
Shapoorji Pallonji Joyville Vista Pune | Spend Your Family Time Togetheraidasheikh47
 
Purva Soukhyam in Guduvancheri Chennai.pdf
Purva Soukhyam in Guduvancheri Chennai.pdfPurva Soukhyam in Guduvancheri Chennai.pdf
Purva Soukhyam in Guduvancheri Chennai.pdfpritika141199
 
Greater Vancouver Realtors Statistics Package April 2024
Greater Vancouver Realtors Statistics Package April 2024Greater Vancouver Realtors Statistics Package April 2024
Greater Vancouver Realtors Statistics Package April 2024VickyAulakh1
 
Magarpatta Nova Elegance Mundhwa Pune E-Brochure.pdf
Magarpatta Nova Elegance Mundhwa Pune  E-Brochure.pdfMagarpatta Nova Elegance Mundhwa Pune  E-Brochure.pdf
Magarpatta Nova Elegance Mundhwa Pune E-Brochure.pdfManishSaxena95
 
Properties for Sale in Istanbul with Schools and Parks | Antalya Development
Properties for Sale in Istanbul with Schools and Parks | Antalya DevelopmentProperties for Sale in Istanbul with Schools and Parks | Antalya Development
Properties for Sale in Istanbul with Schools and Parks | Antalya DevelopmentAntalya Development
 
9990771857 Call Girls in Dwarka Sector 3 Delhi (Call Girls) Delhi
9990771857 Call Girls in Dwarka Sector 3 Delhi (Call Girls) Delhi9990771857 Call Girls in Dwarka Sector 3 Delhi (Call Girls) Delhi
9990771857 Call Girls in Dwarka Sector 3 Delhi (Call Girls) Delhidelhimodel235
 
Low Rate ↬Call Girls in Trilokpuri Delhi ↫8447779280}Escorts Service In Delhi
Low Rate ↬Call Girls in Trilokpuri Delhi ↫8447779280}Escorts Service In DelhiLow Rate ↬Call Girls in Trilokpuri Delhi ↫8447779280}Escorts Service In Delhi
Low Rate ↬Call Girls in Trilokpuri Delhi ↫8447779280}Escorts Service In Delhiasmaqueen5
 
Best Deal Virtual Space in Satya The Hive Tata Zudio 750 Sqft 1.89 Cr All inc...
Best Deal Virtual Space in Satya The Hive Tata Zudio 750 Sqft 1.89 Cr All inc...Best Deal Virtual Space in Satya The Hive Tata Zudio 750 Sqft 1.89 Cr All inc...
Best Deal Virtual Space in Satya The Hive Tata Zudio 750 Sqft 1.89 Cr All inc...ApartmentWala1
 
9990771857 Call Girls in Dwarka Sector 2 Delhi (Call Girls) Delhi
9990771857 Call Girls in Dwarka Sector 2 Delhi (Call Girls) Delhi9990771857 Call Girls in Dwarka Sector 2 Delhi (Call Girls) Delhi
9990771857 Call Girls in Dwarka Sector 2 Delhi (Call Girls) Delhidelhimodel235
 
SVN Live 5.6.24 Weekly Property Broadcast
SVN Live 5.6.24 Weekly Property BroadcastSVN Live 5.6.24 Weekly Property Broadcast
SVN Live 5.6.24 Weekly Property BroadcastSVN International Corp.
 
Call Girls in Karkardooma Delhi +91 84487779280}Woman Seeking Man in Delhi NCR
Call Girls in Karkardooma Delhi +91 84487779280}Woman Seeking Man in Delhi NCRCall Girls in Karkardooma Delhi +91 84487779280}Woman Seeking Man in Delhi NCR
Call Girls in Karkardooma Delhi +91 84487779280}Woman Seeking Man in Delhi NCRasmaqueen5
 
BDSM⚡Call Girls in Sector 57 Noida Escorts >༒8448380779 Escort Service
BDSM⚡Call Girls in Sector 57 Noida Escorts >༒8448380779 Escort ServiceBDSM⚡Call Girls in Sector 57 Noida Escorts >༒8448380779 Escort Service
BDSM⚡Call Girls in Sector 57 Noida Escorts >༒8448380779 Escort ServiceDelhi Call girls
 

Último (20)

M3M The Line Brochure - Premium Investment Opportunity for Commercial Ventures
M3M The Line Brochure - Premium Investment Opportunity for Commercial VenturesM3M The Line Brochure - Premium Investment Opportunity for Commercial Ventures
M3M The Line Brochure - Premium Investment Opportunity for Commercial Ventures
 
3D Architectural Rendering Company by Panoram CGI
3D Architectural Rendering Company by Panoram CGI3D Architectural Rendering Company by Panoram CGI
3D Architectural Rendering Company by Panoram CGI
 
Mahindra Happinest Tathawade Pune Brochure.pdf
Mahindra Happinest Tathawade Pune Brochure.pdfMahindra Happinest Tathawade Pune Brochure.pdf
Mahindra Happinest Tathawade Pune Brochure.pdf
 
Call Girls In Vasant Vihar Delhi 💯Call Us 🔝8264348440🔝
Call Girls In Vasant Vihar Delhi 💯Call Us 🔝8264348440🔝Call Girls In Vasant Vihar Delhi 💯Call Us 🔝8264348440🔝
Call Girls In Vasant Vihar Delhi 💯Call Us 🔝8264348440🔝
 
Call Girls In Laxmi Nagar Delhi +91-8447779280! !Best Woman Seeking Man Escor...
Call Girls In Laxmi Nagar Delhi +91-8447779280! !Best Woman Seeking Man Escor...Call Girls In Laxmi Nagar Delhi +91-8447779280! !Best Woman Seeking Man Escor...
Call Girls In Laxmi Nagar Delhi +91-8447779280! !Best Woman Seeking Man Escor...
 
Premium Villa Projects in Sarjapur Road Bengaluru
Premium Villa Projects in Sarjapur Road BengaluruPremium Villa Projects in Sarjapur Road Bengaluru
Premium Villa Projects in Sarjapur Road Bengaluru
 
Maha Mauka Squarefeet Brochure |Maha Mauka Squarefeet PDF Brochure|
Maha Mauka Squarefeet Brochure |Maha Mauka Squarefeet PDF Brochure|Maha Mauka Squarefeet Brochure |Maha Mauka Squarefeet PDF Brochure|
Maha Mauka Squarefeet Brochure |Maha Mauka Squarefeet PDF Brochure|
 
Kohinoor Hinjewadi Phase 2 Pune E-Brochure.pdf
Kohinoor Hinjewadi Phase 2 Pune  E-Brochure.pdfKohinoor Hinjewadi Phase 2 Pune  E-Brochure.pdf
Kohinoor Hinjewadi Phase 2 Pune E-Brochure.pdf
 
Shapoorji Pallonji Joyville Vista Pune | Spend Your Family Time Together
Shapoorji Pallonji Joyville Vista Pune | Spend Your Family Time TogetherShapoorji Pallonji Joyville Vista Pune | Spend Your Family Time Together
Shapoorji Pallonji Joyville Vista Pune | Spend Your Family Time Together
 
Purva Soukhyam in Guduvancheri Chennai.pdf
Purva Soukhyam in Guduvancheri Chennai.pdfPurva Soukhyam in Guduvancheri Chennai.pdf
Purva Soukhyam in Guduvancheri Chennai.pdf
 
Greater Vancouver Realtors Statistics Package April 2024
Greater Vancouver Realtors Statistics Package April 2024Greater Vancouver Realtors Statistics Package April 2024
Greater Vancouver Realtors Statistics Package April 2024
 
Magarpatta Nova Elegance Mundhwa Pune E-Brochure.pdf
Magarpatta Nova Elegance Mundhwa Pune  E-Brochure.pdfMagarpatta Nova Elegance Mundhwa Pune  E-Brochure.pdf
Magarpatta Nova Elegance Mundhwa Pune E-Brochure.pdf
 
Properties for Sale in Istanbul with Schools and Parks | Antalya Development
Properties for Sale in Istanbul with Schools and Parks | Antalya DevelopmentProperties for Sale in Istanbul with Schools and Parks | Antalya Development
Properties for Sale in Istanbul with Schools and Parks | Antalya Development
 
9990771857 Call Girls in Dwarka Sector 3 Delhi (Call Girls) Delhi
9990771857 Call Girls in Dwarka Sector 3 Delhi (Call Girls) Delhi9990771857 Call Girls in Dwarka Sector 3 Delhi (Call Girls) Delhi
9990771857 Call Girls in Dwarka Sector 3 Delhi (Call Girls) Delhi
 
Low Rate ↬Call Girls in Trilokpuri Delhi ↫8447779280}Escorts Service In Delhi
Low Rate ↬Call Girls in Trilokpuri Delhi ↫8447779280}Escorts Service In DelhiLow Rate ↬Call Girls in Trilokpuri Delhi ↫8447779280}Escorts Service In Delhi
Low Rate ↬Call Girls in Trilokpuri Delhi ↫8447779280}Escorts Service In Delhi
 
Best Deal Virtual Space in Satya The Hive Tata Zudio 750 Sqft 1.89 Cr All inc...
Best Deal Virtual Space in Satya The Hive Tata Zudio 750 Sqft 1.89 Cr All inc...Best Deal Virtual Space in Satya The Hive Tata Zudio 750 Sqft 1.89 Cr All inc...
Best Deal Virtual Space in Satya The Hive Tata Zudio 750 Sqft 1.89 Cr All inc...
 
9990771857 Call Girls in Dwarka Sector 2 Delhi (Call Girls) Delhi
9990771857 Call Girls in Dwarka Sector 2 Delhi (Call Girls) Delhi9990771857 Call Girls in Dwarka Sector 2 Delhi (Call Girls) Delhi
9990771857 Call Girls in Dwarka Sector 2 Delhi (Call Girls) Delhi
 
SVN Live 5.6.24 Weekly Property Broadcast
SVN Live 5.6.24 Weekly Property BroadcastSVN Live 5.6.24 Weekly Property Broadcast
SVN Live 5.6.24 Weekly Property Broadcast
 
Call Girls in Karkardooma Delhi +91 84487779280}Woman Seeking Man in Delhi NCR
Call Girls in Karkardooma Delhi +91 84487779280}Woman Seeking Man in Delhi NCRCall Girls in Karkardooma Delhi +91 84487779280}Woman Seeking Man in Delhi NCR
Call Girls in Karkardooma Delhi +91 84487779280}Woman Seeking Man in Delhi NCR
 
BDSM⚡Call Girls in Sector 57 Noida Escorts >༒8448380779 Escort Service
BDSM⚡Call Girls in Sector 57 Noida Escorts >༒8448380779 Escort ServiceBDSM⚡Call Girls in Sector 57 Noida Escorts >༒8448380779 Escort Service
BDSM⚡Call Girls in Sector 57 Noida Escorts >༒8448380779 Escort Service
 

July 2012 MLS Statistics

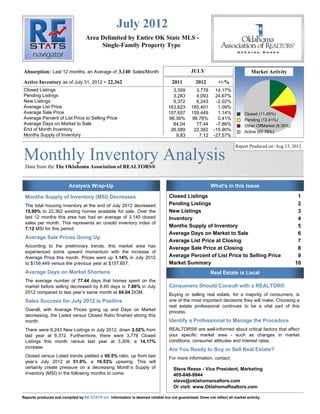
  • 1. July 2012 Area Delimited by Entire OK State MLS - Single-Family Property Type Absorption: Last 12 months, an Average of 3,140 Sales/Month JULY Market Activity Active Inventory as of July 31, 2012 = 22,362 2011 2012 +/-% Closed Listings 3,309 3,778 14.17% Pending Listings 3,283 4,093 24.67% New Listings 6,372 6,243 -2.02% Average List Price 163,623 165,401 1.09% Average Sale Price 157,657 159,449 1.14% Closed (11.45%) Average Percent of List Price to Selling Price 96.36% 96.76% 0.41% Pending (12.41%) Average Days on Market to Sale 84.04 77.44 -7.86% Other OffMarket (8.35%) End of Month Inventory 26,589 22,362 -15.90% Active (67.79%) Months Supply of Inventory 9.83 7.12 -27.57% Report Produced on: Aug 13, 2012 Monthly Inventory Analysis Data from the The Oklahoma Association of REALTORS® Analysis Wrap-Up What's in this Issue Months Supply of Inventory (MSI) Decreases Closed Listings 1 The total housing inventory at the end of July 2012 decreased Pending Listings 2 15.90% to 22,362 existing homes available for sale. Over the New Listings 3 last 12 months this area has had an average of 3,140 closed Inventory 4 sales per month. This represents an unsold inventory index of Months Supply of Inventory 5 7.12 MSI for this period. Average Days on Market to Sale 6 Average Sale Prices Going Up Average List Price at Closing 7 According to the preliminary trends, this market area has Average Sale Price at Closing 8 experienced some upward momentum with the increase of Average Price this month. Prices went up 1.14% in July 2012 Average Percent of List Price to Selling Price 9 to $159,449 versus the previous year at $157,657. Market Summary 10 Average Days on Market Shortens Real Estate is Local The average number of 77.44 days that homes spent on the market before selling decreased by 6.60 days or 7.86% in July Consumers Should Consult with a REALTOR® 2012 compared to last year’s same month at 84.04 DOM. Buying or selling real estate, for a majority of consumers, is Sales Success for July 2012 is Positive one of the most important decisions they will make. Choosing a real estate professional continues to be a vital part of this Overall, with Average Prices going up and Days on Market process. decreasing, the Listed versus Closed Ratio finished strong this month. Identify a Professional to Manage the Procedure There were 6,243 New Listings in July 2012, down 2.02% from REALTORS® are well-informed about critical factors that affect last year at 6,372. Furthermore, there were 3,778 Closed your specific market area - such as changes in market Listings this month versus last year at 3,309, a 14.17% conditions, consumer attitudes and interest rates. increase. Are You Ready to Buy or Sell Real Estate? Closed versus Listed trends yielded a 60.5% ratio, up from last For more information, contact: year’s July 2012 at 51.9%, a 16.53% upswing. This will certainly create pressure on a decreasing Month’s Supply of Steve Reese - Vice President, Marketing Inventory (MSI) in the following months to come. 405-848-9944 steve@oklahomarealtors.com Or visit: www.OklahomaRealtors.com Reports produced and compiled by RE STATS Inc. Information is deemed reliable but not guaranteed. Does not reflect all market activity.
  • 2. Monthly Inventory Analysis Data from the The Oklahoma Association of REALTORS® July 2012 Closed Sales as of Aug 12, 2012 Closed Listings Report Produced on: Aug 13, 2012 Area Delimited by Entire OK State MLS - Single-Family Property Type JULY YEAR TO DATE (YTD) 2008 2009 2010 2011 2012 2008 2009 2010 2011 2012 4,041 3,947 3,778 23,629 22,966 3,309 21,180 20,971 2,627 19,868 1 Year 1 Year +14.17% +15.59% 2 Year 2 Year +43.81% +9.51% 5 YEAR MARKET ACTIVITY TRENDS 5yr JUL AVG = 3,540 3 MONTHS 5,000 High M 3,853 Jul 2008 = 4,041 A 4,000 Low Y 3,000 Jan 2010 = 1,691 J 3,768 U Closed Listings 2,000 Closed Listings this N -2.21% 1,000 month at 3,778, above the 5 yr JUL J 3,778 0 U Jun 2008 Dec 2008 Jun 2009 Dec 2009 Jun 2010 Dec 2010 Jun 2011 Dec 2011 Jun 2012 average of 3,540 L 0.27% CLOSED LISTINGS & BEDROOMS DISTRIBUTION BY PRICE Distribution of Closed Listings by Price Range % AVDOM 2 Beds 3 Beds 4 Beds 5 Beds+ $25,000 and less 124 3.28% 70.2 59 59 5 1 $25,001 $75,000 675 17.87% 84.8 203 425 40 7 $75,001 $100,000 404 10.69% 79.7 90 284 28 2 $100,001 Contact an experienced REALTOR Ready to Buy or Sell Real Estate? $150,000 989 26.18% 71.3 173 708 101 7 $150,001 $200,000 710 18.79% 74.7 99 393 205 13 $200,001 $275,000 466 12.33% 74.7 56 174 216 20 $275,001 and up 410 10.85% 88.1 30 90 230 60 Total Closed Units: 3,778 77.4 710 2133 825 110 Total Closed Volume: 602,398,295 81.80M 278.01M 200.66M 41.93M Average Closed Price: $159,449 $115,215 $130,337 $243,226 $381,142 Reports produced and compiled by RE STATS Inc. Information is deemed reliable but not guaranteed. Does not reflect all market activity. pp. 1 Steve Reese 405-848-9944 steve@oklahomarealtors.com
  • 3. Monthly Inventory Analysis Data from the The Oklahoma Association of REALTORS® July 2012 Pending Listings as of Aug 12, 2012 Pending Listings Report Produced on: Aug 13, 2012 Area Delimited by Entire OK State MLS - Single-Family Property Type JULY YEAR TO DATE (YTD) 2008 2009 2010 2011 2012 2008 2009 2010 2011 2012 4,093 25,158 25,767 3,804 3,556 3,283 23,015 2,825 21,927 21,412 1 Year 1 Year +24.67% +20.34% 2 Year 2 Year +44.88% +17.51% 5 YEAR MARKET ACTIVITY TRENDS 5yr JUL AVG = 3,512 3 MONTHS 5,000 High M 3,880 Apr 2010 = 4,806 A 4,000 Low Y 3,000 Dec 2009 = 2,007 J 3,693 U Pending Listings 2,000 Pending Listingsthis N -4.82% 1,000 month at 4,093, above the 5 yr JUL J 4,093 0 U Jun 2008 Dec 2008 Jun 2009 Dec 2009 Jun 2010 Dec 2010 Jun 2011 Dec 2011 Jun 2012 average of 3,512 L 10.83% PENDING LISTINGS & BEDROOMS DISTRIBUTION BY PRICE Distribution of Pending Listings by Price Range % AVDOM 2 Beds 3 Beds 4 Beds 5 Beds+ $50,000 and less 387 9.46% 75.3 161 196 25 5 $50,001 $75,000 360 8.80% 87.4 113 216 26 5 $75,001 $100,000 440 10.75% 78.2 107 289 40 4 $100,001 Contact an experienced REALTOR Ready to Buy or Sell Real Estate? $150,000 1,067 26.07% 71.4 171 769 119 8 $150,001 $200,000 797 19.47% 75.7 104 454 232 7 $200,001 $275,000 538 13.14% 68.3 56 202 258 22 $275,001 and up 504 12.31% 83.8 40 112 281 71 Total Pending Units: 4,093 81.8 752 2238 981 122 Total Pending Volume: 686,863,145 89.59M 311.85M 241.45M 43.97M Average Listing Price: $174,389 $119,134 $139,343 $246,126 $360,447 Reports produced and compiled by RE STATS Inc. Information is deemed reliable but not guaranteed. Does not reflect all market activity. pp. 2 Steve Reese 405-848-9944 steve@oklahomarealtors.com
  • 4. Monthly Inventory Analysis Data from the The Oklahoma Association of REALTORS® July 2012 New Listings as of Aug 12, 2012 New Listings Report Produced on: Aug 13, 2012 Area Delimited by Entire OK State MLS - Single-Family Property Type JULY YEAR TO DATE (YTD) 2008 2009 2010 2011 2012 2008 2009 2010 2011 2012 6,531 44,239 43,691 6,372 42,291 42,272 6,243 6,009 6,116 39,579 1 Year 1 Year -2.02% +3.36% 2 Year 2 Year +2.08% +3.31% 5 YEAR MARKET ACTIVITY TRENDS 5yr JUL AVG = 6,254 3 MONTHS 8,000 High M 6,620 7,000 Apr 2010 = 7,586 A 6,000 Low Y 5,000 Dec 2008 = 3,500 J 6,011 4,000 U New Listings 3,000 New Listings this N -9.20% 2,000 month at 6,243, 1,000 below the 5 yr JUL J 6,243 0 U Jun 2008 Dec 2008 Jun 2009 Dec 2009 Jun 2010 Dec 2010 Jun 2011 Dec 2011 Jun 2012 average of 6,254 L 3.86% NEW LISTINGS & BEDROOMS DISTRIBUTION BY PRICE Distribution of New Listings by Price Range % 2 Beds 3 Beds 4 Beds 5 Beds+ $50,000 and less 466 7.46% 236 195 30 5 $50,001 $75,000 526 8.43% 187 298 37 4 $75,001 $100,000 747 11.97% 203 482 58 4 $100,001 Contact an experienced REALTOR Ready to Buy or Sell Real Estate? $150,000 1,628 26.08% 303 1,113 198 14 $150,001 $225,000 1,461 23.40% 242 800 393 26 $225,001 $325,000 761 12.19% 74 257 389 41 $325,001 and up 654 10.48% 63 155 317 119 Total New Listed Units: 6,243 1308 3300 1422 213 Total New Listed Volume: 1,162,948,976 173.41M 501.64M 378.57M 109.33M Average New Listed Listing Price: $247,058 $132,577 $152,012 $266,225 $513,277 Reports produced and compiled by RE STATS Inc. Information is deemed reliable but not guaranteed. Does not reflect all market activity. pp. 3 Steve Reese 405-848-9944 steve@oklahomarealtors.com
  • 5. Monthly Inventory Analysis Data from the The Oklahoma Association of REALTORS® July 2012 Active Inventory as of Aug 12, 2012 Active Inventory Report Produced on: Aug 13, 2012 Area Delimited by Entire OK State MLS - Single-Family Property Type END OF JULY ACTIVE DURING JULY 2008 2009 2010 2011 2012 2008 2009 2010 2011 2012 26,581 32,455 24,028 24,635 30,215 29,798 22,362 29,208 21,761 27,548 1 Year 1 Year -15.87% -10.00% 2 Year 2 Year -9.23% -1.98% 5 YEAR MARKET ACTIVITY TRENDS 5yr JUL AVG = 23,873 3 MONTHS Active Inventory 30,000 High M 22,896 Jul 2011 = 26,581 A Low Y 20,000 Jan 2008 = 19,323 J 22,975 U 10,000 Inventory this N 0.35% month at 22,362, below the 5 yr JUL J 22,362 0 U Jun 2008 Dec 2008 Jun 2009 Dec 2009 Jun 2010 Dec 2010 Jun 2011 Dec 2011 Jun 2012 average of 23,873 L -2.67% INVENTORY & BEDROOMS DISTRIBUTION BY PRICE Distribution of Inventory by Price Range % AVDOM 2 Beds 3 Beds 4 Beds 5 Beds+ $50,000 and less 1,814 8.11% 124.7 919 767 111 17 $50,001 $75,000 2,241 10.02% 120.2 838 1,229 149 25 $75,001 $100,000 2,709 12.11% 108.8 677 1,746 264 22 $100,001 Contact an experienced REALTOR Ready to Buy or Sell Real Estate? $175,000 7,152 31.98% 95.7 1,316 4,590 1,157 89 $175,001 $225,000 2,753 12.31% 97.0 453 1,290 927 83 $225,001 $350,000 3,348 14.97% 105.6 444 1,174 1,494 236 $350,001 and up 2,345 10.49% 118.1 233 486 1,107 519 Total Active Inventory by Units: 22,362 106.1 4,880 11,282 5,209 991 Total Active Inventory by Volume: 4,464,604,913 668.30M 1.76B 1.48B 550.50M Average Active Inventory Listing Price: $199,651 $136,947 $156,249 $284,700 $555,499 Reports produced and compiled by RE STATS Inc. Information is deemed reliable but not guaranteed. Does not reflect all market activity. pp. 4 Steve Reese 405-848-9944 steve@oklahomarealtors.com
  • 6. Monthly Inventory Analysis Data from the The Oklahoma Association of REALTORS® July 2012 Active Inventory as of Aug 12, 2012 Months Supply of Inventory Report Produced on: Aug 13, 2012 Area Delimited by Entire OK State MLS - Single-Family Property Type MSI FOR JULY INDICATORS FOR JULY 2012 2008 2009 2010 2011 2012 Inventory Closed Absorption MSI MSI % 9.8 37,682 7.1 14.042% 7.9 22,362 7.1 7.1 7.1 1 Year 3,140 End of Closed Average Months Percent -27.54% Month Last Closed per Supply Months 2 Year Active 12 Month over of Supply of -10.39% Inventory Months 12 Months Inventory Inventory 5 YEAR MARKET ACTIVITY TRENDS 5yr JUL AVG = 7.8 3 MONTHS 10 High M 7.4 9 Jun 2011 = 9.9 A 8 Low Y 7 6 Jan 2008 = 5.3 J 7.4 5 U Months Supply 4 Months Supply this N -0.53% 3 2 month at 7.1, 1 below the 5 yr JUL J 7.1 0 U Jun 2008 Dec 2008 Jun 2009 Dec 2009 Jun 2010 Dec 2010 Jun 2011 Dec 2011 Jun 2012 average of 7.8 L -3.88% MONTHS SUPPLY & BEDROOMS DISTRIBUTION BY PRICE Distribution of Active Inventory by Price Range and MSI % MSI 2 Beds 3 Beds 4 Beds 5 Beds+ $50,000 and less 1,814 8.11% 4.1 5.1 3.3 3.5 4.5 $50,001 $80,000 2,843 12.71% 7.2 9.0 6.5 6.7 11.1 $80,001 $110,000 2,873 12.85% 6.8 7.6 6.4 7.3 7.4 $110,001 Contact an experienced REALTOR Ready to Buy or Sell Real Estate? $170,000 6,059 27.10% 6.4 7.5 6.2 6.3 6.7 $170,001 $240,000 3,683 16.47% 7.5 9.7 7.5 6.6 9.3 $240,001 $360,000 2,836 12.68% 9.6 13.4 10.6 8.2 10.5 $360,001 and up 2,254 10.08% 15.4 26.3 16.0 13.4 17.4 MSI: 7.1 7.8 6.4 7.6 11.8 Total Active Inventory: 22,362 4,880 11,282 5,209 991 Reports produced and compiled by RE STATS Inc. Information is deemed reliable but not guaranteed. Does not reflect all market activity. pp. 5 Steve Reese 405-848-9944 steve@oklahomarealtors.com
  • 7. Monthly Inventory Analysis Data from the The Oklahoma Association of REALTORS® July 2012 Closed Sales as of Aug 12, 2012 Average Days on Market to Sale Report Produced on: Aug 13, 2012 Area Delimited by Entire OK State MLS - Single-Family Property Type JULY YEAR TO DATE (YTD) 2008 2009 2010 2011 2012 2008 2009 2010 2011 2012 84 89 84 85 84 78 79 77 77 78 1 Year 1 Year -7.86% -5.94% 2 Year 2 Year -1.60% +7.90% 5 YEAR MARKET ACTIVITY TRENDS 5yr JUL AVG = 79 3 MONTHS Average Days on Market 100 High M 79 90 Mar 2011 = 97 A 80 Low Y 70 60 May 2010 = 73 J 78 50 U 40 Average DOM this N -2.26% 30 20 month at 77, 10 below the 5 yr JUL J 77 0 U Jun 2008 Dec 2008 Jun 2009 Dec 2009 Jun 2010 Dec 2010 Jun 2011 Dec 2011 Jun 2012 average of 79 L -0.13% AVERAGE DOM OF CLOSED SALES & BEDROOMS DISTRIBUTION BY PRICE Distribution of Average Days on Market to Sale by Price Range % AVDOM 2 Beds 3 Beds 4 Beds 5 Beds+ $25,000 and less 124 3.28% 70.2 79.6 61.2 44.2 176.0 $25,001 $75,000 675 17.87% 84.8 93.0 81.0 88.8 53.6 $75,001 $100,000 404 10.69% 79.7 89.8 77.4 60.5 211.5 $100,001 Contact an experienced REALTOR Ready to Buy or Sell Real Estate? $150,000 989 26.18% 71.3 83.3 67.6 74.9 93.4 $150,001 $200,000 710 18.79% 74.7 100.7 70.4 68.9 95.9 $200,001 $275,000 466 12.33% 74.7 74.4 67.7 80.6 73.3 $275,001 and up 410 10.85% 88.1 149.6 72.4 89.2 76.8 Average Closed DOM: 77.4 91.1 72.1 78.9 81.3 Total Closed Units: 3,778 710 2133 825 110 Total Closed Volume: 602,398,295 81.80M 278.01M 200.66M 41.93M Reports produced and compiled by RE STATS Inc. Information is deemed reliable but not guaranteed. Does not reflect all market activity. pp. 6 Steve Reese 405-848-9944 steve@oklahomarealtors.com
  • 8. Monthly Inventory Analysis Data from the The Oklahoma Association of REALTORS® July 2012 Closed Sales as of Aug 12, 2012 Average List Price at Closing Report Produced on: Aug 13, 2012 Area Delimited by Entire OK State MLS - Single-Family Property Type JULY YEAR TO DATE (YTD) 2008 2009 2010 2011 2012 2008 2009 2010 2011 2012 163,623 165,401 158,935 163,209 155,300 159,608 153,088 150,938 156,493 149,154 1 Year 1 Year +1.09% +2.34% 2 Year 2 Year +1.34% +5.30% 5 YEAR MARKET ACTIVITY TRENDS 5yr JUL AVG = 162K 3 MONTHS Average List Price 200,000 High M 164,795 Jun 2012 = 166,799 A Low Y Nov 2008 = 135,800 J 166,799 100,000 U Average LPrice this N 1.22% month at 165,401, above the 5 yr JUL J 165,401 U 0 Jun 2008 Dec 2008Jun 2009 Dec 2009Jun 2010 Dec 2010Jun 2011 Dec 2011Jun 2012 average of 161,667 L -0.84% AVERAGE LIST PRICE OF CLOSED SALES & BEDROOMS DISTRIBUTION BY PRICE Distribution of Average List Price at Closing by Price Range % AVL$ 2 Beds 3 Beds 4 Beds 5 Beds+ $25,000 and less 122 3.23% 18,876 19,411 20,142 22,720 9,900 $25,001 $75,000 638 16.89% 52,238 54,867 53,953 54,488 49,079 $75,001 $100,000 401 10.61% 88,687 90,888 91,038 92,714 91,900 $100,001 Contact an experienced REALTOR Ready to Buy or Sell Real Estate? $150,000 966 25.57% 127,665 131,397 129,499 135,082 138,007 $150,001 $200,000 739 19.56% 173,583 175,295 174,692 182,655 176,554 $200,001 $275,000 475 12.57% 235,744 242,428 237,154 241,925 281,249 $275,001 and up 437 11.57% 435,033 374,491 386,727 433,126 597,787 Average List Price: $165,401 $120,225 $134,263 $251,941 $411,733 Total Closed Units: 3,778 710 2133 825 110 Total List Volume: 624,884,945 85.36M 286.38M 207.85M 45.29M Reports produced and compiled by RE STATS Inc. Information is deemed reliable but not guaranteed. Does not reflect all market activity. pp. 7 Steve Reese 405-848-9944 steve@oklahomarealtors.com
  • 9. Monthly Inventory Analysis Data from the The Oklahoma Association of REALTORS® July 2012 Closed Sales as of Aug 12, 2012 Average Sold Price at Closing Report Produced on: Aug 13, 2012 Area Delimited by Entire OK State MLS - Single-Family Property Type JULY YEAR TO DATE (YTD) 2008 2009 2010 2011 2012 2008 2009 2010 2011 2012 157,657 159,449 153,293 155,222 157,053 149,169 148,454 150,804 143,823 145,619 1 Year 1 Year +1.14% +2.76% 2 Year 2 Year +1.53% +5.27% 5 YEAR MARKET ACTIVITY TRENDS 5yr JUL AVG = 156K 3 MONTHS Average Sold Price 200,000 High M 159,503 Jun 2012 = 161,269 A Low Y Nov 2008 = 131,059 J 161,269 100,000 U Average SPrice this N 1.11% month at 159,449, above the 5 yr JUL J 159,449 U 0 Jun 2008 Dec 2008Jun 2009 Dec 2009Jun 2010 Dec 2010Jun 2011 Dec 2011Jun 2012 average of 156,037 L -1.13% AVERAGE SOLD PRICE OF CLOSED SALES & BEDROOMS DISTRIBUTION BY PRICE Distribution of Average Sold Price at Closing by Price Range % AVS$ 2 Beds 3 Beds 4 Beds 5 Beds+ $25,000 and less 124 3.28% 17,379 16,994 17,716 19,825 8,000 $25,001 $75,000 675 17.87% 50,756 50,532 50,972 50,297 46,750 $75,001 $100,000 404 10.69% 87,998 87,142 88,205 88,714 87,000 $100,001 Contact an experienced REALTOR Ready to Buy or Sell Real Estate? $150,000 989 26.18% 127,013 127,478 126,291 130,656 135,971 $150,001 $200,000 710 18.79% 172,815 171,236 170,798 177,808 167,069 $200,001 $275,000 466 12.33% 233,813 233,054 230,357 235,640 246,279 $275,001 and up 410 10.85% 422,343 354,724 373,674 415,310 556,119 Average Closed Price: $159,449 $115,215 $130,337 $243,226 $381,142 Total Closed Units: 3,778 710 2133 825 110 Total Closed Volume: 602,398,295 81.80M 278.01M 200.66M 41.93M Reports produced and compiled by RE STATS Inc. Information is deemed reliable but not guaranteed. Does not reflect all market activity. pp. 8 Steve Reese 405-848-9944 steve@oklahomarealtors.com
  • 10. Monthly Inventory Analysis Data from the The Oklahoma Association of REALTORS® July 2012 Closed Sales as of Aug 12, 2012 Average Percent of List Price to Selling Price Report Produced on: Aug 13, 2012 Area Delimited by Entire OK State MLS - Single-Family Property Type JULY YEAR TO DATE (YTD) 2008 2009 2010 2011 2012 2008 2009 2010 2011 2012 97.06% 96.84% 96.65% 96.76% 96.44% 96.34% 96.36% 96.18% 96.13% 95.86% 1 Year 1 Year +0.41% +0.51% 2 Year 2 Year +0.65% -0.10% 5 YEAR MARKET ACTIVITY TRENDS 5yr JUL AVG=96.59% 3 MONTHS Average List/Sell Price 98 High M 96.61% May 2008 = 97.13% A Low Y 97 Jan 2011 = 95.15% J 96.93% U 96 Average List/Sell this N 0.33% month at 96.76%, above the 5 yr JUL J 96.76% U 95 Jun 2008 Dec 2008 Jun 2009 Dec 2009 Jun 2010 Dec 2010 Jun 2011 Dec 2011 Jun 2012 average of 96.59% L -0.18% AVERAGE L/S% OF CLOSED SALES & BEDROOMS DISTRIBUTION BY PRICE Distribution of $avgmed L/S % by Price Range % AVL/S% 2 Beds 3 Beds 4 Beds 5 Beds+ $25,000 and less 124 3.28% 89.98% 89.37% 90.56% 92.32% 80.81% $25,001 $75,000 675 17.87% 95.23% 94.24% 95.93% 92.57% 96.10% $75,001 $100,000 404 10.69% 97.40% 96.09% 97.90% 96.74% 94.53% $100,001 Contact an experienced REALTOR Ready to Buy or Sell Real Estate? $150,000 989 26.18% 97.57% 97.22% 97.72% 96.99% 98.60% $150,001 $200,000 710 18.79% 97.77% 97.79% 98.00% 97.48% 95.20% $200,001 $275,000 466 12.33% 97.19% 96.86% 97.34% 97.62% 92.24% $275,001 and up 410 10.85% 96.51% 95.07% 96.73% 96.79% 95.80% Average List/Sell Ratio: 96.80% 95.53% 97.17% 96.97% 95.12% Total Closed Units: 3,778 710 2133 825 110 Total Closed Volume: 602,398,295 81.80M 278.01M 200.66M 41.93M Reports produced and compiled by RE STATS Inc. Information is deemed reliable but not guaranteed. Does not reflect all market activity. pp. 9 Steve Reese 405-848-9944 steve@oklahomarealtors.com
  • 11. Monthly Inventory Analysis Data from the The Oklahoma Association of REALTORS® July 2012 Inventory as of Aug 12, 2012 Market Summary Report Produced on: Aug 13, 2012 Area Delimited by Entire OK State MLS - Single-Family Property Type Inventory Inventory Market Activity Market Activity New Listings Closed Sales 6,243 = 21.37% 3,778 = 11.45% Start Inventory Pending Sales 22,974 4,093 = 12.41% Total Inventory Other Off Market Units 2,754 = 8.35% 29,217 Volume Active Inventory $5,693,709,827 22,362 = 67.79% Absorption: Last 12 months, an Average of 3,140 Sales/Month JULY Year To Date Active Inventory as of July 31, 2012 = 22,362 2011 2012 +/-% 2011 2012 +/-% Closed Sales 3,309 3,778 14.17% 19,868 22,966 15.59% Pending Sales 3,283 4,093 24.67% 21,412 25,767 20.34% New Listings 6,372 6,243 -2.02% 42,272 43,691 3.36% Average List Price 163,623 165,401 1.09% 155,300 158,935 2.34% Average Sale Price 157,657 159,449 1.14% 149,169 153,293 2.76% Average Percent of List Price to Selling Price 96.36% 96.76% 0.41% 95.86% 96.34% 0.51% Average Days on Market to Sale 84.04 77.44 -7.86% 89.29 83.99 -5.94% Monthly Inventory 26,589 22,362 -15.90% 26,589 22,362 -15.90% Months Supply of Inventory 9.83 7.12 -27.57% 9.83 7.12 -27.57% 2011 2011 JULY MARKET 2012 AVERAGE PRICES 2012 New Listings Pending Listings List Price Sale Price 6,372 6,243 165,401 163,623 4,093 159,449 3,283 157,657 -2.02% +24.67% +1.09% +1.14% 2011 2011 INVENTORY 2012 AVERAGE L/S% & DOM 2012 Active Inventory Monthly Supply of Inventory % of List to Sale Price Days on Market to Sale 26,589 9.83 96.76% 84.04 22,362 7.12 96.36% 77.44 -15.90% -27.57% +0.41% -7.86% Reports produced and compiled by RE STATS Inc. Information is deemed reliable but not guaranteed. Does not reflect all market activity. pp. 10 Steve Reese 405-848-9944 steve@oklahomarealtors.com