

Recomendados
Recomendados
Mais conteúdo relacionado
Último
Último (20)
Destaque
Destaque (20)
February 2013 Housing Sales Statistics
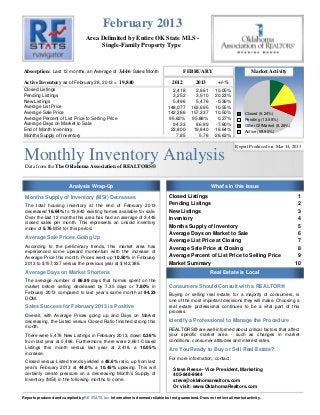
- 1. February 2013 Area Delimited by Entire OK State MLS - Single-Family Property Type Absorption: Last 12 months, an Average of 3,446 Sales/Month FEBRUARY Market Activity Active Inventory as of February 28, 2013 = 19,840 2012 2013 +/-% Closed Listings 2,418 2,661 10.05% Pending Listings 3,252 3,910 20.23% New Listings 5,496 5,476 -0.36% Average List Price 148,077 163,695 10.55% Average Sale Price 142,386 157,337 10.50% Closed (9.24%) Average Percent of List Price to Selling Price 95.62% 95.88% 0.27% Pending (13.58%) Average Days on Market to Sale 94.23 86.89 -7.80% Other OffMarket (8.28%) End of Month Inventory 23,800 19,840 -16.64% Active (68.90%) Months Supply of Inventory 7.85 5.76 -26.63% Report Produced on: Mar 14, 2013 Monthly Inventory Analysis Data from the The Oklahoma Association of REALTORS® Analysis Wrap-Up What's in this Issue Months Supply of Inventory (MSI) Decreases Closed Listings 1 The total housing inventory at the end of February 2013 Pending Listings 2 decreased 16.64% to 19,840 existing homes available for sale. New Listings 3 Over the last 12 months this area has had an average of 3,446 Inventory 4 closed sales per month. This represents an unsold inventory Months Supply of Inventory 5 index of 5.76 MSI for this period. Average Days on Market to Sale 6 Average Sale Prices Going Up Average List Price at Closing 7 According to the preliminary trends, this market area has Average Sale Price at Closing 8 experienced some upward momentum with the increase of Average Price this month. Prices went up 10.50% in February Average Percent of List Price to Selling Price 9 2013 to $157,337 versus the previous year at $142,386. Market Summary 10 Average Days on Market Shortens Real Estate is Local The average number of 86.89 days that homes spent on the market before selling decreased by 7.35 days or 7.80% in Consumers Should Consult with a REALTOR® February 2013 compared to last year’s same month at 94.23 Buying or selling real estate, for a majority of consumers, is DOM. one of the most important decisions they will make. Choosing a Sales Success for February 2013 is Positive real estate professional continues to be a vital part of this process. Overall, with Average Prices going up and Days on Market decreasing, the Listed versus Closed Ratio finished strong this Identify a Professional to Manage the Procedure month. REALTORS® are well-informed about critical factors that affect There were 5,476 New Listings in February 2013, down 0.36% your specific market area - such as changes in market from last year at 5,496. Furthermore, there were 2,661 Closed conditions, consumer attitudes and interest rates. Listings this month versus last year at 2,418, a 10.05% Are You Ready to Buy or Sell Real Estate? increase. For more information, contact: Closed versus Listed trends yielded a 48.6% ratio, up from last year’s February 2013 at 44.0%, a 10.45% upswing. This will Steve Reese - Vice President, Marketing certainly create pressure on a decreasing Month’s Supply of 405-848-9944 Inventory (MSI) in the following months to come. steve@oklahomarealtors.com Or visit: www.OklahomaRealtors.com Reports produced and compiled by RE STATS Inc. Information is deemed reliable but not guaranteed. Does not reflect all market activity.
- 2. Monthly Inventory Analysis Data from the The Oklahoma Association of REALTORS® February 2013 Closed Sales as of Mar 12, 2013 Closed Listings Report Produced on: Mar 14, 2013 Area Delimited by Entire OK State MLS - Single-Family Property Type FEBRUARY YEAR TO DATE (YTD) 2009 2010 2011 2012 2013 2009 2010 2011 2012 2013 2,661 5,153 2,416 2,418 4,733 2,204 4,281 4,129 2,120 3,933 1 Year 1 Year +10.05% +8.87% 2 Year 2 Year +25.52% +24.80% 5 YEAR MARKET ACTIVITY TRENDS 5yr FEB AVG = 2,364 3 MONTHS 5,000 High D 3,106 Jul 2009 = 4,130 E 4,000 Low C 3,000 Jan 2010 = 1,729 J 2,492 A Closed Listings 2,000 Closed Listings this N -19.77% 1,000 month at 2,661, above the 5 yr FEB F 2,661 E 0 Jun 2009 Dec 2009 Jun 2010 Dec 2010 Jun 2011 Dec 2011 Jun 2012 Dec 2012 average of 2,364 B 6.78% CLOSED LISTINGS & BEDROOMS DISTRIBUTION BY PRICE Distribution of Closed Listings by Price Range % AVDOM 2 Beds 3 Beds 4 Beds 5 Beds+ $25,000 and less 126 4.74% 70.1 73 50 3 0 $25,001 $50,000 252 9.47% 75.6 90 137 23 2 $50,001 $100,000 563 21.16% 86.1 137 372 49 5 $100,001 Contact an experienced REALTOR Ready to Buy or Sell Real Estate? $150,000 660 24.80% 85.0 102 474 79 5 $150,001 $200,000 451 16.95% 92.6 73 249 125 4 $200,001 $275,000 333 12.51% 90.5 35 121 163 14 $275,001 and up 276 10.37% 97.4 23 67 137 49 Total Closed Units: 2,661 86.9 533 1470 579 79 Total Closed Volume: 418,673,086 57.48M 194.90M 135.23M 31.07M Average Closed Price: $157,337 $107,843 $132,582 $233,550 $393,320 Reports produced and compiled by RE STATS Inc. Information is deemed reliable but not guaranteed. Does not reflect all market activity. pp. 1 Steve Reese 405-848-9944 steve@oklahomarealtors.com
- 3. Monthly Inventory Analysis Data from the The Oklahoma Association of REALTORS® February 2013 Pending Listings as of Mar 12, 2013 Pending Listings Report Produced on: Mar 14, 2013 Area Delimited by Entire OK State MLS - Single-Family Property Type FEBRUARY YEAR TO DATE (YTD) 2009 2010 2011 2012 2013 2009 2010 2011 2012 2013 3,910 7,456 2,986 3,252 6,381 2,838 5,555 5,417 2,350 4,966 1 Year 1 Year +20.23% +16.85% 2 Year 2 Year +66.38% +50.14% 5 YEAR MARKET ACTIVITY TRENDS 5yr FEB AVG = 3,067 3 MONTHS 5,000 High D 2,549 Apr 2010 = 4,963 E 4,000 Low C 3,000 Dec 2009 = 2,048 J 3,546 A Pending Listings 2,000 Pending Listingsthis N 39.11% 1,000 month at 3,910, above the 5 yr FEB F 3,910 E 0 Jun 2009 Dec 2009 Jun 2010 Dec 2010 Jun 2011 Dec 2011 Jun 2012 Dec 2012 average of 3,067 B 10.27% PENDING LISTINGS & BEDROOMS DISTRIBUTION BY PRICE Distribution of Pending Listings by Price Range % AVDOM 2 Beds 3 Beds 4 Beds 5 Beds+ $25,000 and less 135 3.45% 61.3 73 53 9 0 $25,001 $75,000 640 16.37% 74.6 210 373 53 4 $75,001 $100,000 507 12.97% 78.6 116 348 37 6 $100,001 Contact an experienced REALTOR Ready to Buy or Sell Real Estate? $150,000 977 24.99% 76.2 171 682 118 6 $150,001 $200,000 746 19.08% 77.1 112 410 211 13 $200,001 $275,000 451 11.53% 70.7 53 189 187 22 $275,001 and up 454 11.61% 87.9 40 103 261 50 Total Pending Units: 3,910 90.7 775 2158 876 101 Total Pending Volume: 646,388,539 92.01M 299.45M 217.06M 37.87M Average Listing Price: $179,658 $118,718 $138,764 $247,790 $374,907 Reports produced and compiled by RE STATS Inc. Information is deemed reliable but not guaranteed. Does not reflect all market activity. pp. 2 Steve Reese 405-848-9944 steve@oklahomarealtors.com
- 4. Monthly Inventory Analysis Data from the The Oklahoma Association of REALTORS® February 2013 New Listings as of Mar 12, 2013 New Listings Report Produced on: Mar 14, 2013 Area Delimited by Entire OK State MLS - Single-Family Property Type FEBRUARY YEAR TO DATE (YTD) 2009 2010 2011 2012 2013 2009 2010 2011 2012 2013 5,330 5,496 5,476 11,638 11,421 5,224 10,493 10,480 4,413 9,955 1 Year 1 Year -0.36% -1.86% 2 Year 2 Year +24.09% +14.73% 5 YEAR MARKET ACTIVITY TRENDS 5yr FEB AVG = 5,188 3 MONTHS 8,000 High D 3,712 7,000 Apr 2010 = 7,850 E 6,000 Low C 5,000 Dec 2012 = 3,712 J 5,945 4,000 A New Listings 3,000 New Listings this N 60.16% 2,000 month at 5,476, 1,000 above the 5 yr FEB F 5,476 E 0 Jun 2009 Dec 2009 Jun 2010 Dec 2010 Jun 2011 Dec 2011 Jun 2012 Dec 2012 average of 5,188 B -7.89% NEW LISTINGS & BEDROOMS DISTRIBUTION BY PRICE Distribution of New Listings by Price Range % 2 Beds 3 Beds 4 Beds 5 Beds+ $50,000 and less 517 9.44% 251 232 32 2 $50,001 $75,000 491 8.97% 154 297 37 3 $75,001 $100,000 634 11.58% 163 399 68 4 $100,001 Contact an experienced REALTOR Ready to Buy or Sell Real Estate? $150,000 1,305 23.83% 232 905 156 12 $150,001 $225,000 1,266 23.12% 183 708 342 33 $225,001 $325,000 702 12.82% 93 235 335 39 $325,001 and up 561 10.24% 49 123 289 100 Total New Listed Units: 5,476 1125 2899 1259 193 Total New Listed Volume: 1,023,556,491 148.95M 430.87M 338.61M 105.13M Average New Listed Listing Price: $234,955 $132,396 $148,627 $268,955 $544,706 Reports produced and compiled by RE STATS Inc. Information is deemed reliable but not guaranteed. Does not reflect all market activity. pp. 3 Steve Reese 405-848-9944 steve@oklahomarealtors.com
- 5. Monthly Inventory Analysis Data from the The Oklahoma Association of REALTORS® February 2013 Active Inventory as of Mar 12, 2013 Active Inventory Report Produced on: Mar 14, 2013 Area Delimited by Entire OK State MLS - Single-Family Property Type END OF FEBRUARY ACTIVE DURING FEBRUARY 2009 2010 2011 2012 2013 2009 2010 2011 2012 2013 24,279 23,694 29,154 29,565 22,037 27,277 20,709 19,840 25,701 26,148 1 Year 1 Year -16.27% -11.56% 2 Year 2 Year -18.28% -10.31% 5 YEAR MARKET ACTIVITY TRENDS 5yr FEB AVG = 22,112 3 MONTHS Active Inventory 30,000 High D 21,819 Jul 2011 = 27,580 E Low C 20,000 Feb 2013 = 19,840 J 20,681 A 10,000 Inventory this N -5.22% month at 19,840, below the 5 yr FEB F 19,840 0 E Jun 2009 Dec 2009 Jun 2010 Dec 2010 Jun 2011 Dec 2011 Jun 2012 Dec 2012 average of 22,112 B -4.07% INVENTORY & BEDROOMS DISTRIBUTION BY PRICE Distribution of Inventory by Price Range % AVDOM 2 Beds 3 Beds 4 Beds 5 Beds+ $50,000 and less 1,892 9.54% 165.8 1,011 747 120 14 $50,001 $75,000 2,091 10.54% 163.1 780 1,141 148 22 $75,001 $100,000 2,459 12.39% 164.5 676 1,515 250 18 $100,001 Contact an experienced REALTOR Ready to Buy or Sell Real Estate? $150,000 4,380 22.08% 136.4 862 2,910 553 55 $150,001 $225,000 4,126 20.80% 124.9 691 2,187 1,149 99 $225,001 $350,000 2,829 14.26% 116.4 418 968 1,247 196 $350,001 and up 2,063 10.40% 135.1 193 450 974 446 Total Active Inventory by Units: 19,840 140.1 4,631 9,918 4,441 850 Total Active Inventory by Volume: 3,901,878,199 609.28M 1.55B 1.25B 492.19M Average Active Inventory Listing Price: $196,667 $131,566 $156,064 $282,047 $579,044 Reports produced and compiled by RE STATS Inc. Information is deemed reliable but not guaranteed. Does not reflect all market activity. pp. 4 Steve Reese 405-848-9944 steve@oklahomarealtors.com
- 6. Monthly Inventory Analysis Data from the The Oklahoma Association of REALTORS® February 2013 Active Inventory as of Mar 12, 2013 Months Supply of Inventory Report Produced on: Mar 14, 2013 Area Delimited by Entire OK State MLS - Single-Family Property Type MSI FOR FEBRUARY INDICATORS FOR FEBRUARY 2013 2009 2010 2011 2012 2013 Inventory Closed Absorption MSI MSI % 8.3 41,033 7.7 5.8 17.235% 6.7 6.5 19,840 5.8 1 Year 3,419 End of Closed Average Months Percent -25.08% Month Last Closed per Supply Months 2 Year Active 12 Month over of Supply of -30.30% Inventory Months 12 Months Inventory Inventory 5 YEAR MARKET ACTIVITY TRENDS 5yr FEB AVG = 7.0 3 MONTHS 10 High D 6.4 9 Jun 2011 = 9.9 E 8 Low C 7 6 Feb 2013 = 5.8 J 6.0 5 A Months Supply 4 Months Supply this N -5.62% 3 2 month at 5.8, 1 below the 5 yr FEB F 5.8 0 E Jun 2009 Dec 2009 Jun 2010 Dec 2010 Jun 2011 Dec 2011 Jun 2012 Dec 2012 average of 7.0 B -3.89% MONTHS SUPPLY & BEDROOMS DISTRIBUTION BY PRICE Distribution of Active Inventory by Price Range and MSI % MSI 2 Beds 3 Beds 4 Beds 5 Beds+ $50,000 and less 1,892 9.54% 4.3 5.4 3.4 4.2 3.8 $50,001 $70,000 1,669 8.41% 6.6 7.6 6.1 6.7 9.6 $70,001 $110,000 3,624 18.27% 6.0 6.9 5.5 6.6 8.6 $110,001 Contact an experienced REALTOR Ready to Buy or Sell Real Estate? $170,000 5,082 25.61% 4.9 5.7 4.8 4.6 8.6 $170,001 $230,000 2,902 14.63% 5.7 6.7 5.8 5.2 6.5 $230,001 $360,000 2,699 13.60% 6.6 8.9 7.0 5.6 8.0 $360,001 and up 1,972 9.94% 11.4 16.2 13.1 9.9 12.7 MSI: 5.8 6.5 5.3 5.9 9.5 Total Active Inventory: 19,840 4,631 9,918 4,441 850 Reports produced and compiled by RE STATS Inc. Information is deemed reliable but not guaranteed. Does not reflect all market activity. pp. 5 Steve Reese 405-848-9944 steve@oklahomarealtors.com
- 7. Monthly Inventory Analysis Data from the The Oklahoma Association of REALTORS® February 2013 Closed Sales as of Mar 12, 2013 Average Days on Market to Sale Report Produced on: Mar 14, 2013 Area Delimited by Entire OK State MLS - Single-Family Property Type FEBRUARY YEAR TO DATE (YTD) 2009 2010 2011 2012 2013 2009 2010 2011 2012 2013 97 95 93 94 94 91 87 87 85 84 1 Year 1 Year -7.80% -9.27% 2 Year 2 Year -10.80% -11.11% 5 YEAR MARKET ACTIVITY TRENDS 5yr FEB AVG = 92 3 MONTHS Average Days on Market 100 High D 82 90 Mar 2011 = 98 E 80 Low C 70 60 May 2010 = 74 J 82 50 A 40 Average DOM this N -0.41% 30 20 month at 87, 10 below the 5 yr FEB F 87 0 E Jun 2009 Dec 2009 Jun 2010 Dec 2010 Jun 2011 Dec 2011 Jun 2012 Dec 2012 average of 92 B 6.03% AVERAGE DOM OF CLOSED SALES & BEDROOMS DISTRIBUTION BY PRICE Distribution of Average Days on Market to Sale by Price Range % AVDOM 2 Beds 3 Beds 4 Beds 5 Beds+ $25,000 and less 126 4.74% 70.1 66.3 77.0 47.0 0.0 $25,001 $50,000 252 9.47% 75.6 79.4 69.7 86.0 186.0 $50,001 $100,000 563 21.16% 86.1 98.4 79.2 105.2 67.2 $100,001 Contact an experienced REALTOR Ready to Buy or Sell Real Estate? $150,000 660 24.80% 85.0 99.8 81.1 87.8 109.0 $150,001 $200,000 451 16.95% 92.6 115.2 89.2 83.8 169.8 $200,001 $275,000 333 12.51% 90.5 118.6 92.5 80.8 116.1 $275,001 and up 276 10.37% 97.4 124.0 82.6 96.6 107.2 Average Closed DOM: 86.9 95.8 81.8 88.2 111.5 Total Closed Units: 2,661 533 1470 579 79 Total Closed Volume: 418,673,086 57.48M 194.90M 135.23M 31.07M Reports produced and compiled by RE STATS Inc. Information is deemed reliable but not guaranteed. Does not reflect all market activity. pp. 6 Steve Reese 405-848-9944 steve@oklahomarealtors.com
- 8. Monthly Inventory Analysis Data from the The Oklahoma Association of REALTORS® February 2013 Closed Sales as of Mar 12, 2013 Average List Price at Closing Report Produced on: Mar 14, 2013 Area Delimited by Entire OK State MLS - Single-Family Property Type FEBRUARY YEAR TO DATE (YTD) 2009 2010 2011 2012 2013 2009 2010 2011 2012 2013 163,695 159,292 145,533 147,219 148,077 148,255 144,995 141,238 141,933 142,678 1 Year 1 Year +10.55% +9.86% 2 Year 2 Year +11.19% +7.44% 5 YEAR MARKET ACTIVITY TRENDS 5yr FEB AVG = 149K 3 MONTHS Average List Price 200,000 High D 164,864 Nov 2012 = 168,391 E Low C Jan 2010 = 139,039 J 154,590 100,000 A Average LPrice this N -6.23% month at 163,695, above the 5 yr FEB F 163,695 E 0 Jun 2009 Dec 2009 Jun 2010 Dec 2010 Jun 2011 Dec 2011 Jun 2012 Dec 2012 average of 149,152 B 5.89% AVERAGE LIST PRICE OF CLOSED SALES & BEDROOMS DISTRIBUTION BY PRICE Distribution of Average List Price at Closing by Price Range % AVL$ 2 Beds 3 Beds 4 Beds 5 Beds+ $25,000 and less 104 3.91% 18,544 21,171 21,020 16,317 0 $25,001 $50,000 239 8.98% 38,527 40,786 42,390 44,813 46,500 $50,001 $100,000 538 20.22% 77,582 79,725 82,731 83,213 96,260 $100,001 Contact an experienced REALTOR Ready to Buy or Sell Real Estate? $150,000 677 25.44% 127,516 130,767 130,717 133,303 150,080 $150,001 $200,000 479 18.00% 174,529 178,762 176,878 176,756 177,225 $200,001 $275,000 326 12.25% 236,543 236,368 238,871 243,276 240,399 $275,001 and up 298 11.20% 455,289 401,315 445,476 458,882 560,686 Average List Price: $163,695 $112,626 $137,678 $242,320 $416,111 Total Closed Units: 2,661 533 1470 579 79 Total List Volume: 435,592,678 60.03M 202.39M 140.30M 32.87M Reports produced and compiled by RE STATS Inc. Information is deemed reliable but not guaranteed. Does not reflect all market activity. pp. 7 Steve Reese 405-848-9944 steve@oklahomarealtors.com
- 9. Monthly Inventory Analysis Data from the The Oklahoma Association of REALTORS® February 2013 Closed Sales as of Mar 12, 2013 Average Sold Price at Closing Report Produced on: Mar 14, 2013 Area Delimited by Entire OK State MLS - Single-Family Property Type FEBRUARY YEAR TO DATE (YTD) 2009 2010 2011 2012 2013 2009 2010 2011 2012 2013 157,337 153,596 139,788 141,115 142,386 141,936 139,177 136,201 136,446 136,980 1 Year 1 Year +10.50% +10.36% 2 Year 2 Year +11.50% +8.22% 5 YEAR MARKET ACTIVITY TRENDS 5yr FEB AVG = 143K 3 MONTHS Average Sold Price 200,000 High D 159,240 Nov 2012 = 162,812 E Low C Jan 2010 = 133,401 J 149,602 100,000 A Average SPrice this N -6.05% month at 157,337, above the 5 yr FEB F 157,337 E 0 Jun 2009 Dec 2009 Jun 2010 Dec 2010 Jun 2011 Dec 2011 Jun 2012 Dec 2012 average of 143,365 B 5.17% AVERAGE SOLD PRICE OF CLOSED SALES & BEDROOMS DISTRIBUTION BY PRICE Distribution of Average Sold Price at Closing by Price Range % AVS$ 2 Beds 3 Beds 4 Beds 5 Beds+ $25,000 and less 126 4.74% 17,784 17,534 18,310 15,100 0 $25,001 $50,000 252 9.47% 38,344 37,426 38,827 38,612 43,500 $50,001 $100,000 563 21.16% 77,205 74,553 77,956 78,242 83,780 $100,001 Contact an experienced REALTOR Ready to Buy or Sell Real Estate? $150,000 660 24.80% 127,248 126,573 126,966 129,010 139,880 $150,001 $200,000 451 16.95% 173,143 173,788 173,127 172,865 171,000 $200,001 $275,000 333 12.51% 235,173 231,712 232,510 237,881 235,299 $275,001 and up 276 10.37% 445,363 387,443 421,440 437,107 528,343 Average Closed Price: $157,337 $107,843 $132,582 $233,550 $393,320 Total Closed Units: 2,661 533 1470 579 79 Total Closed Volume: 418,673,086 57.48M 194.90M 135.23M 31.07M Reports produced and compiled by RE STATS Inc. Information is deemed reliable but not guaranteed. Does not reflect all market activity. pp. 8 Steve Reese 405-848-9944 steve@oklahomarealtors.com
- 10. Monthly Inventory Analysis Data from the The Oklahoma Association of REALTORS® February 2013 Closed Sales as of Mar 12, 2013 Average Percent of List Price to Selling Price Report Produced on: Mar 14, 2013 Area Delimited by Entire OK State MLS - Single-Family Property Type FEBRUARY YEAR TO DATE (YTD) 2009 2010 2011 2012 2013 2009 2010 2011 2012 2013 95.90% 95.88% 96.17% 95.62% 95.62% 95.70% 95.43% 95.45% 95.29% 95.45% 1 Year 1 Year +0.27% +0.76% 2 Year 2 Year +0.47% +0.92% 5 YEAR MARKET ACTIVITY TRENDS 5yr FEB AVG=95.69% 3 MONTHS Average List/Sell Price 97 High D 96.40% Nov 2009 = 96.95% E Low C Jan 2011 = 95.15% J 96.49% 96 A Average List/Sell this N 0.08% month at 95.88%, above the 5 yr FEB F 95.88% E 95 Jun 2009 Dec 2009 Jun 2010 Dec 2010 Jun 2011 Dec 2011 Jun 2012 Dec 2012 average of 95.69% B -0.63% AVERAGE L/S% OF CLOSED SALES & BEDROOMS DISTRIBUTION BY PRICE Distribution of $avgmed L/S % by Price Range % AVL/S% 2 Beds 3 Beds 4 Beds 5 Beds+ $25,000 and less 126 4.74% 87.12% 85.23% 89.64% 91.18% 0.00% $25,001 $50,000 252 9.47% 92.98% 93.33% 93.37% 89.32% 93.19% $50,001 $100,000 563 21.16% 94.44% 94.00% 94.65% 94.71% 87.79% $100,001 Contact an experienced REALTOR Ready to Buy or Sell Real Estate? $150,000 660 24.80% 97.48% 99.30% 97.22% 96.91% 93.29% $150,001 $200,000 451 16.95% 97.84% 97.23% 98.02% 97.87% 96.45% $200,001 $275,000 333 12.51% 97.77% 98.17% 97.53% 97.84% 97.98% $275,001 and up 276 10.37% 96.17% 96.79% 95.96% 96.48% 95.28% Average List/Sell Ratio: 95.90% 94.54% 96.06% 96.76% 95.16% Total Closed Units: 2,661 533 1470 579 79 Total Closed Volume: 418,673,086 57.48M 194.90M 135.23M 31.07M Reports produced and compiled by RE STATS Inc. Information is deemed reliable but not guaranteed. Does not reflect all market activity. pp. 9 Steve Reese 405-848-9944 steve@oklahomarealtors.com
- 11. Monthly Inventory Analysis Data from the The Oklahoma Association of REALTORS® February 2013 Inventory as of Mar 12, 2013 Market Summary Report Produced on: Mar 14, 2013 Area Delimited by Entire OK State MLS - Single-Family Property Type Inventory Inventory Market Activity Market Activity New Listings Closed Sales 5,476 = 20.93% 2,661 = 9.24% Start Inventory Pending Sales 20,685 3,910 = 13.58% Total Inventory Other Off Market Units 2,383 = 8.28% 26,161 Volume Active Inventory $5,034,545,406 19,840 = 68.90% Absorption: Last 12 months, an Average of 3,446 Sales/Month FEBRUARY Year To Date Active Inventory as of February 28, 2013 = 19,840 2012 2013 +/-% 2012 2013 +/-% Closed Sales 2,418 2,661 10.05% 4,733 5,153 8.87% Pending Sales 3,252 3,910 20.23% 6,381 7,456 16.85% New Listings 5,496 5,476 -0.36% 11,638 11,421 -1.86% Average List Price 148,077 163,695 10.55% 144,995 159,292 9.86% Average Sale Price 142,386 157,337 10.50% 139,177 153,596 10.36% Average Percent of List Price to Selling Price 95.62% 95.88% 0.27% 95.45% 96.17% 0.76% Average Days on Market to Sale 94.23 86.89 -7.80% 93.13 84.50 -9.27% Monthly Inventory 23,800 19,840 -16.64% 23,800 19,840 -16.64% Months Supply of Inventory 7.85 5.76 -26.63% 7.85 5.76 -26.63% 2012 2012 FEBRUARY MARKET 2013 AVERAGE PRICES 2013 New Listings Pending Listings List Price Sale Price 5,496 5,476 163,695 157,337 3,910 148,077 3,252 142,386 -0.36% +20.23% +10.55% +10.50% 2012 2012 INVENTORY 2013 AVERAGE L/S% & DOM 2013 Active Inventory Monthly Supply of Inventory % of List to Sale Price Days on Market to Sale 23,800 7.85 95.88% 94.23 19,840 5.76 95.62% 86.89 -16.64% -26.63% +0.27% -7.80% Reports produced and compiled by RE STATS Inc. Information is deemed reliable but not guaranteed. Does not reflect all market activity. pp. 10 Steve Reese 405-848-9944 steve@oklahomarealtors.com