Mitsubishi electric energy saving data collection server eco webserveriii
Energy Management for the BLM
1.
Energy management solutions for the
Bureau of Land Management
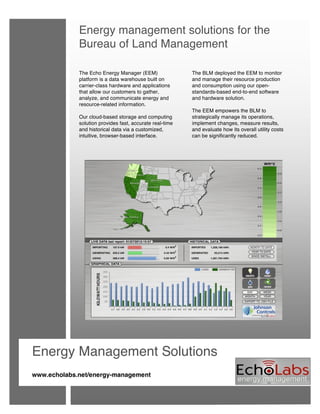
The Echo Energy Manager (EEM)
platform is a data warehouse built on
carrier-class hardware and applications
that allow our customers to gather,
analyze, and communicate energy and
resource-related information.
Our cloud-based storage and computing
solution provides fast, accurate real-time
and historical data via a customized,
intuitive, browser-based interface.
The BLM deployed the EEM to monitor
and manage their resource production
and consumption using our open-
standards-based end-to-end software
and hardware solution.
The EEM empowers the BLM to
strategically manage its operations,
implement changes, measure results,
and evaluate how its overall utility costs
can be significantly reduced.
Energy Management Solutions
www.echolabs.net/energy-management
2.
Solution for the Bureau of Land Management
The energy managers at the BLM were tasked with making significant energy and
resource efficiency upgrades including installing over a megawatt of renewable
energy production and advanced meters as required by the Energy Policy Act of
2005 (Epact 2005). BLM awarded Johnson Controls (JCI) an ESPC contract,
under the terms of the DOE IDIQ for Super ESPCs. Part of the requirement
necessitated that the Bureau monitor and verify the results of the upgrades.
Additionally, the solution needed to operate efficiently in remote locations, as well
as provide aggregate views for field, district and state-level managers.
JCI choose ECHO Labs to engineer and deploy the customized, EEM solution.
Today, the EEM is installed over 50 BLM sites including sites as large as the
Oregon Trail Interpretive Center, and as remote as the Virgin River Campground.
Thanks to the EEM, the BLM can now monitor and manage their electric, water
and natural gas usage as well as their photovoltaic and wind renewable energy
production.
Part of the success of the EEM solution for the Bureau stems from the flexible,
drill-down/up capability of the user interface. Managers can begin to view
information aggregated up to the national view and choose to drill down through
the state, district, and office views to the UI of a specific building reporting to the
data warehouse.
The solution for the BLM was custom-designed to suit the requirements of the
facilitators in charge of the efficiency upgrades. As more and more sites came
online, the flexible platform scaled to provide views based on the organizational
infrastructure of the BLM. Managers are able to make resource decisions within
the framework they already understand.
Key Features of the BLM
EEM Solution
Web-Enabled Interface
runs in the cloud for anywhere
access energy information
Open Data Communication
works with virtually any standard
communication protocol ensuring
a flexible, future-proof, easy to
retrofit solution
Data Exporting
data can be exported in .csv
format allowing for auditing or
specialized analysis
Aggregated & Individual Views
shows total operational, state,
district, campus and building-level
views
3. Case Study: Rawlins Field Office
The results from the EEM deployment at the Rawlins Field Office serve as a useful example of
how the EEM helped the BLM monitor and verify their energy usage leading directly to
conservation actions and ultimately energy cost savings.
The BLM decided to monitor 3 buildings on the Rawlins Field Office campus as well as the
production from a 100kW and a 25 kW wind turbine installed at the site. Figure 1 represents a
typical view of the UI for Rawlins Field Office:
Figure 1: Rawlins Field Office EEM UI
As illustrated in Figure 1, the management staff at the Rawlins Field Office are able to track their
energy usage and production across the campus as well as for each individual building or device
on the system. The interface provides information verifying the performance of the wind turbines
as well as outlining the average demand for each of the 3 buildings being monitored.
Using this information, JCI and the BLM energy managers were able to spot an inefficient trend.
The typical demand for the 3 buildings being monitored at Rawlins Field Office varied between 90
and 80 kW during work hours and fell to approximately 40 kW during non-work hours.
Figure 2: Typical total energy demand for Rawlins buildings (week view)
4. As shown in Figure 2, the demand at Rawlins Field Office was significant during non-working
hours. At an average of 75 hours per week with a demand of approximately 40 kW, that meant
the BLM was paying over $12,000 for the power to run unoccupied buildings.
Using customized, circuit-level monitoring from the EEM, the BLM and Johnson Controls were
able to localize the 40 kW demand and isolate significant inefficiencies in the building load during
non-peak demand.
Based on the findings from the EEM, Johnson Controls created a plan to reduce the demand by
up to 50% during non-working hours, thus reducing the operating costs at Rawlins Field Office by
approximately $6000 annually.
ECHO Labs Energy Management Copyright 2012 Echo Labs, LLC
www.echolabs.net/energy-managment