June 2014 Mid Month Market Stats
•
0 gostou•257 visualizações

Market Stats for June 2014 courtesy of The Toronto Real Estate Board. Sales/Average Price/Days on Market for mid June 2104

Recomendados
Mais conteúdo relacionado
Mais de Michelle Makos
Mais de Michelle Makos (20)
Último
Último (20)
June 2014 Mid Month Market Stats
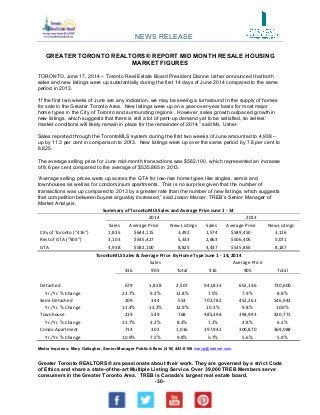
- 1. Greater Toronto REALTORS® are passionate about their work. They are governed by a strict Code of Ethics and share a state-of-the-art Multiple Listing Service. Over 39,000 TREB Members serve consumers in the Greater Toronto Area. TREB is Canada’s largest real estate board. -30- GREATER TORONTO REALTORS® REPORT MID MONTH RESALE HOUSING MARKET FIGURES TORONTO, June 17, 2014 – Toronto Real Estate Board President Dianne Usher announced that both sales and new listings were up substantially during the first 14 days of June 2014 compared to the same period in 2013. “If the first two weeks of June are any indication, we may be seeing a turnaround in the supply of homes for sale in the Greater Toronto Area. New listings were up on a year-over-year basis for most major home types in the City of Toronto and surrounding regions. However, sales growth outpaced growth in new listings, which suggests that there is still a lot of pent-up demand yet to be satisfied, so sellers’ market conditions will likely remain in place for the remainder of 2014,” said Ms. Usher. Sales reported through the TorontoMLS system during the first two weeks of June amounted to 4,938 – up by 11.3 per cent in comparison to 2013. New listings were up over the same period by 7.8 per cent to 8,825. The average selling price for June mid-month transactions was $582,100, which represented an increase of 8.6 per cent compared to the average of $535,865 in 2013. “Average selling prices were up across the GTA for low-rise home types like singles, semis and townhouses as well as for condominium apartments. This is no surprise given that the number of transactions was up compared to 2013 by a greater rate than the number of new listings, which suggests that competition between buyers arguably increased,” said Jason Mercer, TREB’s Senior Manager of Market Analysis. Summary of TorontoMLS Sales and Average Price June 1 -‐ 14 2014 2013 Sales Average Price New Listings Sales Average Price New Listings City of Toronto ("416") 1,835 $644,115 3,492 1,574 $589,450 3,116 Rest of GTA ("905") 3,103 $545,427 5,333 2,863 $506,405 5,071 GTA 4,938 $582,100 8,825 4,437 $535,865 8,187 TorontoMLS Sales & Average Price By Home Type June 1 -‐ 14, 2014 Sales Average Price 416 905 Total 416 905 Total Detached 679 1,828 2,507 941,813 652,146 730,600 Yr./Yr. % Change 23.7% 9.2% 12.8% 7.5% 7.9% 8.8% Semi-‐Detached 209 344 553 702,782 452,261 546,943 Yr./Yr. % Change 12.4% 13.2% 12.9% 10.3% 9.8% 10.0% Townhouse 219 549 768 485,394 394,993 420,771 Yr./Yr. % Change 23.7% 3.2% 8.3% 7.2% 4.8% 6.3% Condo Apartment 714 302 1,016 397,942 300,870 369,088 Yr./Yr. % Change 10.9% 7.5% 9.8% 5.7% 5.6% 5.9% Media Inquiries: Mary Gallagher, Senior Manager Public Affairs (416) 443-8158 maryg@trebnet.com NEWS RELEASE