1. Liquid Chromatograph Mass Spectrometer
SSI-LCMS-060
Liquid Chromatography Mass Spectrometry
Analysis of 90 Multi-Class Drugs
with Polarity Switching in Plasma
Summary: Ninety drugs and internal
standards were prepared in plasma using a
Biotage SLE 96-well plate and analyzed on an
LCMS-8050 .
Background: Plasma is an important matrix to
measure the exposure of the drug prior to
elimination. Clinical research often requires
that drug concentrations in blood be
monitored. The capability of the LCMS-8050 to
detect low concentrations of drugs in plasma
was evaluated.
Method:
A 200 µL aliquot of plasma was extracted
using a Biotage SLE 96-well plate. Samples
were diluted with H2O and eluted using ethyl
acetate. The eluent was then dried down
under nitrogen gas on an SPE dry 96
evaporation system and reconstituted in
mobile phase, all in a 96-well plate. Samples
were analyzed on an LCMS-8050 in MRM
mode with a Nexera MP front end. Drugs were
separated using a Biphenyl column (2.7uM
,100 X 2.1mm) from Restek. All analytes were
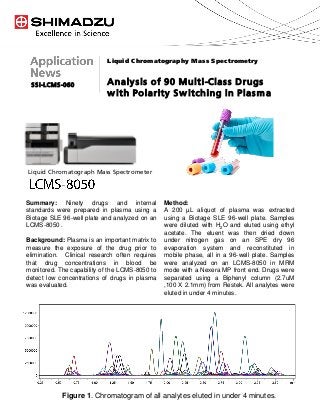
eluted in under 4 minutes.
Figure 1. Chromatogram of all analytes eluted in under 4 minutes.
6. SSI-LCMS-060
Results and Discussion: Ninety different
drugs and internal standards from multiple
drug classes including opioids, amphetamines,
sympathomimetics, benzodiazepines,
barbiturates, tricyclic antidepressants, and
cannabinoids were extracted from plasma.
With an extraction time under an hour, the SLE
extraction in the 96 well format provides a high
throughput sample prep technique to
compliment the ultra fast separations and scan
speeds of the LCMS-8050 coupled to a Nexera
LC system.
Figure 1 shows representative
chromatograms at the LLOQ for a few analytes
demonstrating excellent signal to noise. These
analytes represent the many drug classes that
can be detected and quantitated by the LCMS-
8050. As shown in Table 1 and Figure 2., the
LCMS-8050 demonstrated excellent accuracy
and linearity. Accuracy at the LLOQ ranged
from 96.6% to 107.4%. The R2 value for all
curves was >0.990.
Conclusion: Using a rapid chromatographic
separation, 90 drugs were detected and
quantitated in less than five minutes. The
LCMS-8050 was demonstrated to provide
highly sensitive and accurate detection of
drugs in plasma extracts.