1. T = 69░C
T = 70░C
M
1,000
500
250
base
pair s
10,000
1,000
500
250
base
pair s
10,000
1,000
500
250
base
pair s
10,000
1,000
500
250
base
pair s
10,000
T = 68 ░C
T = 68.5 ░C
T = 69 ░C
T = 70 ░C
M 1 2 3 4 5 6 7 8 9 10 11 12 M 13 14 15 16 17 18 19 20 21 22 23 Neg
Vent Juan De Fuca 21░N 9░N
Specific Site LFS CAS BRM BSZ
Organism
Bodo caudatus
Bodo saliens D C D
Rhynchomonas nasuta D D C D
Isolate LFS2 C D
Other euglenozoa
Non-euglenozoa C (2) C (3) C (1) C (3)
C = cultured
D = DGGE1E6
1E5
1E4
1E3
1E2
1E1
1E0
1E6
1E5
1E4
1E3
1E2
1E1
1E0
1E6
1E5
1E4
1E3
1E2
1E1
1E0
1E6
1E5
1E4
1E3
1E2
1E1
1E0
ViableCells/1E5Cells
CuFeMnZn
0 1 3 7 0 1 3 7 0 1 3 7 0 1 3 7
Caecitellus parvulus strain NBH4
Cafeteria sp. strain EPM1
Cafeteria sp. strain VENT1
Rhynchomonas nasuta strain CBR1
0 M
1E-5 M
1E-4 M
1E-3 M
1E-2 M
Time (Days)
Culturing Molecular Analysis
Microscopical
Identification
Physiological
Experiments
DNASequencing
Database Comparison
& Identification
Primer & Probe Design
DGGE
PCRAmplification of
Total Community DNA ╒ s
PCRAmplification of
Clade-Specific DGGE Fragments
DGGE
DNASequencing
Southern Blotting
Probe Hybridization
0.1
Salpingoeca infusonum
Monosiga brevicollis
Monosigasp. strain BSZ6
Acanthocoepsis unguiculata
Diaphanoeca grandis
Dermocystidium salmonis
Rosette agent of Chinook salmon
Rhinosporidium seeberi
Anurofeca richardsi
Ichthyophonus hoferi
Psorospermium haeckelii
Chytridium confervae
Neocallimastix frontalis
Spizellomyces acuminatus
Bullera crocea
Saccharomyces castellii
Geosmithia putterillii
Neurospora crassa
Ancyromonas sigmoidesATCC50267
Apusomonas proboscidea
Cercomonassp.ATCC50316
Thaumathomonassp.
Heteromita globosa
Massisteria marinaATCC50266
Massisteriasp. strain GBB2
Massisteriasp. strain LFS1
Massisteriasp. strain CAS1
Massisteriasp. strainTPC1
Ochromonas danica
Mallomonas papillosa
Synura spinosa
Paraphysomonas vestita
Paraphysomonas foraminifera
Paraphysomonassp. strainTPC2
Aureococcus anophagefferens
Fucus distichus
Ectocarpus siliculosus
Bolidomonas pacifica
Thalassiosira eccentrica
Bacillaria paxillifer
Hypochytrium catenoides
Phytophthora megasperma
Caecitellus parvulusstrain NBH4
Caecitellus parvulusstrain EWM1
Adriamonas peritocrescens
Siluania monomastiga
Blastocystis hominis
Blastocystissp.
Cafeteriasp. strain EPM1
Cafeteria roenbergensis
Cafeteriasp. strainVENT1
Cafeteriasp. strain EWM2
Labyrinthuloides minuta
Labyrinthuloides haliotidis
Ulkenia profunda
Rhynchobodosp.ATCC 50
Leishmania tarentolae
Endotrypanum monterogeii
Herpetomonas muscarum
Phytomonassp.
Crithidia oncopelti
Blastocrithidia culicis
Bodo caudatus
Trypanoplasma borreli
Cryptobia catostomi
Dimastigella trypaniformis
Rynchomonas nasutaBSZ1
Rynchomonas nasutaCBR1
Bodo saliensATCC 50358
Dutch environmental isolate
Trypanosoma brucei
Kinetoplastid isolate LFS2
Petalomonas
cantuscygniKhawkinea quartana
Euglena gracilis
Lepocinclis ovata
Diplonema papillatum
Diplonemasp.
Massisteriasp. strain DFS1
ANCYROMONADS
APUSOMONADS
FUNGI
DRIP's
CHOANOFLAGELLATES
CERCOMONADS
STRAMENOPILES
KINETO-
PLASTIDS
DIPLONEMIDS
EUGLENIDS
E
U
G
L
E
N
O
Z
O
A
99/98
100/100
22/53
97/99
86/73
96/94
99/95
53/64
87/89
93/93
100/100
79/45
17/56
91/55
41/18
96/51
67/70
100/100
98/84
100/96
89/91
91/95
98/98
98/100
21/
64
99/99
83/87
70/62
100/100
100/100
100/100
94/95
100/100
56/
68
100/100
85/91
51/67
100/100
88/97
92/70
100/100
100/100
67/98
87/78
98/100
57/80
70/98
94/100
44/
77
53/<50
100/100
parasitic/
pathogenic
free-
living
89/40
78/45
65/23
59/31
59/29
65/<5
ME/MP
Cu2+
, Fe2+
, Mn 2+
, Zn2+
pH ~4.5
Mussel/worm beds
provide a good
habitat for flagellates
(Atkins et al. 2000)
pH 6-8.2, 2-30░C
Metal sulfide
precipitates
Vent field
H2S, HS-, S2-
CuFeS2
ZnS
CuS2
FeS
Hypersaline ponds
Freshwater lakes,
ponds, streams
Terrestrial environments
(Ekelund & Patterson 1997)
Sinking particulate
matter with flagellates
(Silver & Alldredge 1981)
Cyst or cell
entrainment
in plume waters
reseeds water
column
Hydrothermal Fluid350░C
Sulfides: Metals:
(Lee & Patterson 1998)
Heterotrophic flagellates are
integral components of
microbial food webs
(Fenchel 1982)
(Caron et al. 1982)
(Azam et al 1983)
(Patterson & Simpson 1996)
Water Column
(Caron et al. 1993)
(Patterson et al. 1993)
Deep-Sea Benthos
(Small & Gross 1985)
(Turley et al, 1988)
(Atkins et al. 1998)
Flagellate community
density decreases
with depth in both
soil and sediments
Illustration by J ack Cook,WHOI Graphics
62íC 67íC 72íC
68íC
62íC 67íC 72íC
68íC
Euglena gracilis
Bodo caudatus
Caecitellus parvulus
strain EWM1
Monosiga sp.
strain BSZ6
Cafeteria sp.
strain EWM2
Massisteria marina
strain LFS1
Mallomonas papillosa
Bodo
caudatus
Bodo
saliens
M
ixed
PC
R
Products
BioventR
iftia
and
M
ussels
(9░N
)
BioventSurpulid
Zone
(9░N
)
Lobo
Flange
Substrate
(JD
F)
C
lam
Acres
Spire
(21░N
)
M
ixed
PC
R
Products
R
hynchom
onas
nasuta
Isolate
LFS2
Euglena
gracilis
Environmental
Samples
BRM band 1= Bodo saliens
BRM band 2= Rhynchomonas nasuta
BSZ band 1= Rhynchomonas nasuta
LFS band 1= Isolate LFS2
CAS band 1= Bodo saliens
CAS band 2= Rhynchomonas nasuta
Results of sequencing DGGE bands:
Favella*
Balanion*
Thalassiosira*
Rhizosolenia*
Umbilicosphaera*
Thoracosphaera*
Synechococcus*
Prochlorococcus*
Caecitellusá
Cafeteriaá
Rhynchomonasá
Toxicity Threshold of Free Copper (M)
10 101010101010101010 10 1010
-14 -13 -12 -11 -10 -9 -8 -7 -6 -5 -4 -3 -2
* as determined by 50% decrease in growth rate
á as determined by 50% decrease in survival rate
ASSESSMENT OF FLAGELLATE DIVERSITY AT DEEP-SEA HYDROTHERMAL VENTS USING THE COMBINED APPROACH OF CULTURE-DEPENDENT AND CULTURE-INDEPENDENT METHODS
Michael S. Atkins1, Andreas P. Teske1, Craig D. Taylor1, Carl O. Wirsen1, and O. Roger Anderson2
1Woods Hole Oceanographic Institution, Woods Hole, MA USA
2Lamont-Doherty Earth Observatory of Columbia University, Palisades, NY USA
Funding for this research was provided in part by:
The National Science Foundation
The Ocean Ventures Fund/Woods Hole Oceanographic Institution
The Rhinehart Coastal Research Center
The PADI Foundation
Publications from this work:
Atkins, M.S. and A.P. Teske. Detection and distribution patterns of kinetoplastid flagellates at deep-sea hydrothermal vents as determined by cul
turing and denaturing gradient gel electrophoresis. Applied and Environmental Microbiology, in preparation.
Atkins, M.S., M.A. Hanna, E.A. Kupetsky, M.A. Saito, C.D. Taylor and C.O. Wirsen. Tolerance of flagellated protozoa to extreme environmental
conditions potentially encountered at deep-sea hydrothermal vents: I. High sulfide; II. High concentrations of Cu, Fe, Mn, and Zn. Marine Ecol
ogy Progress Series, submitted.
Atkins, M.S., A.G. McArthur and A.P. Teske. 2000b. Ancyromonadida: a new phylogenetic lineage among the protozoa closely related to the com
mon ancestor of Metazoans, Fungi, and Choanoflagellates (Opisthokonta). Journal of Molecular Evolution 51:278-285.
Atkins, M.S., A.P. Teske and O.R. Anderson. 2000a. A survey of flagellate diversity at four deep-sea hydrothermal vents in the Eastern Pacific
Ocean using structural and molecular approaches. Journal of Eukaryotic Microbiology 47(4):400-411.
Atkins, M.S., O.R. Anderson and C.O. Wirsen. 1998. Effect of hydrostatic pressure on the growth rates and encystment of flagellated protozoa
isolated from a deep-sea hydrothermal vent and a deep shelf region. Marine Ecology Progress Series 171: 85-95.
Abstract: Eighteen strains of flagellated
protists representing 9 species were isolated
and cultured from four deep-sea hydrother
mal vents in the Eastern Pacific Ocean: Juan
de Fuca Ridge, Guaymas Basin, and both 21
N and 9 N on the East Pacific Rise (EPR).
The hydrothermal vent flagellates belonged
to six different taxonomic orders: the Ancyro
monadida, Bicosoecida, Cercomonadida,
Choanoflagellida, Chrysomonadida, and Ki
netoplastida. Many of the vent isolates were
ubiquitous members of marine, freshwater,
and terrestrial ecosystems worldwide, sug
gesting a global distribution of these flagel
late species. This discovery advanced the hy
pothesis that ubiquity in distribution patterns
among heterotrophic flagellates implies high
tolerance and/or adaptability to a wide range
of environmental conditions. Experiments
under vent conditions of high pressure and
high concentrations of metals and sulfide
showed that some of these species are very
tolerant to extreme environmental conditions.
Deep-sea vent samples were both cultured
to select for kinetoplastid flagellates and ana
lyzed without culturing by denaturing gradient
gel electrophoresis (DGGE) using PCR pri
mers specific to the kinetoplastid clade. By
comparing these two different methods of
analysis, my goal was to decrease the biases
and/or errors inherent in either method alone
and to improve our ability to assess flagellate
diversity and distribution in samples from re
mote vent environments. PCR and DGGE
were used to specifically isolate and amplify
target DNA's from all cultured kinetoplastid
species in matching vent samples, thus cor
roborating the findings of culturing. Molecu
lar methods had the additional ability to de
tect species presence where culturing did
not, thereby providing a better indication of
the distribution of these species.
Species Strain Collection Location Vent
Ancyromonadida, Cavalier-Smith, 1998
Ancyromonas sigmoides, Kent, 1880 50267 American Type Culture Collection
Ancyromonas sigmoides, Kent, 1880 BRM2 Biovent Riftia and Mussels Bed 9N
Bicosoecida, GrassÄ and Deflandre, 1952
Cafeteria sp. VENT1 9N vent water - H2S reactors 9N
Cafeteria sp. EWM2 East Wall Mussels Bed 9N
Cafeteria sp. EPM1 Eel Pond Marsh - H2S reactors surface
Caecitellus parvulus, Patterson et al.,1993 BSZ7 Biovent Serpulid Zone 9N
Caecitellus parvulus, Patterson et al.,1993 EWM1 East Wall Mussels Bed 9N
Caecitellus parvulus, Patterson et al.,1993 NBH4 New Bedford Harbor, MA surface
Cercomonadida, Vickerman, 1983
Massisteria marina, Larsen and Patterson, 1990 50266 American Type Culture Collection
Massisteria marina, Larsen and Patterson, 1990 BSZ3 Biovent Serpulid Zone 9N
Massisteria marina, Larsen and Patterson, 1990 GBB2 Guaymas Basin Beggiotoa Mat GBB
Massisteria marina, Larsen and Patterson, 1990 DFS1 Dante Flange Substrates JDF
Massisteria marina, Larsen and Patterson, 1990 LFS1 Lobo Flange Substrates JDF
Massisteria marina, Larsen and Patterson, 1990 CAS1 Clam Acres Spire 21N
Massisteria marina, Larsen and Patterson, 1990 TPC1 Twin Peaks Chimney 21N
Choanoflagellida, Kent, 1880
Monosiga sp. BSZ6 Biovent Serpulid Zone 9N
Chrysomonadida, Engler, 1898
Paraphysomonassp. TPC2 Twin Peaks Chimney 21N
Kinetoplastida, Honigberg, 1963
Rhynchomonas nasuta, Klebs, 1892 CBR1 Chesapeake Bay, MD surface
Rhynchomonas nasuta, Klebs, 1892 BSZ1 Biovent Serpulid Zone 9N
Rhynchomonas nasuta, Klebs, 1892 BSZ2 Biovent Serpulid Zone 9N
Rhynchomonas nasuta, Klebs, 1892 BSZ8 Biovent Serpulid Zone 9N
Bodo saliens, Larsen and Patterson, 1990 50358 American Type Culture Collection
Bodo saliens, Larsen and Patterson, 1990 BRM1 Biovent Riftia and Mussels Bed 9N
Unidentified LFS2 Lobo Flange Substrates JDF
Caecitellus parvulus
strain EWM1
Cafeteria sp.
strain VENT1
Rhynchomonas nasuta
strain BSZ1
Caecitellus parvulus
strain NBH4
Cafeteria sp.
strain EPM1
Rhynchomonas nasuta
strain CBR1
1E6
1E5
1E4
1E3
1E2
1E1
1E0
1E6
1E5
1E4
1E3
1E2
1E1
1E0
1E6
1E5
1E4
1E3
1E2
1E1
1E0
1E6
1E5
1E4
1E3
1E2
1E1
1E0
1E6
1E5
1E4
1E3
1E2
1E1
1E0
1E6
1E5
1E4
1E3
1E2
1E1
1E0
0 1 3 6 24
0 1 3 6 24
0 1 3 6 24
0 1 3 6 24
0 1 3 6 24 168 0 1 3 6 24 168
Time (hours) Time (hours)
ViableCells/1E5Cells
0.0 mM
1.0 mM
10.0 mM
0.1 mM
2.0 mM
20.0 mM
0.5 mM
5.0 mM
30.0 mM
1.4
1.2
1.0
0.8
0.6
0.4
0.2
0.0
1 50 100 150 200 250 300 1 50 100 150 200 250 300 1 50 100 150 200 250 300
1.5
1.0
0.5
0.0
0.5
0.4
0.3
0.2
0.1
0.0
Vent
Shallow
Caecitellus parvulus Rhynchomonas nasuta Monosiga sp.
MeanGrowthRatePerDay
MeanGrowthRatePerDay
MeanGrowthRatePerDay
Hydrostatic Pressure (Atmospheres) Hydrostatic Pressure (Atmospheres) Hydrostatic Pressure (Atmospheres)
Figure 1. Vent map with flagellate species collected
Figure 2. Flow diagram of culture-dependent and culture-independent
methods used on vent samples in this research.
Figure 3. (A) Cafeteria sp. strain VENT 1 showing mastigonemes on anterior
flagellum; (B) Cafeteria sp. strain EPM 1; (C) light micrograph of Caecitellus
parvulus trophs with characteristic gliding morphology; (D) Caecitellus parvu
lus strain NBH 4 (arrow, acronematic flagellar tip); (E) light micrograph of
Rhynchomonas nasuta strain BSZ 1 trophonts with characteristic proboscis;
(F) Rhynchomonas nasuta strain BSZ 1; (G) light micrograph of Rhynchomo
nas nasuta strain CBR 1 trophonts with characteristic proboscis; (H) Rhyncho
monas nasuta strain CBR 1 showing long posterior and short anterior flagella
and proboscis emerging from groove at the base of the snout; (I) unidentified
kinetoplastid flagellate LFS 2 showing two heterokont flagella; (J, K) thin-sec
tion TEM images of Monosiga sp. strain BSZ 6 showing corona of microvilli; (L)
light micrograph of Monosiga sp. strain BSZ 6 showing collar and apical flagel
lum; (M) apical flagellum of Monosiga sp. strain BSZ 6; (N) mastigoneme-cov
ered anterior flagellum of Paraphysomonas sp. strain TPC 2; (O, P) Ancyromo
nas sigmoides strains ATCC 50267 and BRM 2, respectively; (Q) detail of
papillate projections from the latero-ventral groove of Ancyromonas sigmoides
strain BRM 2. All markers = 1.0 m.
Table 1. Pure culture isolates obtained from the American Type Culture Collection
(ATCC), shallow, coastal waters (Chesapeake Bay, MD (CBR), Eel Pond, MA (EPM) and
New Bedford Harbor, MA (NBH)) and four deep-sea hydrothermal vents in the Eastern
Pacific Ocean (Juan De Fuca (JDF), Guaymas Basin (GBB), 21 N and 9 N). Shown
are taxonomic classification, species and strain names, specific collection locations and
vent sites (see Figure 1). All cultures were grown at atmospheric pressure.
Figure 4. Distance tree of hydrothermal vent flagellates based on analysis of near-complete
small subunit ribosomal DNA sequences using euglenozoan flagellates as the outgroup. The evo
lutionary distance between two organisms is obtained by the summation of the length of the con
necting branches along the horizontal axis, using the scale at the bottom. Numbers at nodes
show percent bootstrap support with distance (minimum evolution) followed by maximum parsi
mony (1,000 replicates each). Organisms sequenced in this study are in larger, bold font.
Figure 5. Mean growth rates of vent and shallow-water flagellates with increasing hydrostatic pressure. Error bars are 1 SD.
Figure 6. Light microscopic images of Caecitellus
parvulus strain EWM 1 (A-C) and Rhynchomonas
nasuta strain BSZ 1 (D), and transmission electron
microscopic images of R. nasuta motile cells (E-G)
and cysts (H, I) in whole particle preparations. (A)
C. parvulus trophic cells cultured at atmospheric
pressure showing normal apical and trailing flagella.
(B) A cell after two days at 300 atm showing early
stages of cyst wall formation (arrow) and resorption
of flagella. Note increase in cell size. (C) A fully en
cysted cell after 5 days at 300 atm. (D) R. nasuta
trophic cells cultured at atmospheric pressure show
ing typical proboscis and trailing flagellum. (E) A
carbon-platinum, shadowed flagellum (F) with trail
ing 30 nm thick filaments (arrow) and characteristic
swollen tip (T). (F) Negatively stained motile cell
showing the proboscis (P) and curved flagellum (F)
with a densely-stained, rod-shaped bacterium near
the tip. (G) Carbon-platinum, shadowed motile cell
with curved flagellum (F). (H) Carbon-platinum,
shadowed cyst (C), with a smooth surface, casting a typical shadow (S) for a spheroidal body. (I) An en
larged view of the edge of a cyst showing the smooth surface with a thin negatively stained outer layer (ar
row). Scale bars in (A), (B), and (D) 5 m; (C) 2 m; (E) and (I) 0.3 m; and (F-H) 2 m.
Figure 7. Ultrathin sections of choanoflagellates cultured at ambient atmospheric pressure (A) and at 300
atm (B-E). (A) Normal cell with prominent nucleus (N), mitochondria with flattened cristae and lightly granu
lar matrix (M), osmiophilic, reserve bodies that appear to be lipid (L), and digestive vacuoles (V) containing
early stages of digested food. (B) Pressure-treated
cell with almost normal appearance compared to
(A) showing, however, a somewhat more irregularly-
shaped nucleus (N), some reserve bodies (L), and
digestive vacuoles (V) mainly in late stages. (C) A
cell showing more advanced evidence of encyst
ment (note light deposit of granular material on the
cell surface, arrow) with irregularly shaped nucleus
(N), enlarged digestive vacuoles with loosely ar
ranged membranous components and few dense
reserve bodies. (D) A series of cells showing signs
of increasing encystment (right to left). The nucleus
(N) is smaller and more irregular in shape. Digestive
vacuoles (V), when present, are in late stages with
only membranous matter; the surface of the cell is
increasingly enclosed by an electron-dense granular
deposit that appears to be an early stage of cyst wall deposition (CW). (E) An electron-opaque section of
a wall, apparently a fully-formed cyst, exhibiting a brittle quality and smooth outer surface as is also charac
teristic of kinetoplastid cysts as in Figure 6 (I). Scale bars in (A) and (E) 0.5 m, others 1 m.
Figure 8. Survival in sulfide toxicity experiments. Deep-sea
vent strains are in the left column; shallow-water strains are
in the right column. All sulfide concentrations shown in the
figure legend were tested on each organism; overlaying of
lines occurred at lower concentrations of sulfide for Caecitel
lus and Rhynchomonas up to 24 hr and for all concentrations
of sulfide up to 24 hr for Cafeteria. 95% confidence interval.
Figure 9. Survival in metal toxicity experiments. Metals concentrations represent total metals. All metals concentrations
shown in the figure legend were tested on each organism; overlaying of lines occurred at lower concentrations of all metals.
Figure 10. Copper toxicity data for a variety of marine organisms.
It is important to note that data on species marked with an aster
isk were taken from studies that measured toxicity by decreases
in growth rate, while our study measured toxicity by decreases in
survival in the absence of growth.
Figure 11. Agarose gel results of a
temperature gradient PCR with pri
mers Kin F/R, to determine an ap
proximate annealing temperature
that would specifically amplify eu
glenozoan flagellates while exclud
ing non-euglenozoa. Euglenozoans:
E. gracilis and B. caudatus; Non-eu
glenozoans: cercomonads, M. mari
na; choanoflagellates, Monosiga
sp.; stramenopiles, C. parvulus,
Cafeteria sp., and M. papillosa.
Fragment sizes range from 329-432
base pairs. Vertical lines indicate
approximate annealing tempera
tures along the PCR block gradient;
the heavy line (68 C) corresponds
to the approximate temperature at
which specificity occurs.
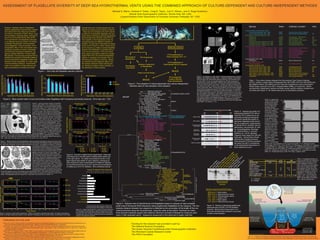
Figure 12. Agarose gel
results of PCR products
amplified while optimiz
ing annealing tempera
ture for euglenozoan
specificity using pri
mers KinF/R. Taking the
results from tempera
ture gradient PCR (Fig
ure 4.2), the optimal
annealing temperature
for the desired specifici
ty was determined to
be 68.5 C. The differ
ence of 0.5 C between
specific and non-specif
ic results is within the
accuracy of the instru
ment used. M = 1 kb
ladder marker (Prome
ga Corp.); Lanes: eu
glenozoa: 1 = Euglena
gracilis; 2 = Bodo cau
datus; 3 = Rhynchomo
nas nasuta strain
CBR1; 4 = Rhynchomo
nas nasuta strain
BSZ1; 5 = kinetoplastid
isolate LFS2; non-euglenozoa: 6 = Ancyromonas sigmoides; 7-12 = Massisteria marina
strains GBB2, DFS1, LFS1, CAS1 and TPC1; 13 = Monosiga sp. strain BSZ6; 14 = Cafeteria
sp. strain EWM2; 15 = Cafeteria sp. strain VENT1; 16 = Caecitellus parvulus strain EWM1; 17
= Caecitellus parvulus strain NBH4; 18 = Mallomonas papillosa; 19 = Cafeteria sp. strain
EPM1; 20 = Cafeteria sp. strain EWM2; 21 = Jakoba libera; 22 = unidentified vent isolate
GBB1; 23 = Paraphysomonas sp. strain TPC2; Neg = negative control.
Figure 13. Results of denaturing gradient gel
electrophoresis (DGGE) of PCR-amplified
products. Mixed product lanes were run to
show that discrete band resolution occurs with
complex mixed samples.
Table 2. A comparison between cul
turing (C) and DGGE (D) methods of
determining the presence of kineto
plastid flagellates at different vent
sites. Also shown are other eugleno
zoan and non-euglenozoan flagel
lates detected at these sites using
the methods indicated. Numbers in
parenthesis indicate the number of
flagellates (> 1) detected by that
method. LFS = Lobo Flange Sub
strates; CAS = Clam Acres Spire;
BRM = Biovent Riftia and Mussels;
BSZ = Biovent Serpulid Zone.
Figure 14. A diagram summarizing the results of this thesis, which support the hypothesis that ubiquity in occurrence pat
terns among heterotrophic flagellates implies high tolerance and/or adaptability to a wide range of environmental conditions.