SlideShare uma empresa Scribd logo
1 de 20
Factorial Design
Full Factorial
Design
Factors: 3
Base Design:
3, 8
Runs: 21
Replicates:
2
Blocks: none
Center pts
(total): 5
Factor Name
Low High
A Fill Rate
(RPM) 20 80
B Ramp Rate
5 75
C Suck Back
2 50
All terms are free
from aliasing
Data Matrix (randomized)
Run A B C
1 0 0 0
2 0 0 0
3 + - -
4 - + +
5 + - -
6 + + -
7 0 0 0
8 0 0 0
9 0 0 0
10 + - +
11 - - +
12 + + +
13 - - -
14 - + +
15 - + -
16 - + -
17 - - +
18 - - -
19 + - +
20 + + -
21 + + +
Factorial Fit: Means of rep versus Fill Rate (R, Ramp Rate, Suck Back
Estimated Effects and Coefficients for Means of repeats (coded units)
Term Effect Coef SE Coef T P
Constant 2.7674 0.007729 358.06 0.000
Fill Rate (RPM) -0.0579 -0.0289 0.007729 -3.74 0.003
Ramp Rate -0.0148 -0.0074 0.007729 -0.96 0.358
Suck Back -0.7130 -0.3565 0.007729 -46.13 0.000
Fill Rate (RPM)*Ramp Rate -0.0242 -0.0121 0.007729 -1.56 0.144
Fill Rate (RPM)*Suck Back 0.0345 0.0172 0.007729 2.23 0.046
Ramp Rate*Suck Back -0.0082 -0.0041 0.007729 -0.53 0.604
Fill Rate (RPM)*Ramp Rate*Suck Back 0.0174 0.0087 0.007729 1.12 0.283
Ct Pt -0.0619 0.015840 -3.90 0.002
S = 0.0309159 R-Sq = 99.45% R-Sq(adj) = 99.08%
Analysis of Variance for Means of repeats (coded units)
Estimated Coefficients for Means of repeats using data in uncoded units
Term Coef
Constant 3.19539
Fill Rate (RPM) -7.68041E-04
Ramp Rate 0.000939980
Suck Back -0.0151664
Fill Rate (RPM)*Ramp Rate -2.04752E-05
Fill Rate (RPM)*Suck Back 1.01513E-05
Ramp Rate*Suck Back -2.21329E-05
Fill Rate (RPM)*Ramp Rate*Suck Back 3.44742E-07
Ct Pt -0.0618525
Effects Pareto for Means of repeats
Alias Structure
I
Fill Rate (RPM)
Ramp Rate
Suck Back
Fill Rate (RPM)*Ramp Rate
Fill Rate (RPM)*Suck Back
Ramp Rate*Suck Back
Fill Rate (RPM)*Ramp Rate*Suck Back
Source DF Seq SS Adj SS Adj MS F P
Main Effects 3 2.04789 2.04789 0.682630 714.20 0.000
2-Way Interactions 3 0.00736 0.00736 0.002454 2.57 0.103
3-Way Interactions 1 0.00121 0.00121 0.001208 1.26 0.283
Curvature 1 0.01457 0.01457 0.014574 15.25 0.002
Residual Error 12 0.01147 0.01147 0.000956
Pure Error 12 0.01147 0.01147 0.000956
Total 20 2.08250
Unusual Observations for Means of repeats
Means
of
Obs StdOrder repeats Fit SE Fit Residual St Resid
7 20 2.63580 2.70556 0.01383 -0.06976 -2.52R
R denotes an observation with a large standardized residual.
Term
St andardized Effect
BC
B
ABC
AB
AC
A
C
50403020100
2.18
Factor Name
A Fill Rate (RPM)
B Ramp Rate
C Suck Back
Pareto Chart of the Standardized Effects
(response is Means of repeats, Alpha = .05)
Reduced Model
Factorial Fit: Means of repeats versus Fill Rate (RPM), Suck Back
Estimated Effects and Coefficients for Means of repeats (coded units)
Term Effect Coef SE Coef T P
Constant 2.7674 0.007945 348.33 0.000
Fill Rate (RPM) -0.0579 -0.0289 0.007945 -3.64 0.002
Suck Back -0.7130 -0.3565 0.007945 -44.87 0.000
Fill Rate (RPM)*Suck Back 0.0345 0.0172 0.007945 2.17 0.045
Ct Pt -0.0619 0.016282 -3.80 0.002
S = 0.0317791 R-Sq = 99.22% R-Sq(adj) = 99.03%
Analysis of Variance for Means of repeats (coded units)
Source DF Seq SS Adj SS Adj MS F P
Main Effects 2 2.04702 2.04702 1.02351 1013.46 0.000
2-Way Interactions 1 0.00475 0.00475 0.00475 4.71 0.045
Curvature 1 0.01457 0.01457 0.01457 14.43 0.002
Residual Error 16 0.01616 0.01616 0.00101
Pure Error 16 0.01616 0.01616 0.00101
Total 20 2.08250
Unusual Observations for Means of repeats
Means
Estimated Coefficients for Means of repeats using data in uncoded units
Term Coef
Constant 3.23299
Fill Rate (RPM) -0.00158705
Suck Back -0.0160517
Fill Rate (RPM)*Suck Back 2.39410E-05
Ct Pt -0.0618525
Effects Pareto for Means of repeats
Alias Structure
I
Fill Rate (RPM)
Suck Back
Fill Rate (RPM)*Suck Back
of
Obs StdOrder repeats Fit SE Fit Residual St Resid
7 20 2.63580 2.70556 0.01421 -0.06976 -2.45R
R denotes an observation with a large standardized residual.
Term
St andardized Effect
AC
A
C
50403020100
2.12
Factor Name
A Fill Rate (RPM)
C Suck Back
Pareto Chart of the Standardized Effects
(response is Means of repeats, Alpha = .05)
Residual
Percent
0.080.040.00-0.04-0.08
99
90
50
10
1
Fitted Value
Residual
3.23.02.82.62.4
0.06
0.03
0.00
-0.03
-0.06
Residual
Frequency
0.060.040.020.00-0.02-0.04-0.06
6.0
4.5
3.0
1.5
0.0
Obser vation Or der
Residual
2018161412108642
0.06
0.03
0.00
-0.03
-0.06
Normal Probabilit y Plot of t he Residuals Residuals Versus t he Fit t ed Values
Hist ogram of t he Residuals Residuals Versus t he Order of t he Dat a
Residual Plots for Means of repeats
MeanofMeansofrepeats
805020
3.2
3.1
3.0
2.9
2.8
2.7
2.6
2.5
2.4
50262
Fill Rate (RPM) Suck Back Point Type
Corner
Center
Main Effects Plot (data means) for Means of repeats
MeanofMeansofrepeats
805020
3.2
3.0
2.8
2.6
2.4
75405
50262
3.2
3.0
2.8
2.6
2.4
Fill Rate (RPM) Ramp Rate
Suck Back
Point Type
Corner
Center
Main Effects Plot (data means) for Means of repeats
Suck Back
Mean
50262
3.2
3.1
3.0
2.9
2.8
2.7
2.6
2.5
2.4
2.3
Fill
50 Center
80 Corner
Rate
(RPM) Point Type
20 Corner
I nteraction Plot (data means) for Means of repeats
Fill Rat e ( RPM )
Ram p Rat e
Suck Back
75405 50262
3.00
2.75
2.50
3.00
2.75
2.50
Fill
50 Center
80 Corner
Rate
(RPM) Point Type
20 Corner
Ramp
40 Center
75 Corner
Rate Point Type
5 Corner
I nteraction Plot (data means) for Means of repeats
50
2
8020
Suck Back
Fill Rate (RPM)
2.70556
2.39920
3.077753.17010
2.42260
Centerpoint
Factorial Point
Cube Plot (data means) for Means of repeats
50
2
75
5
8020
Suck Back
Ramp Rate
Fill Rate (RPM)
2.70556
2.38430
2.414102.43070
2.41450
3.05370
3.101803.15260
3.18760
Centerpoint
Factorial Point
Cube Plot (data means) for Means of repeats
Response Surface Regression: Means of rep versus Fill Rate (R, Ramp Rate, ...
The following terms cannot be estimated, and were removed.
Ramp Rate*Ramp Rate
Suck Back*Suck Back
The analysis was done using coded units.
Estimated Regression Coefficients for Means of repeats
Term Coef SE Coef T P
Constant 2.70556 0.013965 193.733 0.000
Fill Rate (RPM) -0.02894 0.007807 -3.707 0.003
Ramp Rate -0.00739 0.007807 -0.946 0.361
Suck Back -0.35651 0.007807 -45.666 0.000
Fill Rate (RPM)*Fill Rate (RPM) 0.06185 0.015999 3.866 0.002
Fill Rate (RPM)*Ramp Rate -0.01209 0.007807 -1.548 0.146
Fill Rate (RPM)*Suck Back 0.01724 0.007807 2.208 0.046
Ramp Rate*Suck Back -0.00411 0.007807 -0.527 0.607
S = 0.03123 R-Sq = 99.4% R-Sq(adj) = 99.1%
Analysis of Variance for Means of repeats
Source DF Seq SS Adj SS Adj MS F P
Regression 7 2.06983 2.06983 0.295690 303.22 0.000
Linear 3 2.04789 2.04789 0.682630 700.02 0.000
Square 1 0.01457 0.01457 0.014574 14.95 0.002
Interaction 3 0.00736 0.00736 0.002454 2.52 0.104
Residual Error 13 0.01268 0.01268 0.000975
Lack-of-Fit 1 0.00121 0.00121 0.001208 1.26 0.283
Pure Error 12 0.01147 0.01147 0.000956
Total 20 2.08250
Unusual Observations for Means of repeats
Estimated Regression Coefficients for Means of repeats using data in uncoded units
Term Coef
Constant 3.32327
Fill Rate (RPM) -0.00799907
Ramp Rate 0.000491815
Suck Back -0.0158559
Fill Rate (RPM)*Fill Rate (RPM) 6.87250E-05
Fill Rate (RPM)*Ramp Rate -1.15119E-05
Fill Rate (RPM)*Suck Back 2.39410E-05
Ramp Rate*Suck Back -4.89583E-06
Means
of
Obs StdOrder repeats Fit SE Fit Residual St Resid
7 20 2.636 2.706 0.014 -0.070 -2.50 R
R denotes an observation with a large standardized residual.
Reduced Model
Response Surface Regression: Means of repeats versus Fill Rate (RPM), Suck Back
The following terms cannot be estimated, and were removed.
Suck Back*Suck Back
The analysis was done using coded units.
Estimated Regression Coefficients for Means of repeats
Term Coef SE Coef T P
Constant 2.70556 0.014212 190.371 0.000
Fill Rate (RPM) -0.02894 0.007945 -3.642 0.002
Suck Back -0.35651 0.007945 -44.874 0.000
Fill Rate (RPM)*Fill Rate (RPM) 0.06185 0.016282 3.799 0.002
Fill Rate (RPM)*Suck Back 0.01724 0.007945 2.170 0.045
S = 0.03178 R-Sq = 99.2% R-Sq(adj) = 99.0%
Analysis of Variance for Means of repeats
Source DF Seq SS Adj SS Adj MS F P
Regression 4 2.06634 2.06634 0.51659 511.52 0.000
Linear 2 2.04702 2.04702 1.02351 1013.46 0.000
Square 1 0.01457 0.01457 0.01457 14.43 0.002
Interaction 1 0.00475 0.00475 0.00475 4.71 0.045
Residual Error 16 0.01616 0.01616 0.00101
Pure Error 16 0.01616 0.01616 0.00101
Total 20 2.08250
Unusual Observations for Means of repeats
Means
of
Obs StdOrder repeats Fit SE Fit Residual St Resid
7 20 2.636 2.706 0.014 -0.070 -2.45 R
R denotes an observation with a large standardized residual.
Estimated Regression Coefficients for Means of repeats using data in uncoded units
Term Coef
Constant 3.34295
Fill Rate (RPM) -0.00845955
Suck Back -0.0160517
Fill Rate (RPM)*Fill Rate (RPM) 6.87250E-05
Fill Rate (RPM)*Suck Back 2.39410E-05
80
60
Means of r epeats
2.50
2.75
3.00
3.25
Fill Rate ( RPM)400
15 2030 45
Suck Back
Surface Plot of Means of repeats vs Fill Rate (RPM), Suck Back
Suck Back
FillRate(RPM)
5040302010
80
70
60
50
40
30
20
Means of
2.55 - 2.70
2.70 - 2.85
2.85
repeats
- 3.00
3.00 - 3.15
> 3.15
< 2.40
2.40 - 2.55
Contour Plot of Means of repeats vs Fill Rate (RPM), Suck Back
Reduced Model
Response Surface Regression: Means of repeats versus Fill Rate (RPM), Suck Back
The analysis was done using coded units.
Estimated Regression Coefficients for Means of repeats
Term Coef SE Coef T P
Constant 2.70556 0.014212 190.371 0.000
Fill Rate (RPM) -0.02894 0.007945 -3.642 0.002
Suck Back -0.35651 0.007945 -44.874 0.000
Fill Rate (RPM)*Fill Rate (RPM) 0.06185 0.016282 3.799 0.002
Fill Rate (RPM)*Suck Back 0.01724 0.007945 2.170 0.045
S = 0.03178 R-Sq = 99.2% R-Sq(adj) = 99.0%
Analysis of Variance for Means of repeats
Source DF Seq SS Adj SS Adj MS F P
Regression 4 2.06634 2.06634 0.51659 511.52 0.000
Linear 2 2.04702 2.04702 1.02351 1013.46 0.000
Square 1 0.01457 0.01457 0.01457 14.43 0.002
Interaction 1 0.00475 0.00475 0.00475 4.71 0.045
Residual Error 16 0.01616 0.01616 0.00101
Pure Error 16 0.01616 0.01616 0.00101
Total 20 2.08250
Unusual Observations for Means of repeats
Means
of
Obs StdOrder repeats Fit SE Fit Residual St Resid
7 20 2.636 2.706 0.014 -0.070 -2.45 R
R denotes an observation with a large standardized residual.
Estimated Regression Coefficients for Means of repeats using data in uncoded units
Term Coef
Constant 3.34295
Fill Rate (RPM) -0.00845955
Suck Back -0.0160517
Fill Rate (RPM)*Fill Rate (RPM) 6.87250E-05
Fill Rate (RPM)*Suck Back 2.39410E-05
Equation for the Model = 3.34295 – 0.00845955 Fill Rate (RPM) – 0.0160517 Suck Back + 6.87250E-05
Fill Rate (RPM)*Fill Rate (RPM) + 2.39410E-05 Fill Rate (RPM)*Suck Back
One-way ANOVA: Avg4, Avg3, Avg2, Avg1
Source DF SS MS F P
Factor 3 0.0234 0.0078 0.08 0.971
Error 78 7.6049 0.0975
Total 81 7.6283
S = 0.3122 R-Sq = 0.31% R-Sq(adj) = 0.00%
Individual 95% CIs For Mean Based on
Pooled StDev
Level N Mean StDev ---+---------+---------+---------+------
Avg4 21 2.7256 0.3146 (-------------*------------)
Avg3 20 2.7124 0.3064 (-------------*-------------)
Avg2 20 2.7384 0.3050 (-------------*-------------)
Avg1 21 2.7580 0.3221 (-------------*------------)
---+---------+---------+---------+------
2.60 2.70 2.80 2.90
Pooled StDev = 0.3122
Dat a
Frequency
3.43.23.02.82.62.42.22.0
3.0
2.5
2.0
1.5
1.0
0.5
0.0
Mean
2.738 0.3050 20
2.758 0.3221 21
StDev N
2.726 0.3146 21
2.712 0.3064 20
Variable
Avg4
Avg3
Avg2
Avg1
Histogram of Avg4, Avg3, Avg2, Avg1
Normal
Doe with response surface model

Mais conteúdo relacionado

Semelhante a Doe with response surface model

MOSFET Model PSpice vs. Micro-Cap using TOSHIBA MOSFET
MOSFET Model PSpice vs. Micro-Cap using TOSHIBA MOSFETMOSFET Model PSpice vs. Micro-Cap using TOSHIBA MOSFET
MOSFET Model PSpice vs. Micro-Cap using TOSHIBA MOSFETTsuyoshi Horigome
 
Brake Rotor Analysis
Brake Rotor AnalysisBrake Rotor Analysis
Brake Rotor AnalysisSean Clark
 
Roll eccentricity compensation system for an aluminium rolling mill
Roll eccentricity compensation system for an aluminium rolling millRoll eccentricity compensation system for an aluminium rolling mill
Roll eccentricity compensation system for an aluminium rolling millIan Caister
 
Pushover analysis of simply support concrete section beam subjected to increm...
Pushover analysis of simply support concrete section beam subjected to increm...Pushover analysis of simply support concrete section beam subjected to increm...
Pushover analysis of simply support concrete section beam subjected to increm...Salar Delavar Qashqai
 
The Effect of Process Parameters on Surface Roughness in Face Milling
The Effect of Process Parameters on Surface Roughness in Face MillingThe Effect of Process Parameters on Surface Roughness in Face Milling
The Effect of Process Parameters on Surface Roughness in Face Millinginventionjournals
 
SF3L60U PSpice Model (Free SPICE Model)
SF3L60U  PSpice Model (Free SPICE Model)SF3L60U  PSpice Model (Free SPICE Model)
SF3L60U PSpice Model (Free SPICE Model)Tsuyoshi Horigome
 
SF3L60U LTspice Model (Free SPICE Model)
SF3L60U  LTspice Model (Free SPICE Model)SF3L60U  LTspice Model (Free SPICE Model)
SF3L60U LTspice Model (Free SPICE Model)Tsuyoshi Horigome
 
SPICE MODEL of SCS230AE2HR (Professional Model) in SPICE PARK
SPICE MODEL of SCS230AE2HR (Professional Model) in SPICE PARKSPICE MODEL of SCS230AE2HR (Professional Model) in SPICE PARK
SPICE MODEL of SCS230AE2HR (Professional Model) in SPICE PARKTsuyoshi Horigome
 
TC74AC244F PSpice Model (Free SPICE Model)
TC74AC244F PSpice Model (Free SPICE Model)TC74AC244F PSpice Model (Free SPICE Model)
TC74AC244F PSpice Model (Free SPICE Model)Tsuyoshi Horigome
 
TC74AC244FW PSpice Model (Free SPICE Model)
TC74AC244FW PSpice Model (Free SPICE Model)TC74AC244FW PSpice Model (Free SPICE Model)
TC74AC244FW PSpice Model (Free SPICE Model)Tsuyoshi Horigome
 
TC74LCX244F PSpice Model (Free SPICE Model)
TC74LCX244F PSpice Model (Free SPICE Model)TC74LCX244F PSpice Model (Free SPICE Model)
TC74LCX244F PSpice Model (Free SPICE Model)Tsuyoshi Horigome
 
TC74AC244P PSpice Model (Free SPICE Model)
TC74AC244P PSpice Model (Free SPICE Model)TC74AC244P PSpice Model (Free SPICE Model)
TC74AC244P PSpice Model (Free SPICE Model)Tsuyoshi Horigome
 
TC74AC244FT PSpice Model (Free SPICE Model)
TC74AC244FT PSpice Model (Free SPICE Model)TC74AC244FT PSpice Model (Free SPICE Model)
TC74AC244FT PSpice Model (Free SPICE Model)Tsuyoshi Horigome
 
SPICE MODEL of TPCA8059-H (Standard+BDS Model) in SPICE PARK
SPICE MODEL of TPCA8059-H (Standard+BDS Model) in SPICE PARKSPICE MODEL of TPCA8059-H (Standard+BDS Model) in SPICE PARK
SPICE MODEL of TPCA8059-H (Standard+BDS Model) in SPICE PARKTsuyoshi Horigome
 
SPICE MODEL of IDH03G65C5 (Professional Model) in SPICE PARK
SPICE MODEL of IDH03G65C5 (Professional Model) in SPICE PARKSPICE MODEL of IDH03G65C5 (Professional Model) in SPICE PARK
SPICE MODEL of IDH03G65C5 (Professional Model) in SPICE PARKTsuyoshi Horigome
 
SPICE MODEL of DF30JC4 , (Professional Model) in SPICE PARK
SPICE MODEL of DF30JC4 , (Professional Model) in SPICE PARKSPICE MODEL of DF30JC4 , (Professional Model) in SPICE PARK
SPICE MODEL of DF30JC4 , (Professional Model) in SPICE PARKTsuyoshi Horigome
 

Semelhante a Doe with response surface model (20)

MOSFET Model PSpice vs. Micro-Cap using TOSHIBA MOSFET
MOSFET Model PSpice vs. Micro-Cap using TOSHIBA MOSFETMOSFET Model PSpice vs. Micro-Cap using TOSHIBA MOSFET
MOSFET Model PSpice vs. Micro-Cap using TOSHIBA MOSFET
 
Ab data
Ab dataAb data
Ab data
 
Brake Rotor Analysis
Brake Rotor AnalysisBrake Rotor Analysis
Brake Rotor Analysis
 
Roll eccentricity compensation system for an aluminium rolling mill
Roll eccentricity compensation system for an aluminium rolling millRoll eccentricity compensation system for an aluminium rolling mill
Roll eccentricity compensation system for an aluminium rolling mill
 
Pushover analysis of simply support concrete section beam subjected to increm...
Pushover analysis of simply support concrete section beam subjected to increm...Pushover analysis of simply support concrete section beam subjected to increm...
Pushover analysis of simply support concrete section beam subjected to increm...
 
The Effect of Process Parameters on Surface Roughness in Face Milling
The Effect of Process Parameters on Surface Roughness in Face MillingThe Effect of Process Parameters on Surface Roughness in Face Milling
The Effect of Process Parameters on Surface Roughness in Face Milling
 
Progress 1st sem
Progress 1st semProgress 1st sem
Progress 1st sem
 
SF3L60U PSpice Model (Free SPICE Model)
SF3L60U  PSpice Model (Free SPICE Model)SF3L60U  PSpice Model (Free SPICE Model)
SF3L60U PSpice Model (Free SPICE Model)
 
SF3L60U LTspice Model (Free SPICE Model)
SF3L60U  LTspice Model (Free SPICE Model)SF3L60U  LTspice Model (Free SPICE Model)
SF3L60U LTspice Model (Free SPICE Model)
 
Ch15
Ch15Ch15
Ch15
 
Assignment
AssignmentAssignment
Assignment
 
SPICE MODEL of SCS230AE2HR (Professional Model) in SPICE PARK
SPICE MODEL of SCS230AE2HR (Professional Model) in SPICE PARKSPICE MODEL of SCS230AE2HR (Professional Model) in SPICE PARK
SPICE MODEL of SCS230AE2HR (Professional Model) in SPICE PARK
 
TC74AC244F PSpice Model (Free SPICE Model)
TC74AC244F PSpice Model (Free SPICE Model)TC74AC244F PSpice Model (Free SPICE Model)
TC74AC244F PSpice Model (Free SPICE Model)
 
TC74AC244FW PSpice Model (Free SPICE Model)
TC74AC244FW PSpice Model (Free SPICE Model)TC74AC244FW PSpice Model (Free SPICE Model)
TC74AC244FW PSpice Model (Free SPICE Model)
 
TC74LCX244F PSpice Model (Free SPICE Model)
TC74LCX244F PSpice Model (Free SPICE Model)TC74LCX244F PSpice Model (Free SPICE Model)
TC74LCX244F PSpice Model (Free SPICE Model)
 
TC74AC244P PSpice Model (Free SPICE Model)
TC74AC244P PSpice Model (Free SPICE Model)TC74AC244P PSpice Model (Free SPICE Model)
TC74AC244P PSpice Model (Free SPICE Model)
 
TC74AC244FT PSpice Model (Free SPICE Model)
TC74AC244FT PSpice Model (Free SPICE Model)TC74AC244FT PSpice Model (Free SPICE Model)
TC74AC244FT PSpice Model (Free SPICE Model)
 
SPICE MODEL of TPCA8059-H (Standard+BDS Model) in SPICE PARK
SPICE MODEL of TPCA8059-H (Standard+BDS Model) in SPICE PARKSPICE MODEL of TPCA8059-H (Standard+BDS Model) in SPICE PARK
SPICE MODEL of TPCA8059-H (Standard+BDS Model) in SPICE PARK
 
SPICE MODEL of IDH03G65C5 (Professional Model) in SPICE PARK
SPICE MODEL of IDH03G65C5 (Professional Model) in SPICE PARKSPICE MODEL of IDH03G65C5 (Professional Model) in SPICE PARK
SPICE MODEL of IDH03G65C5 (Professional Model) in SPICE PARK
 
SPICE MODEL of DF30JC4 , (Professional Model) in SPICE PARK
SPICE MODEL of DF30JC4 , (Professional Model) in SPICE PARKSPICE MODEL of DF30JC4 , (Professional Model) in SPICE PARK
SPICE MODEL of DF30JC4 , (Professional Model) in SPICE PARK
 

Último

How AI, OpenAI, and ChatGPT impact business and software.
How AI, OpenAI, and ChatGPT impact business and software.How AI, OpenAI, and ChatGPT impact business and software.
How AI, OpenAI, and ChatGPT impact business and software.Curtis Poe
 
WordPress Websites for Engineers: Elevate Your Brand
WordPress Websites for Engineers: Elevate Your BrandWordPress Websites for Engineers: Elevate Your Brand
WordPress Websites for Engineers: Elevate Your Brandgvaughan
 
Unraveling Multimodality with Large Language Models.pdf
Unraveling Multimodality with Large Language Models.pdfUnraveling Multimodality with Large Language Models.pdf
Unraveling Multimodality with Large Language Models.pdfAlex Barbosa Coqueiro
 
"LLMs for Python Engineers: Advanced Data Analysis and Semantic Kernel",Oleks...
"LLMs for Python Engineers: Advanced Data Analysis and Semantic Kernel",Oleks..."LLMs for Python Engineers: Advanced Data Analysis and Semantic Kernel",Oleks...
"LLMs for Python Engineers: Advanced Data Analysis and Semantic Kernel",Oleks...Fwdays
 
Human Factors of XR: Using Human Factors to Design XR Systems
Human Factors of XR: Using Human Factors to Design XR SystemsHuman Factors of XR: Using Human Factors to Design XR Systems
Human Factors of XR: Using Human Factors to Design XR SystemsMark Billinghurst
 
Streamlining Python Development: A Guide to a Modern Project Setup
Streamlining Python Development: A Guide to a Modern Project SetupStreamlining Python Development: A Guide to a Modern Project Setup
Streamlining Python Development: A Guide to a Modern Project SetupFlorian Wilhelm
 
Merck Moving Beyond Passwords: FIDO Paris Seminar.pptx
Merck Moving Beyond Passwords: FIDO Paris Seminar.pptxMerck Moving Beyond Passwords: FIDO Paris Seminar.pptx
Merck Moving Beyond Passwords: FIDO Paris Seminar.pptxLoriGlavin3
 
The Ultimate Guide to Choosing WordPress Pros and Cons
The Ultimate Guide to Choosing WordPress Pros and ConsThe Ultimate Guide to Choosing WordPress Pros and Cons
The Ultimate Guide to Choosing WordPress Pros and ConsPixlogix Infotech
 
Commit 2024 - Secret Management made easy
Commit 2024 - Secret Management made easyCommit 2024 - Secret Management made easy
Commit 2024 - Secret Management made easyAlfredo García Lavilla
 
From Family Reminiscence to Scholarly Archive .
From Family Reminiscence to Scholarly Archive .From Family Reminiscence to Scholarly Archive .
From Family Reminiscence to Scholarly Archive .Alan Dix
 
Tampa BSides - Chef's Tour of Microsoft Security Adoption Framework (SAF)
Tampa BSides - Chef's Tour of Microsoft Security Adoption Framework (SAF)Tampa BSides - Chef's Tour of Microsoft Security Adoption Framework (SAF)
Tampa BSides - Chef's Tour of Microsoft Security Adoption Framework (SAF)Mark Simos
 
SAP Build Work Zone - Overview L2-L3.pptx
SAP Build Work Zone - Overview L2-L3.pptxSAP Build Work Zone - Overview L2-L3.pptx
SAP Build Work Zone - Overview L2-L3.pptxNavinnSomaal
 
Leverage Zilliz Serverless - Up to 50X Saving for Your Vector Storage Cost
Leverage Zilliz Serverless - Up to 50X Saving for Your Vector Storage CostLeverage Zilliz Serverless - Up to 50X Saving for Your Vector Storage Cost
Leverage Zilliz Serverless - Up to 50X Saving for Your Vector Storage CostZilliz
 
Gen AI in Business - Global Trends Report 2024.pdf
Gen AI in Business - Global Trends Report 2024.pdfGen AI in Business - Global Trends Report 2024.pdf
Gen AI in Business - Global Trends Report 2024.pdfAddepto
 
Powerpoint exploring the locations used in television show Time Clash
Powerpoint exploring the locations used in television show Time ClashPowerpoint exploring the locations used in television show Time Clash
Powerpoint exploring the locations used in television show Time Clashcharlottematthew16
 
TrustArc Webinar - How to Build Consumer Trust Through Data Privacy
TrustArc Webinar - How to Build Consumer Trust Through Data PrivacyTrustArc Webinar - How to Build Consumer Trust Through Data Privacy
TrustArc Webinar - How to Build Consumer Trust Through Data PrivacyTrustArc
 
Vertex AI Gemini Prompt Engineering Tips
Vertex AI Gemini Prompt Engineering TipsVertex AI Gemini Prompt Engineering Tips
Vertex AI Gemini Prompt Engineering TipsMiki Katsuragi
 
Dev Dives: Streamline document processing with UiPath Studio Web
Dev Dives: Streamline document processing with UiPath Studio WebDev Dives: Streamline document processing with UiPath Studio Web
Dev Dives: Streamline document processing with UiPath Studio WebUiPathCommunity
 

Último (20)

How AI, OpenAI, and ChatGPT impact business and software.
How AI, OpenAI, and ChatGPT impact business and software.How AI, OpenAI, and ChatGPT impact business and software.
How AI, OpenAI, and ChatGPT impact business and software.
 
WordPress Websites for Engineers: Elevate Your Brand
WordPress Websites for Engineers: Elevate Your BrandWordPress Websites for Engineers: Elevate Your Brand
WordPress Websites for Engineers: Elevate Your Brand
 
Unraveling Multimodality with Large Language Models.pdf
Unraveling Multimodality with Large Language Models.pdfUnraveling Multimodality with Large Language Models.pdf
Unraveling Multimodality with Large Language Models.pdf
 
"LLMs for Python Engineers: Advanced Data Analysis and Semantic Kernel",Oleks...
"LLMs for Python Engineers: Advanced Data Analysis and Semantic Kernel",Oleks..."LLMs for Python Engineers: Advanced Data Analysis and Semantic Kernel",Oleks...
"LLMs for Python Engineers: Advanced Data Analysis and Semantic Kernel",Oleks...
 
DMCC Future of Trade Web3 - Special Edition
DMCC Future of Trade Web3 - Special EditionDMCC Future of Trade Web3 - Special Edition
DMCC Future of Trade Web3 - Special Edition
 
E-Vehicle_Hacking_by_Parul Sharma_null_owasp.pptx
E-Vehicle_Hacking_by_Parul Sharma_null_owasp.pptxE-Vehicle_Hacking_by_Parul Sharma_null_owasp.pptx
E-Vehicle_Hacking_by_Parul Sharma_null_owasp.pptx
 
Human Factors of XR: Using Human Factors to Design XR Systems
Human Factors of XR: Using Human Factors to Design XR SystemsHuman Factors of XR: Using Human Factors to Design XR Systems
Human Factors of XR: Using Human Factors to Design XR Systems
 
Streamlining Python Development: A Guide to a Modern Project Setup
Streamlining Python Development: A Guide to a Modern Project SetupStreamlining Python Development: A Guide to a Modern Project Setup
Streamlining Python Development: A Guide to a Modern Project Setup
 
Merck Moving Beyond Passwords: FIDO Paris Seminar.pptx
Merck Moving Beyond Passwords: FIDO Paris Seminar.pptxMerck Moving Beyond Passwords: FIDO Paris Seminar.pptx
Merck Moving Beyond Passwords: FIDO Paris Seminar.pptx
 
The Ultimate Guide to Choosing WordPress Pros and Cons
The Ultimate Guide to Choosing WordPress Pros and ConsThe Ultimate Guide to Choosing WordPress Pros and Cons
The Ultimate Guide to Choosing WordPress Pros and Cons
 
Commit 2024 - Secret Management made easy
Commit 2024 - Secret Management made easyCommit 2024 - Secret Management made easy
Commit 2024 - Secret Management made easy
 
From Family Reminiscence to Scholarly Archive .
From Family Reminiscence to Scholarly Archive .From Family Reminiscence to Scholarly Archive .
From Family Reminiscence to Scholarly Archive .
 
Tampa BSides - Chef's Tour of Microsoft Security Adoption Framework (SAF)
Tampa BSides - Chef's Tour of Microsoft Security Adoption Framework (SAF)Tampa BSides - Chef's Tour of Microsoft Security Adoption Framework (SAF)
Tampa BSides - Chef's Tour of Microsoft Security Adoption Framework (SAF)
 
SAP Build Work Zone - Overview L2-L3.pptx
SAP Build Work Zone - Overview L2-L3.pptxSAP Build Work Zone - Overview L2-L3.pptx
SAP Build Work Zone - Overview L2-L3.pptx
 
Leverage Zilliz Serverless - Up to 50X Saving for Your Vector Storage Cost
Leverage Zilliz Serverless - Up to 50X Saving for Your Vector Storage CostLeverage Zilliz Serverless - Up to 50X Saving for Your Vector Storage Cost
Leverage Zilliz Serverless - Up to 50X Saving for Your Vector Storage Cost
 
Gen AI in Business - Global Trends Report 2024.pdf
Gen AI in Business - Global Trends Report 2024.pdfGen AI in Business - Global Trends Report 2024.pdf
Gen AI in Business - Global Trends Report 2024.pdf
 
Powerpoint exploring the locations used in television show Time Clash
Powerpoint exploring the locations used in television show Time ClashPowerpoint exploring the locations used in television show Time Clash
Powerpoint exploring the locations used in television show Time Clash
 
TrustArc Webinar - How to Build Consumer Trust Through Data Privacy
TrustArc Webinar - How to Build Consumer Trust Through Data PrivacyTrustArc Webinar - How to Build Consumer Trust Through Data Privacy
TrustArc Webinar - How to Build Consumer Trust Through Data Privacy
 
Vertex AI Gemini Prompt Engineering Tips
Vertex AI Gemini Prompt Engineering TipsVertex AI Gemini Prompt Engineering Tips
Vertex AI Gemini Prompt Engineering Tips
 
Dev Dives: Streamline document processing with UiPath Studio Web
Dev Dives: Streamline document processing with UiPath Studio WebDev Dives: Streamline document processing with UiPath Studio Web
Dev Dives: Streamline document processing with UiPath Studio Web
 

Doe with response surface model

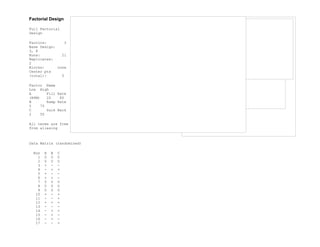
  • 1. Factorial Design Full Factorial Design Factors: 3 Base Design: 3, 8 Runs: 21 Replicates: 2 Blocks: none Center pts (total): 5 Factor Name Low High A Fill Rate (RPM) 20 80 B Ramp Rate 5 75 C Suck Back 2 50 All terms are free from aliasing Data Matrix (randomized) Run A B C 1 0 0 0 2 0 0 0 3 + - - 4 - + + 5 + - - 6 + + - 7 0 0 0 8 0 0 0 9 0 0 0 10 + - + 11 - - + 12 + + + 13 - - - 14 - + + 15 - + - 16 - + - 17 - - +
  • 2. 18 - - - 19 + - + 20 + + - 21 + + + Factorial Fit: Means of rep versus Fill Rate (R, Ramp Rate, Suck Back Estimated Effects and Coefficients for Means of repeats (coded units) Term Effect Coef SE Coef T P Constant 2.7674 0.007729 358.06 0.000 Fill Rate (RPM) -0.0579 -0.0289 0.007729 -3.74 0.003 Ramp Rate -0.0148 -0.0074 0.007729 -0.96 0.358 Suck Back -0.7130 -0.3565 0.007729 -46.13 0.000 Fill Rate (RPM)*Ramp Rate -0.0242 -0.0121 0.007729 -1.56 0.144 Fill Rate (RPM)*Suck Back 0.0345 0.0172 0.007729 2.23 0.046 Ramp Rate*Suck Back -0.0082 -0.0041 0.007729 -0.53 0.604 Fill Rate (RPM)*Ramp Rate*Suck Back 0.0174 0.0087 0.007729 1.12 0.283 Ct Pt -0.0619 0.015840 -3.90 0.002 S = 0.0309159 R-Sq = 99.45% R-Sq(adj) = 99.08% Analysis of Variance for Means of repeats (coded units) Estimated Coefficients for Means of repeats using data in uncoded units Term Coef Constant 3.19539 Fill Rate (RPM) -7.68041E-04 Ramp Rate 0.000939980 Suck Back -0.0151664
  • 3. Fill Rate (RPM)*Ramp Rate -2.04752E-05 Fill Rate (RPM)*Suck Back 1.01513E-05 Ramp Rate*Suck Back -2.21329E-05 Fill Rate (RPM)*Ramp Rate*Suck Back 3.44742E-07 Ct Pt -0.0618525 Effects Pareto for Means of repeats Alias Structure I Fill Rate (RPM) Ramp Rate Suck Back Fill Rate (RPM)*Ramp Rate Fill Rate (RPM)*Suck Back Ramp Rate*Suck Back Fill Rate (RPM)*Ramp Rate*Suck Back Source DF Seq SS Adj SS Adj MS F P Main Effects 3 2.04789 2.04789 0.682630 714.20 0.000 2-Way Interactions 3 0.00736 0.00736 0.002454 2.57 0.103 3-Way Interactions 1 0.00121 0.00121 0.001208 1.26 0.283 Curvature 1 0.01457 0.01457 0.014574 15.25 0.002 Residual Error 12 0.01147 0.01147 0.000956 Pure Error 12 0.01147 0.01147 0.000956 Total 20 2.08250 Unusual Observations for Means of repeats Means of Obs StdOrder repeats Fit SE Fit Residual St Resid 7 20 2.63580 2.70556 0.01383 -0.06976 -2.52R R denotes an observation with a large standardized residual.
  • 4. Term St andardized Effect BC B ABC AB AC A C 50403020100 2.18 Factor Name A Fill Rate (RPM) B Ramp Rate C Suck Back Pareto Chart of the Standardized Effects (response is Means of repeats, Alpha = .05) Reduced Model Factorial Fit: Means of repeats versus Fill Rate (RPM), Suck Back Estimated Effects and Coefficients for Means of repeats (coded units) Term Effect Coef SE Coef T P Constant 2.7674 0.007945 348.33 0.000 Fill Rate (RPM) -0.0579 -0.0289 0.007945 -3.64 0.002 Suck Back -0.7130 -0.3565 0.007945 -44.87 0.000 Fill Rate (RPM)*Suck Back 0.0345 0.0172 0.007945 2.17 0.045 Ct Pt -0.0619 0.016282 -3.80 0.002
  • 5. S = 0.0317791 R-Sq = 99.22% R-Sq(adj) = 99.03% Analysis of Variance for Means of repeats (coded units) Source DF Seq SS Adj SS Adj MS F P Main Effects 2 2.04702 2.04702 1.02351 1013.46 0.000 2-Way Interactions 1 0.00475 0.00475 0.00475 4.71 0.045 Curvature 1 0.01457 0.01457 0.01457 14.43 0.002 Residual Error 16 0.01616 0.01616 0.00101 Pure Error 16 0.01616 0.01616 0.00101 Total 20 2.08250 Unusual Observations for Means of repeats Means Estimated Coefficients for Means of repeats using data in uncoded units Term Coef Constant 3.23299 Fill Rate (RPM) -0.00158705 Suck Back -0.0160517 Fill Rate (RPM)*Suck Back 2.39410E-05 Ct Pt -0.0618525 Effects Pareto for Means of repeats Alias Structure I Fill Rate (RPM) Suck Back Fill Rate (RPM)*Suck Back of Obs StdOrder repeats Fit SE Fit Residual St Resid 7 20 2.63580 2.70556 0.01421 -0.06976 -2.45R R denotes an observation with a large standardized residual.
  • 6. Term St andardized Effect AC A C 50403020100 2.12 Factor Name A Fill Rate (RPM) C Suck Back Pareto Chart of the Standardized Effects (response is Means of repeats, Alpha = .05)
  • 7. Residual Percent 0.080.040.00-0.04-0.08 99 90 50 10 1 Fitted Value Residual 3.23.02.82.62.4 0.06 0.03 0.00 -0.03 -0.06 Residual Frequency 0.060.040.020.00-0.02-0.04-0.06 6.0 4.5 3.0 1.5 0.0 Obser vation Or der Residual 2018161412108642 0.06 0.03 0.00 -0.03 -0.06 Normal Probabilit y Plot of t he Residuals Residuals Versus t he Fit t ed Values Hist ogram of t he Residuals Residuals Versus t he Order of t he Dat a Residual Plots for Means of repeats
  • 8. MeanofMeansofrepeats 805020 3.2 3.1 3.0 2.9 2.8 2.7 2.6 2.5 2.4 50262 Fill Rate (RPM) Suck Back Point Type Corner Center Main Effects Plot (data means) for Means of repeats
  • 9. MeanofMeansofrepeats 805020 3.2 3.0 2.8 2.6 2.4 75405 50262 3.2 3.0 2.8 2.6 2.4 Fill Rate (RPM) Ramp Rate Suck Back Point Type Corner Center Main Effects Plot (data means) for Means of repeats
  • 10. Suck Back Mean 50262 3.2 3.1 3.0 2.9 2.8 2.7 2.6 2.5 2.4 2.3 Fill 50 Center 80 Corner Rate (RPM) Point Type 20 Corner I nteraction Plot (data means) for Means of repeats
  • 11. Fill Rat e ( RPM ) Ram p Rat e Suck Back 75405 50262 3.00 2.75 2.50 3.00 2.75 2.50 Fill 50 Center 80 Corner Rate (RPM) Point Type 20 Corner Ramp 40 Center 75 Corner Rate Point Type 5 Corner I nteraction Plot (data means) for Means of repeats
  • 12. 50 2 8020 Suck Back Fill Rate (RPM) 2.70556 2.39920 3.077753.17010 2.42260 Centerpoint Factorial Point Cube Plot (data means) for Means of repeats
  • 13. 50 2 75 5 8020 Suck Back Ramp Rate Fill Rate (RPM) 2.70556 2.38430 2.414102.43070 2.41450 3.05370 3.101803.15260 3.18760 Centerpoint Factorial Point Cube Plot (data means) for Means of repeats Response Surface Regression: Means of rep versus Fill Rate (R, Ramp Rate, ... The following terms cannot be estimated, and were removed. Ramp Rate*Ramp Rate Suck Back*Suck Back The analysis was done using coded units. Estimated Regression Coefficients for Means of repeats Term Coef SE Coef T P Constant 2.70556 0.013965 193.733 0.000 Fill Rate (RPM) -0.02894 0.007807 -3.707 0.003 Ramp Rate -0.00739 0.007807 -0.946 0.361
  • 14. Suck Back -0.35651 0.007807 -45.666 0.000 Fill Rate (RPM)*Fill Rate (RPM) 0.06185 0.015999 3.866 0.002 Fill Rate (RPM)*Ramp Rate -0.01209 0.007807 -1.548 0.146 Fill Rate (RPM)*Suck Back 0.01724 0.007807 2.208 0.046 Ramp Rate*Suck Back -0.00411 0.007807 -0.527 0.607 S = 0.03123 R-Sq = 99.4% R-Sq(adj) = 99.1% Analysis of Variance for Means of repeats Source DF Seq SS Adj SS Adj MS F P Regression 7 2.06983 2.06983 0.295690 303.22 0.000 Linear 3 2.04789 2.04789 0.682630 700.02 0.000 Square 1 0.01457 0.01457 0.014574 14.95 0.002 Interaction 3 0.00736 0.00736 0.002454 2.52 0.104 Residual Error 13 0.01268 0.01268 0.000975 Lack-of-Fit 1 0.00121 0.00121 0.001208 1.26 0.283 Pure Error 12 0.01147 0.01147 0.000956 Total 20 2.08250 Unusual Observations for Means of repeats Estimated Regression Coefficients for Means of repeats using data in uncoded units Term Coef Constant 3.32327 Fill Rate (RPM) -0.00799907 Ramp Rate 0.000491815 Suck Back -0.0158559 Fill Rate (RPM)*Fill Rate (RPM) 6.87250E-05 Fill Rate (RPM)*Ramp Rate -1.15119E-05 Fill Rate (RPM)*Suck Back 2.39410E-05 Ramp Rate*Suck Back -4.89583E-06 Means of Obs StdOrder repeats Fit SE Fit Residual St Resid 7 20 2.636 2.706 0.014 -0.070 -2.50 R R denotes an observation with a large standardized residual. Reduced Model
  • 15. Response Surface Regression: Means of repeats versus Fill Rate (RPM), Suck Back The following terms cannot be estimated, and were removed. Suck Back*Suck Back The analysis was done using coded units. Estimated Regression Coefficients for Means of repeats Term Coef SE Coef T P Constant 2.70556 0.014212 190.371 0.000 Fill Rate (RPM) -0.02894 0.007945 -3.642 0.002 Suck Back -0.35651 0.007945 -44.874 0.000 Fill Rate (RPM)*Fill Rate (RPM) 0.06185 0.016282 3.799 0.002 Fill Rate (RPM)*Suck Back 0.01724 0.007945 2.170 0.045 S = 0.03178 R-Sq = 99.2% R-Sq(adj) = 99.0% Analysis of Variance for Means of repeats Source DF Seq SS Adj SS Adj MS F P Regression 4 2.06634 2.06634 0.51659 511.52 0.000 Linear 2 2.04702 2.04702 1.02351 1013.46 0.000 Square 1 0.01457 0.01457 0.01457 14.43 0.002 Interaction 1 0.00475 0.00475 0.00475 4.71 0.045 Residual Error 16 0.01616 0.01616 0.00101 Pure Error 16 0.01616 0.01616 0.00101 Total 20 2.08250 Unusual Observations for Means of repeats Means of Obs StdOrder repeats Fit SE Fit Residual St Resid 7 20 2.636 2.706 0.014 -0.070 -2.45 R R denotes an observation with a large standardized residual. Estimated Regression Coefficients for Means of repeats using data in uncoded units Term Coef Constant 3.34295 Fill Rate (RPM) -0.00845955
  • 16. Suck Back -0.0160517 Fill Rate (RPM)*Fill Rate (RPM) 6.87250E-05 Fill Rate (RPM)*Suck Back 2.39410E-05 80 60 Means of r epeats 2.50 2.75 3.00 3.25 Fill Rate ( RPM)400 15 2030 45 Suck Back Surface Plot of Means of repeats vs Fill Rate (RPM), Suck Back
  • 17. Suck Back FillRate(RPM) 5040302010 80 70 60 50 40 30 20 Means of 2.55 - 2.70 2.70 - 2.85 2.85 repeats - 3.00 3.00 - 3.15 > 3.15 < 2.40 2.40 - 2.55 Contour Plot of Means of repeats vs Fill Rate (RPM), Suck Back Reduced Model Response Surface Regression: Means of repeats versus Fill Rate (RPM), Suck Back The analysis was done using coded units. Estimated Regression Coefficients for Means of repeats Term Coef SE Coef T P Constant 2.70556 0.014212 190.371 0.000 Fill Rate (RPM) -0.02894 0.007945 -3.642 0.002 Suck Back -0.35651 0.007945 -44.874 0.000 Fill Rate (RPM)*Fill Rate (RPM) 0.06185 0.016282 3.799 0.002
  • 18. Fill Rate (RPM)*Suck Back 0.01724 0.007945 2.170 0.045 S = 0.03178 R-Sq = 99.2% R-Sq(adj) = 99.0% Analysis of Variance for Means of repeats Source DF Seq SS Adj SS Adj MS F P Regression 4 2.06634 2.06634 0.51659 511.52 0.000 Linear 2 2.04702 2.04702 1.02351 1013.46 0.000 Square 1 0.01457 0.01457 0.01457 14.43 0.002 Interaction 1 0.00475 0.00475 0.00475 4.71 0.045 Residual Error 16 0.01616 0.01616 0.00101 Pure Error 16 0.01616 0.01616 0.00101 Total 20 2.08250 Unusual Observations for Means of repeats Means of Obs StdOrder repeats Fit SE Fit Residual St Resid 7 20 2.636 2.706 0.014 -0.070 -2.45 R R denotes an observation with a large standardized residual. Estimated Regression Coefficients for Means of repeats using data in uncoded units Term Coef Constant 3.34295 Fill Rate (RPM) -0.00845955 Suck Back -0.0160517 Fill Rate (RPM)*Fill Rate (RPM) 6.87250E-05 Fill Rate (RPM)*Suck Back 2.39410E-05 Equation for the Model = 3.34295 – 0.00845955 Fill Rate (RPM) – 0.0160517 Suck Back + 6.87250E-05 Fill Rate (RPM)*Fill Rate (RPM) + 2.39410E-05 Fill Rate (RPM)*Suck Back One-way ANOVA: Avg4, Avg3, Avg2, Avg1 Source DF SS MS F P Factor 3 0.0234 0.0078 0.08 0.971 Error 78 7.6049 0.0975 Total 81 7.6283
  • 19. S = 0.3122 R-Sq = 0.31% R-Sq(adj) = 0.00% Individual 95% CIs For Mean Based on Pooled StDev Level N Mean StDev ---+---------+---------+---------+------ Avg4 21 2.7256 0.3146 (-------------*------------) Avg3 20 2.7124 0.3064 (-------------*-------------) Avg2 20 2.7384 0.3050 (-------------*-------------) Avg1 21 2.7580 0.3221 (-------------*------------) ---+---------+---------+---------+------ 2.60 2.70 2.80 2.90 Pooled StDev = 0.3122 Dat a Frequency 3.43.23.02.82.62.42.22.0 3.0 2.5 2.0 1.5 1.0 0.5 0.0 Mean 2.738 0.3050 20 2.758 0.3221 21 StDev N 2.726 0.3146 21 2.712 0.3064 20 Variable Avg4 Avg3 Avg2 Avg1 Histogram of Avg4, Avg3, Avg2, Avg1 Normal